|
|
市場調査レポート
商品コード
1502080
炭素繊維プリプレグの世界市場 2024-2028Global carbon fiber prepreg market 2024-2028 |
||||||
|
|||||||
カスタマイズ可能
|
|||||||

| 炭素繊維プリプレグの世界市場 2024-2028 |
|
出版日: 2024年05月22日
発行: TechNavio
ページ情報: 英文 173 Pages
納期: 即納可能
|

全表示
- 概要
- 図表
- 目次
炭素繊維プリプレグ市場は2023-2028年に13億4,550万米ドル、予測期間中のCAGRは7.38%で成長すると予測されます。
当レポートでは、炭素繊維プリプレグ市場の全体的な分析、市場規模・予測、動向、成長促進要因、課題、約25のベンダーを網羅したベンダー分析などを掲載しています。
現在の市場シナリオ、最新動向と促進要因、市場環境全体に関する最新分析を提供しています。市場は、風力発電容量の増加、民間航空機での炭素複合材使用の増加、新興経済諸国からの新たな需要が牽引しています。
| 市場範囲 | |
|---|---|
| 基準年 | 2024 |
| 終了年 | 2028 |
| 予測期間 | 2024-2028 |
| 成長モメンタム | 加速 |
| 前年比2024年 | 6.73% |
| CAGR | 7.38% |
| 増分額 | 13億4,550万米ドル |
本調査では、人口増加、都市化、電力需要の増加が、今後数年間の炭素繊維プリプレグ市場成長を牽引する主な要因の1つであるとしています。また、軽量で高性能な素材に対する需要の増加や、低燃費車に対する需要の増加も、市場の大きな需要につながります。
目次
第1章 エグゼクティブサマリー
- 市場概要
第2章 市場情勢
- 市場エコシステム
- 市場の特徴
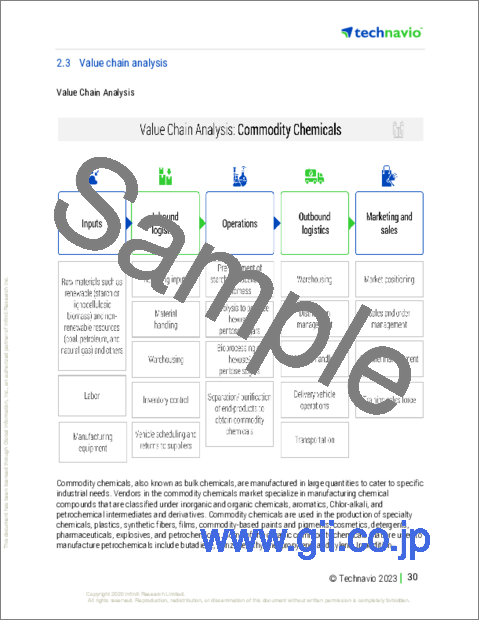
- バリューチェーン分析
第3章 市場規模の評価
- 市場の定義
- 市場セグメント分析
- 市場規模 2023
- 市場の見通し 2023-2028
第4章 市場規模実績
- 世界の炭素繊維プリプレグ市場 2018-2022
- タイプ別セグメント分析 2018-2022
- 用途別セグメント分析 2018-2022
- 地域別セグメント分析 2018-2022
- 国別セグメント分析 2018-2022
第5章 ファイブフォース分析
- ファイブフォースの要約
- 買い手の交渉力
- 供給企業の交渉力
- 新規参入業者の脅威
- 代替品の脅威
- 競争の脅威
- 市況
第6章 市場セグメンテーション:タイプ別
- 市場セグメンテーション
- 比較:タイプ別
- 熱硬化性:市場規模と予測 2023-2028
- 熱可塑性:市場規模と予測 2023-2028
- 市場機会:タイプ別
第7章 市場セグメンテーション:用途別
- 市場セグメンテーション
- 比較:用途別
- 航空宇宙および防衛:市場規模と予測 2023-2028
- 風力エネルギー:市場規模と予測 2023-2028
- 自動車部品:市場規模と予測 2023-2028
- スポーツ用品:市場規模と予測 2023-2028
- 市場機会:用途別
第8章 顧客情勢
- 顧客情勢の概要
第9章 地域別情勢
- 地域別セグメンテーション
- 地域別比較
- 北米:市場規模と予測 2023-2028
- アジア太平洋:市場規模と予測 2023-2028
- 欧州:市場規模と予測 2023-2028
- 南米:市場規模と予測 2023-2028
- 中東・アフリカ:市場規模と予測 2023-2028
- 米国:市場規模と予測 2023-2028
- 中国:市場規模と予測 2023-2028
- 日本:市場規模と予測 2023-2028
- ドイツ:市場規模と予測 2023-2028
- 英国:市場規模と予測 2023-2028
- 市場機会:地域別
第10章 促進要因・課題・機会・抑制要因
- 市場促進要因
- 市場の課題
- 促進要因と課題の影響
- 市場の機会・抑制要因
第11章 競合情勢
- 概要
- 競合情勢
- 混乱の状況
- 業界のリスク
第12章 競合分析
- 企業プロファイル
- 企業の市場ポジショニング
- Axiom Materials Inc.
- Arvind Composites
- Celanese Corp.
- Formosa M Co. Ltd.
- Gurit Holding AG
- Hexcel Corp.
- Kordsa Teknik Tekstil AS
- Mitsubishi Chemical Corp.
- Nippon Steel Corp.
- OCSiAl
- Plastic Reinforcement Fabrics Ltd.
- SGL Carbon SE
- Solvay SA
- Teijin Ltd.
- Toray Composite Materials America Inc.
第13章 付録
Exhibits:
- Exhibits1: Executive Summary - Chart on Market Overview
- Exhibits2: Executive Summary - Data Table on Market Overview
- Exhibits3: Executive Summary - Chart on Global Market Characteristics
- Exhibits4: Executive Summary - Chart on Market by Geography
- Exhibits5: Executive Summary - Chart on Market Segmentation by Type
- Exhibits6: Executive Summary - Chart on Market Segmentation by Application
- Exhibits7: Executive Summary - Chart on Incremental Growth
- Exhibits8: Executive Summary - Data Table on Incremental Growth
- Exhibits9: Executive Summary - Chart on Company Market Positioning
- Exhibits10: Parent Market
- Exhibits11: Data Table on - Parent Market
- Exhibits12: Market characteristics analysis
- Exhibits13: Value Chain Analysis
- Exhibits14: Offerings of companies included in the market definition
- Exhibits15: Market segments
- Exhibits16: Chart on Global - Market size and forecast 2023-2028 ($ million)
- Exhibits17: Data Table on Global - Market size and forecast 2023-2028 ($ million)
- Exhibits18: Chart on Global Market: Year-over-year growth 2023-2028 (%)
- Exhibits19: Data Table on Global Market: Year-over-year growth 2023-2028 (%)
- Exhibits20: Historic Market Size - Data Table on Global Carbon Fiber Prepreg Market 2018 - 2022 ($ million)
- Exhibits21: Historic Market Size - Type Segment 2018 - 2022 ($ million)
- Exhibits22: Historic Market Size - Application Segment 2018 - 2022 ($ million)
- Exhibits23: Historic Market Size - Geography Segment 2018 - 2022 ($ million)
- Exhibits24: Historic Market Size - Country Segment 2018 - 2022 ($ million)
- Exhibits25: Five forces analysis - Comparison between 2023 and 2028
- Exhibits26: Bargaining power of buyers - Impact of key factors 2023 and 2028
- Exhibits27: Bargaining power of suppliers - Impact of key factors in 2023 and 2028
- Exhibits28: Threat of new entrants - Impact of key factors in 2023 and 2028
- Exhibits29: Threat of substitutes - Impact of key factors in 2023 and 2028
- Exhibits30: Threat of rivalry - Impact of key factors in 2023 and 2028
- Exhibits31: Chart on Market condition - Five forces 2023 and 2028
- Exhibits32: Chart on Type - Market share 2023-2028 (%)
- Exhibits33: Data Table on Type - Market share 2023-2028 (%)
- Exhibits34: Chart on Comparison by Type
- Exhibits35: Data Table on Comparison by Type
- Exhibits36: Chart on Thermoset - Market size and forecast 2023-2028 ($ million)
- Exhibits37: Data Table on Thermoset - Market size and forecast 2023-2028 ($ million)
- Exhibits38: Chart on Thermoset - Year-over-year growth 2023-2028 (%)
- Exhibits39: Data Table on Thermoset - Year-over-year growth 2023-2028 (%)
- Exhibits40: Chart on Thermoplastics - Market size and forecast 2023-2028 ($ million)
- Exhibits41: Data Table on Thermoplastics - Market size and forecast 2023-2028 ($ million)
- Exhibits42: Chart on Thermoplastics - Year-over-year growth 2023-2028 (%)
- Exhibits43: Data Table on Thermoplastics - Year-over-year growth 2023-2028 (%)
- Exhibits44: Market opportunity by Type ($ million)
- Exhibits45: Data Table on Market opportunity by Type ($ million)
- Exhibits46: Chart on Application - Market share 2023-2028 (%)
- Exhibits47: Data Table on Application - Market share 2023-2028 (%)
- Exhibits48: Chart on Comparison by Application
- Exhibits49: Data Table on Comparison by Application
- Exhibits50: Chart on Aerospace and defense - Market size and forecast 2023-2028 ($ million)
- Exhibits51: Data Table on Aerospace and defense - Market size and forecast 2023-2028 ($ million)
- Exhibits52: Chart on Aerospace and defense - Year-over-year growth 2023-2028 (%)
- Exhibits53: Data Table on Aerospace and defense - Year-over-year growth 2023-2028 (%)
- Exhibits54: Chart on Wind energy - Market size and forecast 2023-2028 ($ million)
- Exhibits55: Data Table on Wind energy - Market size and forecast 2023-2028 ($ million)
- Exhibits56: Chart on Wind energy - Year-over-year growth 2023-2028 (%)
- Exhibits57: Data Table on Wind energy - Year-over-year growth 2023-2028 (%)
- Exhibits58: Chart on Automotive parts - Market size and forecast 2023-2028 ($ million)
- Exhibits59: Data Table on Automotive parts - Market size and forecast 2023-2028 ($ million)
- Exhibits60: Chart on Automotive parts - Year-over-year growth 2023-2028 (%)
- Exhibits61: Data Table on Automotive parts - Year-over-year growth 2023-2028 (%)
- Exhibits62: Chart on Sports equipment - Market size and forecast 2023-2028 ($ million)
- Exhibits63: Data Table on Sports equipment - Market size and forecast 2023-2028 ($ million)
- Exhibits64: Chart on Sports equipment - Year-over-year growth 2023-2028 (%)
- Exhibits65: Data Table on Sports equipment - Year-over-year growth 2023-2028 (%)
- Exhibits66: Market opportunity by Application ($ million)
- Exhibits67: Data Table on Market opportunity by Application ($ million)
- Exhibits68: Analysis of price sensitivity, lifecycle, customer purchase basket, adoption rates, and purchase criteria
- Exhibits69: Chart on Market share By Geographical Landscape2023-2028 (%)
- Exhibits70: Data Table on Market share By Geographical Landscape2023-2028 (%)
- Exhibits71: Chart on Geographic comparison
- Exhibits72: Data Table on Geographic comparison
- Exhibits73: Chart on North America - Market size and forecast 2023-2028 ($ million)
- Exhibits74: Data Table on North America - Market size and forecast 2023-2028 ($ million)
- Exhibits75: Chart on North America - Year-over-year growth 2023-2028 (%)
- Exhibits76: Data Table on North America - Year-over-year growth 2023-2028 (%)
- Exhibits77: Chart on APAC - Market size and forecast 2023-2028 ($ million)
- Exhibits78: Data Table on APAC - Market size and forecast 2023-2028 ($ million)
- Exhibits79: Chart on APAC - Year-over-year growth 2023-2028 (%)
- Exhibits80: Data Table on APAC - Year-over-year growth 2023-2028 (%)
- Exhibits81: Chart on Europe - Market size and forecast 2023-2028 ($ million)
- Exhibits82: Data Table on Europe - Market size and forecast 2023-2028 ($ million)
- Exhibits83: Chart on Europe - Year-over-year growth 2023-2028 (%)
- Exhibits84: Data Table on Europe - Year-over-year growth 2023-2028 (%)
- Exhibits85: Chart on South America - Market size and forecast 2023-2028 ($ million)
- Exhibits86: Data Table on South America - Market size and forecast 2023-2028 ($ million)
- Exhibits87: Chart on South America - Year-over-year growth 2023-2028 (%)
- Exhibits88: Data Table on South America - Year-over-year growth 2023-2028 (%)
- Exhibits89: Chart on Middle East and Africa - Market size and forecast 2023-2028 ($ million)
- Exhibits90: Data Table on Middle East and Africa - Market size and forecast 2023-2028 ($ million)
- Exhibits91: Chart on Middle East and Africa - Year-over-year growth 2023-2028 (%)
- Exhibits92: Data Table on Middle East and Africa - Year-over-year growth 2023-2028 (%)
- Exhibits93: Chart on US - Market size and forecast 2023-2028 ($ million)
- Exhibits94: Data Table on US - Market size and forecast 2023-2028 ($ million)
- Exhibits95: Chart on US - Year-over-year growth 2023-2028 (%)
- Exhibits96: Data Table on US - Year-over-year growth 2023-2028 (%)
- Exhibits97: Chart on China - Market size and forecast 2023-2028 ($ million)
- Exhibits98: Data Table on China - Market size and forecast 2023-2028 ($ million)
- Exhibits99: Chart on China - Year-over-year growth 2023-2028 (%)
- Exhibits100: Data Table on China - Year-over-year growth 2023-2028 (%)
- Exhibits101: Chart on Japan - Market size and forecast 2023-2028 ($ million)
- Exhibits102: Data Table on Japan - Market size and forecast 2023-2028 ($ million)
- Exhibits103: Chart on Japan - Year-over-year growth 2023-2028 (%)
- Exhibits104: Data Table on Japan - Year-over-year growth 2023-2028 (%)
- Exhibits105: Chart on Germany - Market size and forecast 2023-2028 ($ million)
- Exhibits106: Data Table on Germany - Market size and forecast 2023-2028 ($ million)
- Exhibits107: Chart on Germany - Year-over-year growth 2023-2028 (%)
- Exhibits108: Data Table on Germany - Year-over-year growth 2023-2028 (%)
- Exhibits109: Chart on UK - Market size and forecast 2023-2028 ($ million)
- Exhibits110: Data Table on UK - Market size and forecast 2023-2028 ($ million)
- Exhibits111: Chart on UK - Year-over-year growth 2023-2028 (%)
- Exhibits112: Data Table on UK - Year-over-year growth 2023-2028 (%)
- Exhibits113: Market opportunity By Geographical Landscape($ million)
- Exhibits114: Data Tables on Market opportunity By Geographical Landscape($ million)
- Exhibits115: Impact of drivers and challenges in 2023 and 2028
- Exhibits116: Overview on criticality of inputs and factors of differentiation
- Exhibits117: Overview on factors of disruption
- Exhibits118: Impact of key risks on business
- Exhibits119: Companies covered
- Exhibits120: Matrix on companies position and classification
- Exhibits121: Axiom Materials Inc. - Overview
- Exhibits122: Axiom Materials Inc. - Product / Service
- Exhibits123: Axiom Materials Inc. - Key offerings
- Exhibits124: Arvind Composites - Overview
- Exhibits125: Arvind Composites - Product / Service
- Exhibits126: Arvind Composites - Key offerings
- Exhibits127: Celanese Corp. - Overview
- Exhibits128: Celanese Corp. - Business segments
- Exhibits129: Celanese Corp. - Key offerings
- Exhibits130: Celanese Corp. - Segment focus
- Exhibits131: Formosa M Co. Ltd. - Overview
- Exhibits132: Formosa M Co. Ltd. - Product / Service
- Exhibits133: Formosa M Co. Ltd. - Key offerings
- Exhibits134: Gurit Holding AG - Overview
- Exhibits135: Gurit Holding AG - Business segments
- Exhibits136: Gurit Holding AG - Key offerings
- Exhibits137: Gurit Holding AG - Segment focus
- Exhibits138: Hexcel Corp. - Overview
- Exhibits139: Hexcel Corp. - Business segments
- Exhibits140: Hexcel Corp. - Key offerings
- Exhibits141: Hexcel Corp. - Segment focus
- Exhibits142: Kordsa Teknik Tekstil AS - Overview
- Exhibits143: Kordsa Teknik Tekstil AS - Business segments
- Exhibits144: Kordsa Teknik Tekstil AS - Key offerings
- Exhibits145: Kordsa Teknik Tekstil AS - Segment focus
- Exhibits146: Mitsubishi Chemical Corp. - Overview
- Exhibits147: Mitsubishi Chemical Corp. - Business segments
- Exhibits148: Mitsubishi Chemical Corp. - Key offerings
- Exhibits149: Mitsubishi Chemical Corp. - Segment focus
- Exhibits150: Nippon Steel Corp. - Overview
- Exhibits151: Nippon Steel Corp. - Business segments
- Exhibits152: Nippon Steel Corp. - Key offerings
- Exhibits153: Nippon Steel Corp. - Segment focus
- Exhibits154: OCSiAl - Overview
- Exhibits155: OCSiAl - Product / Service
- Exhibits156: OCSiAl - Key offerings
- Exhibits157: Plastic Reinforcement Fabrics Ltd. - Overview
- Exhibits158: Plastic Reinforcement Fabrics Ltd. - Product / Service
- Exhibits159: Plastic Reinforcement Fabrics Ltd. - Key offerings
- Exhibits160: SGL Carbon SE - Overview
- Exhibits161: SGL Carbon SE - Business segments
- Exhibits162: SGL Carbon SE - Key offerings
- Exhibits163: SGL Carbon SE - Segment focus
- Exhibits164: Solvay SA - Overview
- Exhibits165: Solvay SA - Business segments
- Exhibits166: Solvay SA - Key news
- Exhibits167: Solvay SA - Key offerings
- Exhibits168: Solvay SA - Segment focus
- Exhibits169: Teijin Ltd. - Overview
- Exhibits170: Teijin Ltd. - Business segments
- Exhibits171: Teijin Ltd. - Key offerings
- Exhibits172: Teijin Ltd. - Segment focus
- Exhibits173: Toray Composite Materials America Inc. - Overview
- Exhibits174: Toray Composite Materials America Inc. - Product / Service
- Exhibits175: Toray Composite Materials America Inc. - Key offerings
- Exhibits176: Inclusions checklist
- Exhibits177: Exclusions checklist
- Exhibits178: Currency conversion rates for US$
- Exhibits179: Research methodology
- Exhibits180: Information sources
- Exhibits181: Data validation
- Exhibits182: Validation techniques employed for market sizing
- Exhibits183: Data synthesis
- Exhibits184: 360 degree market analysis
- Exhibits185: List of abbreviations
The carbon fiber prepreg market is forecasted to grow by USD 1345.5 mn during 2023-2028, accelerating at a CAGR of 7.38% during the forecast period. The report on the carbon fiber prepreg market provides a holistic analysis, market size and forecast, trends, growth drivers, and challenges, as well as vendor analysis covering around 25 vendors.
The report offers an up-to-date analysis regarding the current market scenario, the latest trends and drivers, and the overall market environment. The market is driven by growth of wind power capacities, increasing use of carbon composites in commercial aircraft, and emerging demand from developing economies.
Technavio's carbon fiber prepreg market is segmented as below:
| Market Scope | |
|---|---|
| Base Year | 2024 |
| End Year | 2028 |
| Series Year | 2024-2028 |
| Growth Momentum | Accelerate |
| YOY 2024 | 6.73% |
| CAGR | 7.38% |
| Incremental Value | $1345.5mn |
By Type
- Thermoset
- Thermoplastics
By Application
- Aerospace and defense
- Wind energy
- Automotive parts
- Sports equipment
By Geography
- North America
- APAC
- Europe
- South America
- Middle East and Africa
This study identifies the rising population, urbanization, and increasing power requirement as one of the prime reasons driving the carbon fiber prepreg market growth during the next few years. Also, increasing demand for lightweight and high-performance materials and increasing demand for fuel-efficient vehicles will lead to sizable demand in the market.
The report on the carbon fiber prepreg market covers the following areas:
- Carbon fiber prepreg market sizing
- Carbon fiber prepreg market forecast
- Carbon fiber prepreg market industry analysis
The robust vendor analysis is designed to help clients improve their market position, and in line with this, this report provides a detailed analysis of several leading carbon fiber prepreg market vendors that include Axiom Materials Inc., Arvind Composites, Celanese Corp., Dexcraft, DowAksa, Formosa M Co. Ltd., Gurit Holding AG, Hexcel Corp., K. Sakai and Co. Ltd., Kordsa Teknik Tekstil AS, Mitsubishi Chemical Corp., Nippon Steel Corp., OCSiAl, Plastic Reinforcement Fabrics Ltd., SGL Carbon SE, SK Chemicals Co. Ltd., Solvay SA, TCR Composites, Teijin Ltd., and Toray Composite Materials America Inc.. Also, the carbon fiber prepreg market analysis report includes information on upcoming trends and challenges that will influence market growth. This is to help companies strategize and leverage all forthcoming growth opportunities.
The study was conducted using an objective combination of primary and secondary information including inputs from key participants in the industry. The report contains a comprehensive market and vendor landscape in addition to an analysis of the key vendors.
The publisher presents a detailed picture of the market by the way of study, synthesis, and summation of data from multiple sources by an analysis of key parameters such as profit, pricing, competition, and promotions. It presents various market facets by identifying the key industry influencers. The data presented is comprehensive, reliable, and a result of extensive research - both primary and secondary. The market research reports provide a complete competitive landscape and an in-depth vendor selection methodology and analysis using qualitative and quantitative research to forecast the accurate market growth.
Table of Contents
1 Executive Summary
- 1.1 Market overview
- Executive Summary - Chart on Market Overview
- Executive Summary - Data Table on Market Overview
- Executive Summary - Chart on Global Market Characteristics
- Executive Summary - Chart on Market by Geography
- Executive Summary - Chart on Market Segmentation by Type
- Executive Summary - Chart on Market Segmentation by Application
- Executive Summary - Chart on Incremental Growth
- Executive Summary - Data Table on Incremental Growth
- Executive Summary - Chart on Company Market Positioning
2 Market Landscape
- 2.1 Market ecosystem
- Parent Market
- Data Table on - Parent Market
- 2.2 Market characteristics
- Market characteristics analysis
- 2.3 Value chain analysis
- Value Chain Analysis
3 Market Sizing
- 3.1 Market definition
- Offerings of companies included in the market definition
- 3.2 Market segment analysis
- Market segments
- 3.3 Market size 2023
- 3.4 Market outlook: Forecast for 2023-2028
- Chart on Global - Market size and forecast 2023-2028 ($ million)
- Data Table on Global - Market size and forecast 2023-2028 ($ million)
- Chart on Global Market: Year-over-year growth 2023-2028 (%)
- Data Table on Global Market: Year-over-year growth 2023-2028 (%)
4 Historic Market Size
- 4.1 Global Carbon Fiber Prepreg Market 2018 - 2022
- Historic Market Size - Data Table on Global Carbon Fiber Prepreg Market 2018 - 2022 ($ million)
- 4.2 Type segment analysis 2018 - 2022
- Historic Market Size - Type Segment 2018 - 2022 ($ million)
- 4.3 Application segment analysis 2018 - 2022
- Historic Market Size - Application Segment 2018 - 2022 ($ million)
- 4.4 Geography segment analysis 2018 - 2022
- Historic Market Size - Geography Segment 2018 - 2022 ($ million)
- 4.5 Country segment analysis 2018 - 2022
- Historic Market Size - Country Segment 2018 - 2022 ($ million)
5 Five Forces Analysis
- 5.1 Five forces summary
- Five forces analysis - Comparison between 2023 and 2028
- 5.2 Bargaining power of buyers
- Bargaining power of buyers - Impact of key factors 2023 and 2028
- 5.3 Bargaining power of suppliers
- Bargaining power of suppliers - Impact of key factors in 2023 and 2028
- 5.4 Threat of new entrants
- Threat of new entrants - Impact of key factors in 2023 and 2028
- 5.5 Threat of substitutes
- Threat of substitutes - Impact of key factors in 2023 and 2028
- 5.6 Threat of rivalry
- Threat of rivalry - Impact of key factors in 2023 and 2028
- 5.7 Market condition
- Chart on Market condition - Five forces 2023 and 2028
6 Market Segmentation by Type
- 6.1 Market segments
- Chart on Type - Market share 2023-2028 (%)
- Data Table on Type - Market share 2023-2028 (%)
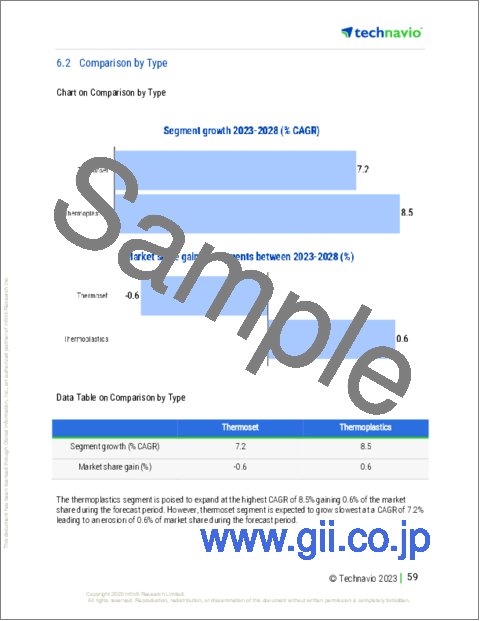
- 6.2 Comparison by Type
- Chart on Comparison by Type
- Data Table on Comparison by Type
- 6.3 Thermoset - Market size and forecast 2023-2028
- Chart on Thermoset - Market size and forecast 2023-2028 ($ million)
- Data Table on Thermoset - Market size and forecast 2023-2028 ($ million)
- Chart on Thermoset - Year-over-year growth 2023-2028 (%)
- Data Table on Thermoset - Year-over-year growth 2023-2028 (%)
- 6.4 Thermoplastics - Market size and forecast 2023-2028
- Chart on Thermoplastics - Market size and forecast 2023-2028 ($ million)
- Data Table on Thermoplastics - Market size and forecast 2023-2028 ($ million)
- Chart on Thermoplastics - Year-over-year growth 2023-2028 (%)
- Data Table on Thermoplastics - Year-over-year growth 2023-2028 (%)
- 6.5 Market opportunity by Type
- Market opportunity by Type ($ million)
- Data Table on Market opportunity by Type ($ million)
7 Market Segmentation by Application
- 7.1 Market segments
- Chart on Application - Market share 2023-2028 (%)
- Data Table on Application - Market share 2023-2028 (%)
- 7.2 Comparison by Application
- Chart on Comparison by Application
- Data Table on Comparison by Application
- 7.3 Aerospace and defense - Market size and forecast 2023-2028
- Chart on Aerospace and defense - Market size and forecast 2023-2028 ($ million)
- Data Table on Aerospace and defense - Market size and forecast 2023-2028 ($ million)
- Chart on Aerospace and defense - Year-over-year growth 2023-2028 (%)
- Data Table on Aerospace and defense - Year-over-year growth 2023-2028 (%)
- 7.4 Wind energy - Market size and forecast 2023-2028
- Chart on Wind energy - Market size and forecast 2023-2028 ($ million)
- Data Table on Wind energy - Market size and forecast 2023-2028 ($ million)
- Chart on Wind energy - Year-over-year growth 2023-2028 (%)
- Data Table on Wind energy - Year-over-year growth 2023-2028 (%)
- 7.5 Automotive parts - Market size and forecast 2023-2028
- Chart on Automotive parts - Market size and forecast 2023-2028 ($ million)
- Data Table on Automotive parts - Market size and forecast 2023-2028 ($ million)
- Chart on Automotive parts - Year-over-year growth 2023-2028 (%)
- Data Table on Automotive parts - Year-over-year growth 2023-2028 (%)
- 7.6 Sports equipment - Market size and forecast 2023-2028
- Chart on Sports equipment - Market size and forecast 2023-2028 ($ million)
- Data Table on Sports equipment - Market size and forecast 2023-2028 ($ million)
- Chart on Sports equipment - Year-over-year growth 2023-2028 (%)
- Data Table on Sports equipment - Year-over-year growth 2023-2028 (%)
- 7.7 Market opportunity by Application
- Market opportunity by Application ($ million)
- Data Table on Market opportunity by Application ($ million)
8 Customer Landscape
- 8.1 Customer landscape overview
- Analysis of price sensitivity, lifecycle, customer purchase basket, adoption rates, and purchase criteria
9 Geographic Landscape
- 9.1 Geographic segmentation
- Chart on Market share By Geographical Landscape2023-2028 (%)
- Data Table on Market share By Geographical Landscape2023-2028 (%)
- 9.2 Geographic comparison
- Chart on Geographic comparison
- Data Table on Geographic comparison
- 9.3 North America - Market size and forecast 2023-2028
- Chart on North America - Market size and forecast 2023-2028 ($ million)
- Data Table on North America - Market size and forecast 2023-2028 ($ million)
- Chart on North America - Year-over-year growth 2023-2028 (%)
- Data Table on North America - Year-over-year growth 2023-2028 (%)
- 9.4 APAC - Market size and forecast 2023-2028
- Chart on APAC - Market size and forecast 2023-2028 ($ million)
- Data Table on APAC - Market size and forecast 2023-2028 ($ million)
- Chart on APAC - Year-over-year growth 2023-2028 (%)
- Data Table on APAC - Year-over-year growth 2023-2028 (%)
- 9.5 Europe - Market size and forecast 2023-2028
- Chart on Europe - Market size and forecast 2023-2028 ($ million)
- Data Table on Europe - Market size and forecast 2023-2028 ($ million)
- Chart on Europe - Year-over-year growth 2023-2028 (%)
- Data Table on Europe - Year-over-year growth 2023-2028 (%)
- 9.6 South America - Market size and forecast 2023-2028
- Chart on South America - Market size and forecast 2023-2028 ($ million)
- Data Table on South America - Market size and forecast 2023-2028 ($ million)
- Chart on South America - Year-over-year growth 2023-2028 (%)
- Data Table on South America - Year-over-year growth 2023-2028 (%)
- 9.7 Middle East and Africa - Market size and forecast 2023-2028
- Chart on Middle East and Africa - Market size and forecast 2023-2028 ($ million)
- Data Table on Middle East and Africa - Market size and forecast 2023-2028 ($ million)
- Chart on Middle East and Africa - Year-over-year growth 2023-2028 (%)
- Data Table on Middle East and Africa - Year-over-year growth 2023-2028 (%)
- 9.8 US - Market size and forecast 2023-2028
- Chart on US - Market size and forecast 2023-2028 ($ million)
- Data Table on US - Market size and forecast 2023-2028 ($ million)
- Chart on US - Year-over-year growth 2023-2028 (%)
- Data Table on US - Year-over-year growth 2023-2028 (%)
- 9.9 China - Market size and forecast 2023-2028
- Chart on China - Market size and forecast 2023-2028 ($ million)
- Data Table on China - Market size and forecast 2023-2028 ($ million)
- Chart on China - Year-over-year growth 2023-2028 (%)
- Data Table on China - Year-over-year growth 2023-2028 (%)
- 9.10 Japan - Market size and forecast 2023-2028
- Chart on Japan - Market size and forecast 2023-2028 ($ million)
- Data Table on Japan - Market size and forecast 2023-2028 ($ million)
- Chart on Japan - Year-over-year growth 2023-2028 (%)
- Data Table on Japan - Year-over-year growth 2023-2028 (%)
- 9.11 Germany - Market size and forecast 2023-2028
- Chart on Germany - Market size and forecast 2023-2028 ($ million)
- Data Table on Germany - Market size and forecast 2023-2028 ($ million)
- Chart on Germany - Year-over-year growth 2023-2028 (%)
- Data Table on Germany - Year-over-year growth 2023-2028 (%)
- 9.12 UK - Market size and forecast 2023-2028
- Chart on UK - Market size and forecast 2023-2028 ($ million)
- Data Table on UK - Market size and forecast 2023-2028 ($ million)
- Chart on UK - Year-over-year growth 2023-2028 (%)
- Data Table on UK - Year-over-year growth 2023-2028 (%)
- 9.13 Market opportunity by geography
- Market opportunity By Geographical Landscape($ million)
- Data Tables on Market opportunity By Geographical Landscape($ million)
10 Drivers, Challenges, and Opportunity/Restraints
- 10.1 Market drivers
- 10.2 Market challenges
- 10.3 Impact of drivers and challenges
- Impact of drivers and challenges in 2023 and 2028
- 10.4 Market opportunities/restraints
11 Competitive Landscape
- 11.1 Overview
- 11.2 Competitive Landscape
- Overview on criticality of inputs and factors of differentiation
- 11.3 Landscape disruption
- Overview on factors of disruption
- 11.4 Industry risks
- Impact of key risks on business
12 Competitive Analysis
- 12.1 Companies profiled
- Companies covered
- 12.2 Market positioning of companies
- Matrix on companies position and classification
- 12.3 Axiom Materials Inc.
- Axiom Materials Inc. - Overview
- Axiom Materials Inc. - Product / Service
- Axiom Materials Inc. - Key offerings
- 12.4 Arvind Composites
- Arvind Composites - Overview
- Arvind Composites - Product / Service
- Arvind Composites - Key offerings
- 12.5 Celanese Corp.
- Celanese Corp. - Overview
- Celanese Corp. - Business segments
- Celanese Corp. - Key offerings
- Celanese Corp. - Segment focus
- 12.6 Formosa M Co. Ltd.
- Formosa M Co. Ltd. - Overview
- Formosa M Co. Ltd. - Product / Service
- Formosa M Co. Ltd. - Key offerings
- 12.7 Gurit Holding AG
- Gurit Holding AG - Overview
- Gurit Holding AG - Business segments
- Gurit Holding AG - Key offerings
- Gurit Holding AG - Segment focus
- 12.8 Hexcel Corp.
- Hexcel Corp. - Overview
- Hexcel Corp. - Business segments
- Hexcel Corp. - Key offerings
- Hexcel Corp. - Segment focus
- 12.9 Kordsa Teknik Tekstil AS
- Kordsa Teknik Tekstil AS - Overview
- Kordsa Teknik Tekstil AS - Business segments
- Kordsa Teknik Tekstil AS - Key offerings
- Kordsa Teknik Tekstil AS - Segment focus
- 12.10 Mitsubishi Chemical Corp.
- Mitsubishi Chemical Corp. - Overview
- Mitsubishi Chemical Corp. - Business segments
- Mitsubishi Chemical Corp. - Key offerings
- Mitsubishi Chemical Corp. - Segment focus
- 12.11 Nippon Steel Corp.
- Nippon Steel Corp. - Overview
- Nippon Steel Corp. - Business segments
- Nippon Steel Corp. - Key offerings
- Nippon Steel Corp. - Segment focus
- 12.12 OCSiAl
- OCSiAl - Overview
- OCSiAl - Product / Service
- OCSiAl - Key offerings
- 12.13 Plastic Reinforcement Fabrics Ltd.
- Plastic Reinforcement Fabrics Ltd. - Overview
- Plastic Reinforcement Fabrics Ltd. - Product / Service
- Plastic Reinforcement Fabrics Ltd. - Key offerings
- 12.14 SGL Carbon SE
- SGL Carbon SE - Overview
- SGL Carbon SE - Business segments
- SGL Carbon SE - Key offerings
- SGL Carbon SE - Segment focus
- 12.15 Solvay SA
- Solvay SA - Overview
- Solvay SA - Business segments
- Solvay SA - Key news
- Solvay SA - Key offerings
- Solvay SA - Segment focus
- 12.16 Teijin Ltd.
- Teijin Ltd. - Overview
- Teijin Ltd. - Business segments
- Teijin Ltd. - Key offerings
- Teijin Ltd. - Segment focus
- 12.17 Toray Composite Materials America Inc.
- Toray Composite Materials America Inc. - Overview
- Toray Composite Materials America Inc. - Product / Service
- Toray Composite Materials America Inc. - Key offerings
13 Appendix
- 13.1 Scope of the report
- 13.2 Inclusions and exclusions checklist
- Inclusions checklist
- Exclusions checklist
- 13.3 Currency conversion rates for US$
- Currency conversion rates for US$
- 13.4 Research methodology
- Research methodology
- 13.5 Data procurement
- Information sources
- 13.6 Data validation
- Data validation
- 13.7 Validation techniques employed for market sizing
- Validation techniques employed for market sizing
- 13.8 Data synthesis
- Data synthesis
- 13.9 360 degree market analysis
- 360 degree market analysis
- 13.10 List of abbreviations
- List of abbreviations

