|
|
市場調査レポート
商品コード
1525139
バイオガス改良装置の世界市場 2024-2028Global biogas upgrading equipment market 2024-2028 |
||||||

|
|||||||
カスタマイズ可能
|
|||||||


| バイオガス改良装置の世界市場 2024-2028 |
|
出版日: 2024年07月12日
発行: TechNavio
ページ情報: 英文 161 Pages
納期: 即納可能
|

全表示
- 概要
- 図表
- 目次
バイオガス改良装置市場は2023-2028年に74億3,480万米ドル、予測期間中のCAGRは18.52%で成長すると予測されます。
当レポートでは、バイオガス改良装置市場の全体的な分析、市場規模・予測、動向、成長促進要因、課題、約25のベンダーを網羅したベンダー分析などを掲載しています。
現在の市場シナリオ、最新動向と促進要因、市場環境全体に関する最新分析を提供しています。市場は、よりクリーンな燃料へのニーズ、有利な政府政策、環境とエネルギーの安全保障によって牽引されています。
| 市場範囲 | |
|---|---|
| 基準年 | 2024 |
| 終了年 | 2028 |
| 予測期間 | 2024-2028 |
| 成長モメンタム | 加速 |
| 前年比2024年 | 15.18% |
| CAGR | 18.52% |
| 増分額 | 74億3,480万米ドル |
本調査では、技術の進歩が今後数年間のバイオガス改良装置市場成長を牽引する主要因の1つであるとしています。また、天然ガス自動車の採用が増加し、運輸部門からの支援が拡大することで、市場の需要が大きくなります。
目次
第1章 エグゼクティブサマリー
- 市場概要
第2章 市場情勢
- 市場エコシステム
- 市場の特徴
- バリューチェーン分析
第3章 市場規模の評価
- 市場の定義
- 市場セグメント分析
- 市場規模 2023
- 市場の見通し 2023-2028
第4章 市場規模実績
- 世界バイオガス改良装置市場 2018-2022
- 技術別セグメント分析 2018-2022
- 地域別セグメント分析 2018-2022
- 国別セグメント分析 2018-2022
第5章 ファイブフォース分析
- ファイブフォースの要約
- 買い手の交渉力
- 供給企業の交渉力
- 新規参入業者の脅威
- 代替品の脅威
- 競争の脅威
- 市況
第6章 市場セグメンテーション:技術別
- 市場セグメンテーション
- 比較:技術別
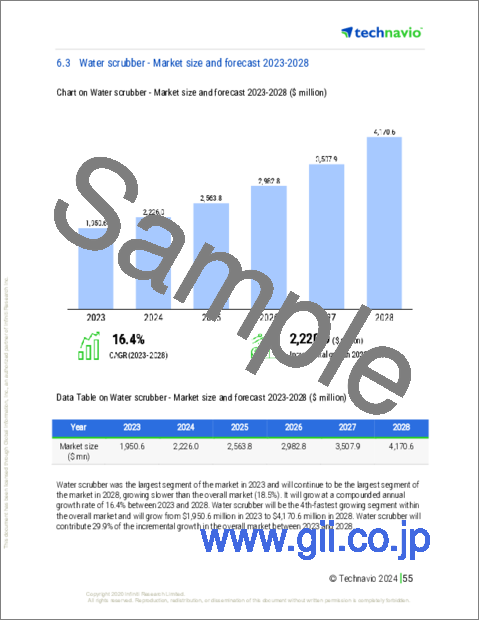
- ウォータースクラバー:市場規模と予測 2023-2028
- ケミカルスクラバー:市場規模と予測 2023-2028
- 圧力スイング吸着(PSA):市場規模と予測 2023-2028
- メンブレン:市場規模と予測 2023-2028
- その他:市場規模と予測 2023-2028
- 市場機会:技術別
第7章 顧客情勢
- 顧客情勢の概要
第8章 地域別情勢
- 地域別セグメンテーション
- 地域別比較
- 欧州:市場規模と予測 2023-2028
- 北米:市場規模と予測 2023-2028
- アジア太平洋:市場規模と予測 2023-2028
- 南米:市場規模と予測 2023-2028
- 中東・アフリカ:市場規模と予測 2023-2028
- 米国:市場規模と予測 2023-2028
- ドイツ:市場規模と予測 2023-2028
- 中国:市場規模と予測 2023-2028
- 英国:市場規模と予測 2023-2028
- イタリア:市場規模と予測 2023-2028
- 市場機会:地域情勢別
第9章 促進要因・課題・機会・抑制要因
- 市場促進要因
- 市場の課題
- 促進要因と課題の影響
- 市場の機会・抑制要因
第10章 競合情勢
- 概要
- 競合情勢
- 混乱の状況
- 業界のリスク
第11章 競合分析
- 企業プロファイル
- 企業の市場ポジショニング
- AAT Abwasser und Abfalltechnik GmbH
- Air Liquide SA
- Atlas Copco AB
- Carbotech Gas Systems GmbH
- DMT International
- DVO Inc.
- Greenlane Renewables Inc.
- HAASE Umwelttechnik GmbH
- Jog Waste to Energy Pvt. Ltd.
- MalmbergGruppen AB
- Nacelle Logistics LLC
- NeoZeo AB
- Pentair Plc
- Xebec Adsorption Inc.
第12章 付録
Exhibits:
- Exhibits1: Executive Summary - Chart on Market Overview
- Exhibits2: Executive Summary - Data Table on Market Overview
- Exhibits3: Executive Summary - Chart on Global Market Characteristics
- Exhibits4: Executive Summary - Chart on Market By Geographical Landscape
- Exhibits5: Executive Summary - Chart on Market Segmentation by Technology
- Exhibits6: Executive Summary - Chart on Incremental Growth
- Exhibits7: Executive Summary - Data Table on Incremental Growth
- Exhibits8: Executive Summary - Chart on Company Market Positioning
- Exhibits9: Parent Market
- Exhibits10: Data Table on - Parent Market
- Exhibits11: Market characteristics analysis
- Exhibits12: Value Chain Analysis
- Exhibits13: Offerings of companies included in the market definition
- Exhibits14: Market segments
- Exhibits15: Chart on Global - Market size and forecast 2023-2028 ($ million)
- Exhibits16: Data Table on Global - Market size and forecast 2023-2028 ($ million)
- Exhibits17: Chart on Global Market: Year-over-year growth 2023-2028 (%)
- Exhibits18: Data Table on Global Market: Year-over-year growth 2023-2028 (%)
- Exhibits19: Historic Market Size - Data Table on Global Biogas Upgrading Equipment Market 2018 - 2022 ($ million)
- Exhibits20: Historic Market Size - Technology Segment 2018 - 2022 ($ million)
- Exhibits21: Historic Market Size - Geography Segment 2018 - 2022 ($ million)
- Exhibits22: Historic Market Size - Country Segment 2018 - 2022 ($ million)
- Exhibits23: Five forces analysis - Comparison between 2023 and 2028
- Exhibits24: Bargaining power of buyers - Impact of key factors 2023 and 2028
- Exhibits25: Bargaining power of suppliers - Impact of key factors in 2023 and 2028
- Exhibits26: Threat of new entrants - Impact of key factors in 2023 and 2028
- Exhibits27: Threat of substitutes - Impact of key factors in 2023 and 2028
- Exhibits28: Threat of rivalry - Impact of key factors in 2023 and 2028
- Exhibits29: Chart on Market condition - Five forces 2023 and 2028
- Exhibits30: Chart on Technology - Market share 2023-2028 (%)
- Exhibits31: Data Table on Technology - Market share 2023-2028 (%)
- Exhibits32: Chart on Comparison by Technology
- Exhibits33: Data Table on Comparison by Technology
- Exhibits34: Chart on Water scrubber - Market size and forecast 2023-2028 ($ million)
- Exhibits35: Data Table on Water scrubber - Market size and forecast 2023-2028 ($ million)
- Exhibits36: Chart on Water scrubber - Year-over-year growth 2023-2028 (%)
- Exhibits37: Data Table on Water scrubber - Year-over-year growth 2023-2028 (%)
- Exhibits38: Chart on Chemical scrubber - Market size and forecast 2023-2028 ($ million)
- Exhibits39: Data Table on Chemical scrubber - Market size and forecast 2023-2028 ($ million)
- Exhibits40: Chart on Chemical scrubber - Year-over-year growth 2023-2028 (%)
- Exhibits41: Data Table on Chemical scrubber - Year-over-year growth 2023-2028 (%)
- Exhibits42: Chart on Pressure swing adsorption (PSA) - Market size and forecast 2023-2028 ($ million)
- Exhibits43: Data Table on Pressure swing adsorption (PSA) - Market size and forecast 2023-2028 ($ million)
- Exhibits44: Chart on Pressure swing adsorption (PSA) - Year-over-year growth 2023-2028 (%)
- Exhibits45: Data Table on Pressure swing adsorption (PSA) - Year-over-year growth 2023-2028 (%)
- Exhibits46: Chart on Membrane - Market size and forecast 2023-2028 ($ million)
- Exhibits47: Data Table on Membrane - Market size and forecast 2023-2028 ($ million)
- Exhibits48: Chart on Membrane - Year-over-year growth 2023-2028 (%)
- Exhibits49: Data Table on Membrane - Year-over-year growth 2023-2028 (%)
- Exhibits50: Chart on Others - Market size and forecast 2023-2028 ($ million)
- Exhibits51: Data Table on Others - Market size and forecast 2023-2028 ($ million)
- Exhibits52: Chart on Others - Year-over-year growth 2023-2028 (%)
- Exhibits53: Data Table on Others - Year-over-year growth 2023-2028 (%)
- Exhibits54: Market opportunity by Technology ($ million)
- Exhibits55: Data Table on Market opportunity by Technology ($ million)
- Exhibits56: Analysis of price sensitivity, lifecycle, customer purchase basket, adoption rates, and purchase criteria
- Exhibits57: Chart on Market share By Geographical Landscape 2023-2028 (%)
- Exhibits58: Data Table on Market share By Geographical Landscape 2023-2028 (%)
- Exhibits59: Chart on Geographic comparison
- Exhibits60: Data Table on Geographic comparison
- Exhibits61: Chart on Europe - Market size and forecast 2023-2028 ($ million)
- Exhibits62: Data Table on Europe - Market size and forecast 2023-2028 ($ million)
- Exhibits63: Chart on Europe - Year-over-year growth 2023-2028 (%)
- Exhibits64: Data Table on Europe - Year-over-year growth 2023-2028 (%)
- Exhibits65: Chart on North America - Market size and forecast 2023-2028 ($ million)
- Exhibits66: Data Table on North America - Market size and forecast 2023-2028 ($ million)
- Exhibits67: Chart on North America - Year-over-year growth 2023-2028 (%)
- Exhibits68: Data Table on North America - Year-over-year growth 2023-2028 (%)
- Exhibits69: Chart on APAC - Market size and forecast 2023-2028 ($ million)
- Exhibits70: Data Table on APAC - Market size and forecast 2023-2028 ($ million)
- Exhibits71: Chart on APAC - Year-over-year growth 2023-2028 (%)
- Exhibits72: Data Table on APAC - Year-over-year growth 2023-2028 (%)
- Exhibits73: Chart on South America - Market size and forecast 2023-2028 ($ million)
- Exhibits74: Data Table on South America - Market size and forecast 2023-2028 ($ million)
- Exhibits75: Chart on South America - Year-over-year growth 2023-2028 (%)
- Exhibits76: Data Table on South America - Year-over-year growth 2023-2028 (%)
- Exhibits77: Chart on Middle East and Africa - Market size and forecast 2023-2028 ($ million)
- Exhibits78: Data Table on Middle East and Africa - Market size and forecast 2023-2028 ($ million)
- Exhibits79: Chart on Middle East and Africa - Year-over-year growth 2023-2028 (%)
- Exhibits80: Data Table on Middle East and Africa - Year-over-year growth 2023-2028 (%)
- Exhibits81: Chart on US - Market size and forecast 2023-2028 ($ million)
- Exhibits82: Data Table on US - Market size and forecast 2023-2028 ($ million)
- Exhibits83: Chart on US - Year-over-year growth 2023-2028 (%)
- Exhibits84: Data Table on US - Year-over-year growth 2023-2028 (%)
- Exhibits85: Chart on Germany - Market size and forecast 2023-2028 ($ million)
- Exhibits86: Data Table on Germany - Market size and forecast 2023-2028 ($ million)
- Exhibits87: Chart on Germany - Year-over-year growth 2023-2028 (%)
- Exhibits88: Data Table on Germany - Year-over-year growth 2023-2028 (%)
- Exhibits89: Chart on China - Market size and forecast 2023-2028 ($ million)
- Exhibits90: Data Table on China - Market size and forecast 2023-2028 ($ million)
- Exhibits91: Chart on China - Year-over-year growth 2023-2028 (%)
- Exhibits92: Data Table on China - Year-over-year growth 2023-2028 (%)
- Exhibits93: Chart on UK - Market size and forecast 2023-2028 ($ million)
- Exhibits94: Data Table on UK - Market size and forecast 2023-2028 ($ million)
- Exhibits95: Chart on UK - Year-over-year growth 2023-2028 (%)
- Exhibits96: Data Table on UK - Year-over-year growth 2023-2028 (%)
- Exhibits97: Chart on Italy - Market size and forecast 2023-2028 ($ million)
- Exhibits98: Data Table on Italy - Market size and forecast 2023-2028 ($ million)
- Exhibits99: Chart on Italy - Year-over-year growth 2023-2028 (%)
- Exhibits100: Data Table on Italy - Year-over-year growth 2023-2028 (%)
- Exhibits101: Market opportunity By Geographical Landscape ($ million)
- Exhibits102: Data Tables on Market opportunity By Geographical Landscape ($ million)
- Exhibits103: Impact of drivers and challenges in 2023 and 2028
- Exhibits104: Overview on criticality of inputs and factors of differentiation
- Exhibits105: Overview on factors of disruption
- Exhibits106: Impact of key risks on business
- Exhibits107: Companies covered
- Exhibits108: Matrix on companies position and classification
- Exhibits109: 2G Energy AG - Overview
- Exhibits110: 2G Energy AG - Product / Service
- Exhibits111: 2G Energy AG - Key offerings
- Exhibits112: AAT Abwasser und Abfalltechnik GmbH - Overview
- Exhibits113: AAT Abwasser und Abfalltechnik GmbH - Product / Service
- Exhibits114: AAT Abwasser und Abfalltechnik GmbH - Key offerings
- Exhibits115: Air Liquide SA - Overview
- Exhibits116: Air Liquide SA - Business segments
- Exhibits117: Air Liquide SA - Key news
- Exhibits118: Air Liquide SA - Key offerings
- Exhibits119: Air Liquide SA - Segment focus
- Exhibits120: Atlas Copco AB - Overview
- Exhibits121: Atlas Copco AB - Business segments
- Exhibits122: Atlas Copco AB - Key news
- Exhibits123: Atlas Copco AB - Key offerings
- Exhibits124: Atlas Copco AB - Segment focus
- Exhibits125: Carbotech Gas Systems GmbH - Overview
- Exhibits126: Carbotech Gas Systems GmbH - Product / Service
- Exhibits127: Carbotech Gas Systems GmbH - Key offerings
- Exhibits128: DMT International - Overview
- Exhibits129: DMT International - Product / Service
- Exhibits130: DMT International - Key offerings
- Exhibits131: DVO Inc. - Overview
- Exhibits132: DVO Inc. - Product / Service
- Exhibits133: DVO Inc. - Key offerings
- Exhibits134: Greenlane Renewables Inc. - Overview
- Exhibits135: Greenlane Renewables Inc. - Product / Service
- Exhibits136: Greenlane Renewables Inc. - Key offerings
- Exhibits137: HAASE Umwelttechnik GmbH - Overview
- Exhibits138: HAASE Umwelttechnik GmbH - Product / Service
- Exhibits139: HAASE Umwelttechnik GmbH - Key offerings
- Exhibits140: Jog Waste to Energy Pvt. Ltd. - Overview
- Exhibits141: Jog Waste to Energy Pvt. Ltd. - Product / Service
- Exhibits142: Jog Waste to Energy Pvt. Ltd. - Key offerings
- Exhibits143: MalmbergGruppen AB - Overview
- Exhibits144: MalmbergGruppen AB - Product / Service
- Exhibits145: MalmbergGruppen AB - Key offerings
- Exhibits146: Nacelle Logistics LLC - Overview
- Exhibits147: Nacelle Logistics LLC - Product / Service
- Exhibits148: Nacelle Logistics LLC - Key offerings
- Exhibits149: NeoZeo AB - Overview
- Exhibits150: NeoZeo AB - Product / Service
- Exhibits151: NeoZeo AB - Key offerings
- Exhibits152: Pentair Plc - Overview
- Exhibits153: Pentair Plc - Business segments
- Exhibits154: Pentair Plc - Key news
- Exhibits155: Pentair Plc - Key offerings
- Exhibits156: Pentair Plc - Segment focus
- Exhibits157: Xebec Adsorption Inc. - Overview
- Exhibits158: Xebec Adsorption Inc. - Product / Service
- Exhibits159: Xebec Adsorption Inc. - Key offerings
- Exhibits160: Inclusions checklist
- Exhibits161: Exclusions checklist
- Exhibits162: Currency conversion rates for US$
- Exhibits163: Research methodology
- Exhibits164: Information sources
- Exhibits165: Data validation
- Exhibits166: Validation techniques employed for market sizing
- Exhibits167: Data synthesis
- Exhibits168: 360 degree market analysis
- Exhibits169: List of abbreviations
The biogas upgrading equipment market is forecasted to grow by USD 7434.8 mn during 2023-2028, accelerating at a CAGR of 18.52% during the forecast period. The report on the biogas upgrading equipment market provides a holistic analysis, market size and forecast, trends, growth drivers, and challenges, as well as vendor analysis covering around 25 vendors.
The report offers an up-to-date analysis regarding the current market scenario, the latest trends and drivers, and the overall market environment. The market is driven by need for cleaner fuel, favourable government policies, and environment and energy security.
Technavio's biogas upgrading equipment market is segmented as below:
| Market Scope | |
|---|---|
| Base Year | 2024 |
| End Year | 2028 |
| Series Year | 2024-2028 |
| Growth Momentum | Accelerate |
| YOY 2024 | 15.18% |
| CAGR | 18.52% |
| Incremental Value | $7434.8mn |
By Technology
- Water scrubber
- Chemical scrubber
- Pressure swing adsorption (PSA)
- Membrane
- Others
By Geographical Landscape
- Europe
- North America
- APAC
- South America
- Middle East and Africa
This study identifies the technological advancements as one of the prime reasons driving the biogas upgrading equipment market growth during the next few years. Also, increase in adoption of natural gas vehicles and growing support from transportation sector will lead to sizable demand in the market.
The report on the biogas upgrading equipment market covers the following areas:
- Biogas upgrading equipment market sizing
- Biogas upgrading equipment market forecast
- Biogas upgrading equipment market industry analysis
The robust vendor analysis is designed to help clients improve their market position, and in line with this, this report provides a detailed analysis of several leading biogas upgrading equipment market vendors that include 2G Energy AG, AAT Abwasser und Abfalltechnik GmbH, Air Liquide SA, Atlas Copco AB, Bright Renewables B.V., Carbotech Gas Systems GmbH, Condorchem Envitech SL, DMT International, DP CleanTech Co. Ltd., DVO Inc., Greenlane Renewables Inc., HAASE Umwelttechnik GmbH, Jog Waste to Energy Pvt. Ltd., MalmbergGruppen AB, Nacelle Logistics LLC, NeoZeo AB, Pentair PLC, Veolia Environnement SA, and Xebec Adsorption Inc.. Also, the biogas upgrading equipment market analysis report includes information on upcoming trends and challenges that will influence market growth. This is to help companies strategize and leverage all forthcoming growth opportunities.
The study was conducted using an objective combination of primary and secondary information including inputs from key participants in the industry. The report contains a comprehensive market and vendor landscape in addition to an analysis of the key vendors.
The publisher presents a detailed picture of the market by the way of study, synthesis, and summation of data from multiple sources by an analysis of key parameters such as profit, pricing, competition, and promotions. It presents various market facets by identifying the key industry influencers. The data presented is comprehensive, reliable, and a result of extensive research - both primary and secondary. The market research reports provide a complete competitive landscape and an in-depth vendor selection methodology and analysis using qualitative and quantitative research to forecast the accurate market growth.
Table of Contents
1 Executive Summary
- 1.1 Market overview
- Executive Summary - Chart on Market Overview
- Executive Summary - Data Table on Market Overview
- Executive Summary - Chart on Global Market Characteristics
- Executive Summary - Chart on Market By Geographical Landscape
- Executive Summary - Chart on Market Segmentation by Technology
- Executive Summary - Chart on Incremental Growth
- Executive Summary - Data Table on Incremental Growth
- Executive Summary - Chart on Company Market Positioning
2 Market Landscape
- 2.1 Market ecosystem
- Parent Market
- Data Table on - Parent Market
- 2.2 Market characteristics
- Market characteristics analysis
- 2.3 Value chain analysis
- Value Chain Analysis
3 Market Sizing
- 3.1 Market definition
- Offerings of companies included in the market definition
- 3.2 Market segment analysis
- Market segments
- 3.3 Market size 2023
- 3.4 Market outlook: Forecast for 2023-2028
- Chart on Global - Market size and forecast 2023-2028 ($ million)
- Data Table on Global - Market size and forecast 2023-2028 ($ million)
- Chart on Global Market: Year-over-year growth 2023-2028 (%)
- Data Table on Global Market: Year-over-year growth 2023-2028 (%)
4 Historic Market Size
- 4.1 Global Biogas Upgrading Equipment Market 2018 - 2022
- Historic Market Size - Data Table on Global Biogas Upgrading Equipment Market 2018 - 2022 ($ million)
- 4.2 Technology segment analysis 2018 - 2022
- Historic Market Size - Technology Segment 2018 - 2022 ($ million)
- 4.3 Geography segment analysis 2018 - 2022
- Historic Market Size - Geography Segment 2018 - 2022 ($ million)
- 4.4 Country segment analysis 2018 - 2022
- Historic Market Size - Country Segment 2018 - 2022 ($ million)
5 Five Forces Analysis
- 5.1 Five forces summary
- Five forces analysis - Comparison between 2023 and 2028
- 5.2 Bargaining power of buyers
- Bargaining power of buyers - Impact of key factors 2023 and 2028
- 5.3 Bargaining power of suppliers
- Bargaining power of suppliers - Impact of key factors in 2023 and 2028
- 5.4 Threat of new entrants
- Threat of new entrants - Impact of key factors in 2023 and 2028
- 5.5 Threat of substitutes
- Threat of substitutes - Impact of key factors in 2023 and 2028
- 5.6 Threat of rivalry
- Threat of rivalry - Impact of key factors in 2023 and 2028
- 5.7 Market condition
- Chart on Market condition - Five forces 2023 and 2028
6 Market Segmentation by Technology
- 6.1 Market segments
- Chart on Technology - Market share 2023-2028 (%)
- Data Table on Technology - Market share 2023-2028 (%)
- 6.2 Comparison by Technology
- Chart on Comparison by Technology
- Data Table on Comparison by Technology
- 6.3 Water scrubber - Market size and forecast 2023-2028
- Chart on Water scrubber - Market size and forecast 2023-2028 ($ million)
- Data Table on Water scrubber - Market size and forecast 2023-2028 ($ million)
- Chart on Water scrubber - Year-over-year growth 2023-2028 (%)
- Data Table on Water scrubber - Year-over-year growth 2023-2028 (%)
- 6.4 Chemical scrubber - Market size and forecast 2023-2028
- Chart on Chemical scrubber - Market size and forecast 2023-2028 ($ million)
- Data Table on Chemical scrubber - Market size and forecast 2023-2028 ($ million)
- Chart on Chemical scrubber - Year-over-year growth 2023-2028 (%)
- Data Table on Chemical scrubber - Year-over-year growth 2023-2028 (%)
- 6.5 Pressure swing adsorption (PSA) - Market size and forecast 2023-2028
- Chart on Pressure swing adsorption (PSA) - Market size and forecast 2023-2028 ($ million)
- Data Table on Pressure swing adsorption (PSA) - Market size and forecast 2023-2028 ($ million)
- Chart on Pressure swing adsorption (PSA) - Year-over-year growth 2023-2028 (%)
- Data Table on Pressure swing adsorption (PSA) - Year-over-year growth 2023-2028 (%)
- 6.6 Membrane - Market size and forecast 2023-2028
- Chart on Membrane - Market size and forecast 2023-2028 ($ million)
- Data Table on Membrane - Market size and forecast 2023-2028 ($ million)
- Chart on Membrane - Year-over-year growth 2023-2028 (%)
- Data Table on Membrane - Year-over-year growth 2023-2028 (%)
- 6.7 Others - Market size and forecast 2023-2028
- Chart on Others - Market size and forecast 2023-2028 ($ million)
- Data Table on Others - Market size and forecast 2023-2028 ($ million)
- Chart on Others - Year-over-year growth 2023-2028 (%)
- Data Table on Others - Year-over-year growth 2023-2028 (%)
- 6.8 Market opportunity by Technology
- Market opportunity by Technology ($ million)
- Data Table on Market opportunity by Technology ($ million)
7 Customer Landscape
- 7.1 Customer landscape overview
- Analysis of price sensitivity, lifecycle, customer purchase basket, adoption rates, and purchase criteria
8 Geographic Landscape
- 8.1 Geographic segmentation
- Chart on Market share By Geographical Landscape 2023-2028 (%)
- Data Table on Market share By Geographical Landscape 2023-2028 (%)
- 8.2 Geographic comparison
- Chart on Geographic comparison
- Data Table on Geographic comparison
- 8.3 Europe - Market size and forecast 2023-2028
- Chart on Europe - Market size and forecast 2023-2028 ($ million)
- Data Table on Europe - Market size and forecast 2023-2028 ($ million)
- Chart on Europe - Year-over-year growth 2023-2028 (%)
- Data Table on Europe - Year-over-year growth 2023-2028 (%)
- 8.4 North America - Market size and forecast 2023-2028
- Chart on North America - Market size and forecast 2023-2028 ($ million)
- Data Table on North America - Market size and forecast 2023-2028 ($ million)
- Chart on North America - Year-over-year growth 2023-2028 (%)
- Data Table on North America - Year-over-year growth 2023-2028 (%)
- 8.5 APAC - Market size and forecast 2023-2028
- Chart on APAC - Market size and forecast 2023-2028 ($ million)
- Data Table on APAC - Market size and forecast 2023-2028 ($ million)
- Chart on APAC - Year-over-year growth 2023-2028 (%)
- Data Table on APAC - Year-over-year growth 2023-2028 (%)
- 8.6 South America - Market size and forecast 2023-2028
- Chart on South America - Market size and forecast 2023-2028 ($ million)
- Data Table on South America - Market size and forecast 2023-2028 ($ million)
- Chart on South America - Year-over-year growth 2023-2028 (%)
- Data Table on South America - Year-over-year growth 2023-2028 (%)
- 8.7 Middle East and Africa - Market size and forecast 2023-2028
- Chart on Middle East and Africa - Market size and forecast 2023-2028 ($ million)
- Data Table on Middle East and Africa - Market size and forecast 2023-2028 ($ million)
- Chart on Middle East and Africa - Year-over-year growth 2023-2028 (%)
- Data Table on Middle East and Africa - Year-over-year growth 2023-2028 (%)
- 8.8 US - Market size and forecast 2023-2028
- Chart on US - Market size and forecast 2023-2028 ($ million)
- Data Table on US - Market size and forecast 2023-2028 ($ million)
- Chart on US - Year-over-year growth 2023-2028 (%)
- Data Table on US - Year-over-year growth 2023-2028 (%)
- 8.9 Germany - Market size and forecast 2023-2028
- Chart on Germany - Market size and forecast 2023-2028 ($ million)
- Data Table on Germany - Market size and forecast 2023-2028 ($ million)
- Chart on Germany - Year-over-year growth 2023-2028 (%)
- Data Table on Germany - Year-over-year growth 2023-2028 (%)
- 8.10 China - Market size and forecast 2023-2028
- Chart on China - Market size and forecast 2023-2028 ($ million)
- Data Table on China - Market size and forecast 2023-2028 ($ million)
- Chart on China - Year-over-year growth 2023-2028 (%)
- Data Table on China - Year-over-year growth 2023-2028 (%)
- 8.11 UK - Market size and forecast 2023-2028
- Chart on UK - Market size and forecast 2023-2028 ($ million)
- Data Table on UK - Market size and forecast 2023-2028 ($ million)
- Chart on UK - Year-over-year growth 2023-2028 (%)
- Data Table on UK - Year-over-year growth 2023-2028 (%)
- 8.12 Italy - Market size and forecast 2023-2028
- Chart on Italy - Market size and forecast 2023-2028 ($ million)
- Data Table on Italy - Market size and forecast 2023-2028 ($ million)
- Chart on Italy - Year-over-year growth 2023-2028 (%)
- Data Table on Italy - Year-over-year growth 2023-2028 (%)
- 8.13 Market opportunity By Geographical Landscape
- Market opportunity By Geographical Landscape ($ million)
- Data Tables on Market opportunity By Geographical Landscape ($ million)
9 Drivers, Challenges, and Opportunity/Restraints
- 9.1 Market drivers
- 9.2 Market challenges
- 9.3 Impact of drivers and challenges
- Impact of drivers and challenges in 2023 and 2028
- 9.4 Market opportunities/restraints
10 Competitive Landscape
- 10.1 Overview
- 10.2 Competitive Landscape
- Overview on criticality of inputs and factors of differentiation
- 10.3 Landscape disruption
- Overview on factors of disruption
- 10.4 Industry risks
- Impact of key risks on business
11 Competitive Analysis
- 11.1 Companies profiled
- Companies covered
- 11.2 Market positioning of companies
- Matrix on companies position and classification
- 2G Energy AG
- 2G Energy AG - Overview
- 2G Energy AG - Product / Service
- 2G Energy AG - Key offerings
- 11.4 AAT Abwasser und Abfalltechnik GmbH
- AAT Abwasser und Abfalltechnik GmbH - Overview
- AAT Abwasser und Abfalltechnik GmbH - Product / Service
- AAT Abwasser und Abfalltechnik GmbH - Key offerings
- 11.5 Air Liquide SA
- Air Liquide SA - Overview
- Air Liquide SA - Business segments
- Air Liquide SA - Key news
- Air Liquide SA - Key offerings
- Air Liquide SA - Segment focus
- 11.6 Atlas Copco AB
- Atlas Copco AB - Overview
- Atlas Copco AB - Business segments
- Atlas Copco AB - Key news
- Atlas Copco AB - Key offerings
- Atlas Copco AB - Segment focus
- 11.7 Carbotech Gas Systems GmbH
- Carbotech Gas Systems GmbH - Overview
- Carbotech Gas Systems GmbH - Product / Service
- Carbotech Gas Systems GmbH - Key offerings
- 11.8 DMT International
- DMT International - Overview
- DMT International - Product / Service
- DMT International - Key offerings
- 11.9 DVO Inc.
- DVO Inc. - Overview
- DVO Inc. - Product / Service
- DVO Inc. - Key offerings
- 11.10 Greenlane Renewables Inc.
- Greenlane Renewables Inc. - Overview
- Greenlane Renewables Inc. - Product / Service
- Greenlane Renewables Inc. - Key offerings
- 11.11 HAASE Umwelttechnik GmbH
- HAASE Umwelttechnik GmbH - Overview
- HAASE Umwelttechnik GmbH - Product / Service
- HAASE Umwelttechnik GmbH - Key offerings
- 11.12 Jog Waste to Energy Pvt. Ltd.
- Jog Waste to Energy Pvt. Ltd. - Overview
- Jog Waste to Energy Pvt. Ltd. - Product / Service
- Jog Waste to Energy Pvt. Ltd. - Key offerings
- 11.13 MalmbergGruppen AB
- MalmbergGruppen AB - Overview
- MalmbergGruppen AB - Product / Service
- MalmbergGruppen AB - Key offerings
- 11.14 Nacelle Logistics LLC
- Nacelle Logistics LLC - Overview
- Nacelle Logistics LLC - Product / Service
- Nacelle Logistics LLC - Key offerings
- 11.15 NeoZeo AB
- NeoZeo AB - Overview
- NeoZeo AB - Product / Service
- NeoZeo AB - Key offerings
- 11.16 Pentair Plc
- Pentair Plc - Overview
- Pentair Plc - Business segments
- Pentair Plc - Key news
- Pentair Plc - Key offerings
- Pentair Plc - Segment focus
- 11.17 Xebec Adsorption Inc.
- Xebec Adsorption Inc. - Overview
- Xebec Adsorption Inc. - Product / Service
- Xebec Adsorption Inc. - Key offerings
12 Appendix
- 12.1 Scope of the report
- 12.2 Inclusions and exclusions checklist
- Inclusions checklist
- Exclusions checklist
- 12.3 Currency conversion rates for US$
- Currency conversion rates for US$
- 12.4 Research methodology
- Research methodology
- 12.5 Data procurement
- Information sources
- 12.6 Data validation
- Data validation
- 12.7 Validation techniques employed for market sizing
- Validation techniques employed for market sizing
- 12.8 Data synthesis
- Data synthesis
- 12.9 360 degree market analysis
- 360 degree market analysis
- 12.10 List of abbreviations
- List of abbreviations

