|
|
市場調査レポート
商品コード
1502008
自動車用アンテナモジュールの世界市場 2024-2028Global automotive antenna module market 2024-2028 |
||||||
|
|||||||
カスタマイズ可能
|
|||||||

| 自動車用アンテナモジュールの世界市場 2024-2028 |
|
出版日: 2024年05月17日
発行: TechNavio
ページ情報: 英文 172 Pages
納期: 即納可能
|

全表示
- 概要
- 図表
- 目次
自動車用アンテナモジュール市場は2023-2028年に11億7,110万米ドル、予測期間中のCAGRは10.13%で成長すると予測されます。
当レポートでは、自動車用アンテナモジュール市場の全体的な分析、市場規模・予測、動向、成長促進要因、課題、約25のベンダーを網羅したベンダー分析などを掲載しています。
現在の市場シナリオ、最新動向と促進要因、市場環境全体に関する最新分析を提供しています。市場は、自動車におけるコネクティビティ技術の増加、自律走行車への注目の高まり、ecallのような安全装備を義務付ける規制の変更によって牽引されています。
| 市場範囲 | |
|---|---|
| 基準年 | 2024 |
| 終了年 | 2028 |
| 予測期間 | 2024-2028 |
| 成長モメンタム | 加速 |
| 前年比2024年 | 8.96% |
| CAGR | 10.13% |
| 増分額 | 11億7,110万米ドル |
本調査では、今後数年間の自動車用アンテナモジュール市場成長を牽引する主要因の1つとして、セルラーV2X技術の普及拡大を挙げています。また、電子的に制御するソフトウエア定義アンテナの開発とフラットパネルアンテナ技術の開発は、市場の大きな需要につながります。
目次
第1章 エグゼクティブサマリー
- 市場概要
第2章 市場情勢
- 市場エコシステム
- 市場の特徴
- バリューチェーン分析
第3章 市場規模の評価
- 市場の定義
- 市場セグメント分析
- 市場規模 2023
- 市場の見通し 2023-2028
第4章 市場規模実績
- 世界の自動車用アンテナモジュール市場 2018-2022
- 周波数範囲別セグメント分析 2018-2022
- 車両タイプ別セグメント分析 2018-2022
- 地域別セグメント分析 2018-2022
- 国別セグメント分析 2018-2022
第5章 ファイブフォース分析
- ファイブフォースの要約
- 買い手の交渉力
- 供給企業の交渉力
- 新規参入業者の脅威
- 代替品の脅威
- 競争の脅威
- 市況
第6章 市場セグメンテーション:周波数範囲別
- 市場セグメンテーション
- 比較周波数範囲別
- ハイレンジ:市場規模と予測 2023-2028
- ミディアムレンジ:市場規模と予測 2023-2028
- ローレンジ:市場規模と予測 2023-2028
- 市場機会:周波数範囲別
第7章 市場セグメンテーション:車両タイプ別
- 市場セグメンテーション
- 比較:車両タイプ別
- 乗用車:市場規模と予測 2023-2028
- 商用車:市場規模と予測 2023-2028
- 市場機会:車両タイプ別
第8章 顧客情勢
- 顧客情勢の概要
第9章 地域別情勢
- 地域別セグメンテーション
- 地域別比較
- 北米:市場規模と予測 2023-2028
- 欧州:市場規模と予測 2023-2028
- アジア太平洋:市場規模と予測 2023-2028
- 南米:市場規模と予測 2023-2028
- 中東・アフリカ:市場規模と予測 2023-2028
- 米国:市場規模と予測 2023-2028
- ドイツ:市場規模と予測 2023-2028
- 中国:市場規模と予測 2023-2028
- フランス:市場規模と予測 2023-2028
- 日本:市場規模と予測 2023-2028
- 市場機会:地域別
第10章 促進要因・課題・機会・抑制要因
- 市場促進要因
- 市場の課題
- 促進要因と課題の影響
- 市場の機会・抑制要因
第11章 競合情勢
- 概要
- 競合情勢
- 混乱の状況
- 業界のリスク
第12章 競合分析
- 企業プロファイル
- 企業の市場ポジショニング
- Amphenol Corp.
- ANTONICS ICP GmbH
- Continental AG
- FIAMM Componenti Accessori FCA Spa
- Guangdong Shenglu Telecommunication Tech Co. Ltd.
- Harada Industry Co. Ltd.
- Kymeta Corp.
- Laird Group
- Lorom Industrial Co Ltd
- MP Antenna Ltd.
- Schaffner Group
- Taoglas Group Holdings Ltd.
- TE Connectivity Ltd.
- Telefonaktiebolaget LM Ericsson
- Texas Instruments Inc.
第13章 付録
Exhibits:
- Exhibits1: Executive Summary - Chart on Market Overview
- Exhibits2: Executive Summary - Data Table on Market Overview
- Exhibits3: Executive Summary - Chart on Global Market Characteristics
- Exhibits4: Executive Summary - Chart on Market by Geography
- Exhibits5: Executive Summary - Chart on Market Segmentation by Frequency Range
- Exhibits6: Executive Summary - Chart on Market Segmentation by Vehicle Type
- Exhibits7: Executive Summary - Chart on Incremental Growth
- Exhibits8: Executive Summary - Data Table on Incremental Growth
- Exhibits9: Executive Summary - Chart on Company Market Positioning
- Exhibits10: Parent Market
- Exhibits11: Data Table on - Parent Market
- Exhibits12: Market characteristics analysis
- Exhibits13: Value Chain Analysis
- Exhibits14: Offerings of companies included in the market definition
- Exhibits15: Market segments
- Exhibits16: Chart on Global - Market size and forecast 2023-2028 ($ million)
- Exhibits17: Data Table on Global - Market size and forecast 2023-2028 ($ million)
- Exhibits18: Chart on Global Market: Year-over-year growth 2023-2028 (%)
- Exhibits19: Data Table on Global Market: Year-over-year growth 2023-2028 (%)
- Exhibits20: Historic Market Size - Data Table on Global Automotive Antenna Module Market 2018 - 2022 ($ million)
- Exhibits21: Historic Market Size - Frequency Range Segment 2018 - 2022 ($ million)
- Exhibits22: Historic Market Size - Vehicle Type Segment 2018 - 2022 ($ million)
- Exhibits23: Historic Market Size - Geography Segment 2018 - 2022 ($ million)
- Exhibits24: Historic Market Size - Country Segment 2018 - 2022 ($ million)
- Exhibits25: Five forces analysis - Comparison between 2023 and 2028
- Exhibits26: Bargaining power of buyers - Impact of key factors 2023 and 2028
- Exhibits27: Bargaining power of suppliers - Impact of key factors in 2023 and 2028
- Exhibits28: Threat of new entrants - Impact of key factors in 2023 and 2028
- Exhibits29: Threat of substitutes - Impact of key factors in 2023 and 2028
- Exhibits30: Threat of rivalry - Impact of key factors in 2023 and 2028
- Exhibits31: Chart on Market condition - Five forces 2023 and 2028
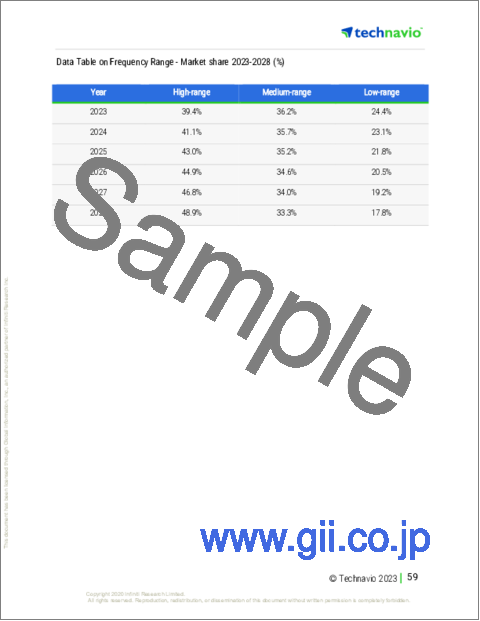
- Exhibits32: Chart on Frequency Range - Market share 2023-2028 (%)
- Exhibits33: Data Table on Frequency Range - Market share 2023-2028 (%)
- Exhibits34: Chart on Comparison by Frequency Range
- Exhibits35: Data Table on Comparison by Frequency Range
- Exhibits36: Chart on High-range - Market size and forecast 2023-2028 ($ million)
- Exhibits37: Data Table on High-range - Market size and forecast 2023-2028 ($ million)
- Exhibits38: Chart on High-range - Year-over-year growth 2023-2028 (%)
- Exhibits39: Data Table on High-range - Year-over-year growth 2023-2028 (%)
- Exhibits40: Chart on Medium-range - Market size and forecast 2023-2028 ($ million)
- Exhibits41: Data Table on Medium-range - Market size and forecast 2023-2028 ($ million)
- Exhibits42: Chart on Medium-range - Year-over-year growth 2023-2028 (%)
- Exhibits43: Data Table on Medium-range - Year-over-year growth 2023-2028 (%)
- Exhibits44: Chart on Low-range - Market size and forecast 2023-2028 ($ million)
- Exhibits45: Data Table on Low-range - Market size and forecast 2023-2028 ($ million)
- Exhibits46: Chart on Low-range - Year-over-year growth 2023-2028 (%)
- Exhibits47: Data Table on Low-range - Year-over-year growth 2023-2028 (%)
- Exhibits48: Market opportunity by Frequency Range ($ million)
- Exhibits49: Data Table on Market opportunity by Frequency Range ($ million)
- Exhibits50: Chart on Vehicle Type - Market share 2023-2028 (%)
- Exhibits51: Data Table on Vehicle Type - Market share 2023-2028 (%)
- Exhibits52: Chart on Comparison by Vehicle Type
- Exhibits53: Data Table on Comparison by Vehicle Type
- Exhibits54: Chart on Passenger cars - Market size and forecast 2023-2028 ($ million)
- Exhibits55: Data Table on Passenger cars - Market size and forecast 2023-2028 ($ million)
- Exhibits56: Chart on Passenger cars - Year-over-year growth 2023-2028 (%)
- Exhibits57: Data Table on Passenger cars - Year-over-year growth 2023-2028 (%)
- Exhibits58: Chart on Commercial vehicles - Market size and forecast 2023-2028 ($ million)
- Exhibits59: Data Table on Commercial vehicles - Market size and forecast 2023-2028 ($ million)
- Exhibits60: Chart on Commercial vehicles - Year-over-year growth 2023-2028 (%)
- Exhibits61: Data Table on Commercial vehicles - Year-over-year growth 2023-2028 (%)
- Exhibits62: Market opportunity by Vehicle Type ($ million)
- Exhibits63: Data Table on Market opportunity by Vehicle Type ($ million)
- Exhibits64: Analysis of price sensitivity, lifecycle, customer purchase basket, adoption rates, and purchase criteria
- Exhibits65: Chart on Market share By Geographical Landscape2023-2028 (%)
- Exhibits66: Data Table on Market share By Geographical Landscape2023-2028 (%)
- Exhibits67: Chart on Geographic comparison
- Exhibits68: Data Table on Geographic comparison
- Exhibits69: Chart on North America - Market size and forecast 2023-2028 ($ million)
- Exhibits70: Data Table on North America - Market size and forecast 2023-2028 ($ million)
- Exhibits71: Chart on North America - Year-over-year growth 2023-2028 (%)
- Exhibits72: Data Table on North America - Year-over-year growth 2023-2028 (%)
- Exhibits73: Chart on Europe - Market size and forecast 2023-2028 ($ million)
- Exhibits74: Data Table on Europe - Market size and forecast 2023-2028 ($ million)
- Exhibits75: Chart on Europe - Year-over-year growth 2023-2028 (%)
- Exhibits76: Data Table on Europe - Year-over-year growth 2023-2028 (%)
- Exhibits77: Chart on APAC - Market size and forecast 2023-2028 ($ million)
- Exhibits78: Data Table on APAC - Market size and forecast 2023-2028 ($ million)
- Exhibits79: Chart on APAC - Year-over-year growth 2023-2028 (%)
- Exhibits80: Data Table on APAC - Year-over-year growth 2023-2028 (%)
- Exhibits81: Chart on South America - Market size and forecast 2023-2028 ($ million)
- Exhibits82: Data Table on South America - Market size and forecast 2023-2028 ($ million)
- Exhibits83: Chart on South America - Year-over-year growth 2023-2028 (%)
- Exhibits84: Data Table on South America - Year-over-year growth 2023-2028 (%)
- Exhibits85: Chart on Middle East and Africa - Market size and forecast 2023-2028 ($ million)
- Exhibits86: Data Table on Middle East and Africa - Market size and forecast 2023-2028 ($ million)
- Exhibits87: Chart on Middle East and Africa - Year-over-year growth 2023-2028 (%)
- Exhibits88: Data Table on Middle East and Africa - Year-over-year growth 2023-2028 (%)
- Exhibits89: Chart on US - Market size and forecast 2023-2028 ($ million)
- Exhibits90: Data Table on US - Market size and forecast 2023-2028 ($ million)
- Exhibits91: Chart on US - Year-over-year growth 2023-2028 (%)
- Exhibits92: Data Table on US - Year-over-year growth 2023-2028 (%)
- Exhibits93: Chart on Germany - Market size and forecast 2023-2028 ($ million)
- Exhibits94: Data Table on Germany - Market size and forecast 2023-2028 ($ million)
- Exhibits95: Chart on Germany - Year-over-year growth 2023-2028 (%)
- Exhibits96: Data Table on Germany - Year-over-year growth 2023-2028 (%)
- Exhibits97: Chart on China - Market size and forecast 2023-2028 ($ million)
- Exhibits98: Data Table on China - Market size and forecast 2023-2028 ($ million)
- Exhibits99: Chart on China - Year-over-year growth 2023-2028 (%)
- Exhibits100: Data Table on China - Year-over-year growth 2023-2028 (%)
- Exhibits101: Chart on France - Market size and forecast 2023-2028 ($ million)
- Exhibits102: Data Table on France - Market size and forecast 2023-2028 ($ million)
- Exhibits103: Chart on France - Year-over-year growth 2023-2028 (%)
- Exhibits104: Data Table on France - Year-over-year growth 2023-2028 (%)
- Exhibits105: Chart on Japan - Market size and forecast 2023-2028 ($ million)
- Exhibits106: Data Table on Japan - Market size and forecast 2023-2028 ($ million)
- Exhibits107: Chart on Japan - Year-over-year growth 2023-2028 (%)
- Exhibits108: Data Table on Japan - Year-over-year growth 2023-2028 (%)
- Exhibits109: Market opportunity By Geographical Landscape($ million)
- Exhibits110: Data Tables on Market opportunity By Geographical Landscape($ million)
- Exhibits111: Impact of drivers and challenges in 2023 and 2028
- Exhibits112: Overview on criticality of inputs and factors of differentiation
- Exhibits113: Overview on factors of disruption
- Exhibits114: Impact of key risks on business
- Exhibits115: Companies covered
- Exhibits116: Matrix on companies position and classification
- Exhibits117: Amphenol Corp. - Overview
- Exhibits118: Amphenol Corp. - Business segments
- Exhibits119: Amphenol Corp. - Key offerings
- Exhibits120: Amphenol Corp. - Segment focus
- Exhibits121: ANTONICS ICP GmbH - Overview
- Exhibits122: ANTONICS ICP GmbH - Product / Service
- Exhibits123: ANTONICS ICP GmbH - Key offerings
- Exhibits124: Continental AG - Overview
- Exhibits125: Continental AG - Business segments
- Exhibits126: Continental AG - Key news
- Exhibits127: Continental AG - Key offerings
- Exhibits128: Continental AG - Segment focus
- Exhibits129: FIAMM Componenti Accessori FCA Spa - Overview
- Exhibits130: FIAMM Componenti Accessori FCA Spa - Product / Service
- Exhibits131: FIAMM Componenti Accessori FCA Spa - Key offerings
- Exhibits132: Guangdong Shenglu Telecommunication Tech Co. Ltd. - Overview
- Exhibits133: Guangdong Shenglu Telecommunication Tech Co. Ltd. - Product / Service
- Exhibits134: Guangdong Shenglu Telecommunication Tech Co. Ltd. - Key offerings
- Exhibits135: Harada Industry Co. Ltd. - Overview
- Exhibits136: Harada Industry Co. Ltd. - Business segments
- Exhibits137: Harada Industry Co. Ltd. - Key offerings
- Exhibits138: Harada Industry Co. Ltd. - Segment focus
- Exhibits139: Kymeta Corp. - Overview
- Exhibits140: Kymeta Corp. - Product / Service
- Exhibits141: Kymeta Corp. - Key offerings
- Exhibits142: Laird Group - Overview
- Exhibits143: Laird Group - Product / Service
- Exhibits144: Laird Group - Key offerings
- Exhibits145: Lorom Industrial Co Ltd - Overview
- Exhibits146: Lorom Industrial Co Ltd - Product / Service
- Exhibits147: Lorom Industrial Co Ltd - Key offerings
- Exhibits148: MP Antenna Ltd. - Overview
- Exhibits149: MP Antenna Ltd. - Product / Service
- Exhibits150: MP Antenna Ltd. - Key offerings
- Exhibits151: Schaffner Group - Overview
- Exhibits152: Schaffner Group - Business segments
- Exhibits153: Schaffner Group - Key offerings
- Exhibits154: Schaffner Group - Segment focus
- Exhibits155: Taoglas Group Holdings Ltd. - Overview
- Exhibits156: Taoglas Group Holdings Ltd. - Product / Service
- Exhibits157: Taoglas Group Holdings Ltd. - Key offerings
- Exhibits158: TE Connectivity Ltd. - Overview
- Exhibits159: TE Connectivity Ltd. - Business segments
- Exhibits160: TE Connectivity Ltd. - Key offerings
- Exhibits161: TE Connectivity Ltd. - Segment focus
- Exhibits162: Telefonaktiebolaget LM Ericsson - Overview
- Exhibits163: Telefonaktiebolaget LM Ericsson - Business segments
- Exhibits164: Telefonaktiebolaget LM Ericsson - Key news
- Exhibits165: Telefonaktiebolaget LM Ericsson - Key offerings
- Exhibits166: Telefonaktiebolaget LM Ericsson - Segment focus
- Exhibits167: Texas Instruments Inc. - Overview
- Exhibits168: Texas Instruments Inc. - Business segments
- Exhibits169: Texas Instruments Inc. - Key news
- Exhibits170: Texas Instruments Inc. - Key offerings
- Exhibits171: Texas Instruments Inc. - Segment focus
- Exhibits172: Inclusions checklist
- Exhibits173: Exclusions checklist
- Exhibits174: Currency conversion rates for US$
- Exhibits175: Research methodology
- Exhibits176: Information sources
- Exhibits177: Data validation
- Exhibits178: Validation techniques employed for market sizing
- Exhibits179: Data synthesis
- Exhibits180: 360 degree market analysis
- Exhibits181: List of abbreviations
The automotive antenna module market is forecasted to grow by USD 1171.1 mn during 2023-2028, accelerating at a CAGR of 10.13% during the forecast period. The report on the automotive antenna module market provides a holistic analysis, market size and forecast, trends, growth drivers, and challenges, as well as vendor analysis covering around 25 vendors.
The report offers an up-to-date analysis regarding the current market scenario, the latest trends and drivers, and the overall market environment. The market is driven by increasing connectivity technologies in vehicles, increasing focus on autonomous vehicles, and regulatory changes to mandate safety equipment like ecall.
Technavio's automotive antenna module market is segmented as below:
| Market Scope | |
|---|---|
| Base Year | 2024 |
| End Year | 2028 |
| Series Year | 2024-2028 |
| Growth Momentum | Accelerate |
| YOY 2024 | 8.96% |
| CAGR | 10.13% |
| Incremental Value | $1171.1mn |
By Frequency Range
- High-range
- Medium-range
- Low-range
By Vehicle Type
- Passenger cars
- Commercial vehicles
By Geography
- North America
- Europe
- APAC
- South America
- Middle East and Africa
This study identifies the growing popularity of cellular V2X technologies as one of the prime reasons driving the automotive antenna module market growth during the next few years. Also, development of software-defined antennas to control electronically and development of flat-panel antenna technology will lead to sizable demand in the market.
The report on the automotive antenna module market covers the following areas:
- Automotive antenna module market sizing
- Automotive antenna module market forecast
- Automotive antenna module market industry analysis
The robust vendor analysis is designed to help clients improve their market position, and in line with this, this report provides a detailed analysis of several leading automotive antenna module market vendors that include Amphenol Corp., ANTONICS ICP GmbH, Continental AG, FIAMM Componenti Accessori FCA Spa, Guangdong Shenglu Telecommunication Tech Co. Ltd., Harada Industry Co. Ltd., Kymeta Corp., Laird Group, Lorom Industrial Co Ltd, MP Antenna Ltd., Panasonic Holdings Corp., Ruian Tianye Auto Parts Co. Ltd., Samsung Electronics Co. Ltd., Schaffner Group, Schwarzbeck Mess Elektronik OHG, SHIEN LIEN ENT Co Ltd, Taoglas Group Holdings Ltd., TE Connectivity Ltd., Telefonaktiebolaget LM Ericsson, and Texas Instruments Inc.. Also, the automotive antenna module market analysis report includes information on upcoming trends and challenges that will influence market growth. This is to help companies strategize and leverage all forthcoming growth opportunities.
The study was conducted using an objective combination of primary and secondary information including inputs from key participants in the industry. The report contains a comprehensive market and vendor landscape in addition to an analysis of the key vendors.
The publisher presents a detailed picture of the market by the way of study, synthesis, and summation of data from multiple sources by an analysis of key parameters such as profit, pricing, competition, and promotions. It presents various market facets by identifying the key industry influencers. The data presented is comprehensive, reliable, and a result of extensive research - both primary and secondary. The market research reports provide a complete competitive landscape and an in-depth vendor selection methodology and analysis using qualitative and quantitative research to forecast the accurate market growth.
Table of Contents
1 Executive Summary
- 1.1 Market overview
- Executive Summary - Chart on Market Overview
- Executive Summary - Data Table on Market Overview
- Executive Summary - Chart on Global Market Characteristics
- Executive Summary - Chart on Market by Geography
- Executive Summary - Chart on Market Segmentation by Frequency Range
- Executive Summary - Chart on Market Segmentation by Vehicle Type
- Executive Summary - Chart on Incremental Growth
- Executive Summary - Data Table on Incremental Growth
- Executive Summary - Chart on Company Market Positioning
2 Market Landscape
- 2.1 Market ecosystem
- Parent Market
- Data Table on - Parent Market
- 2.2 Market characteristics
- Market characteristics analysis
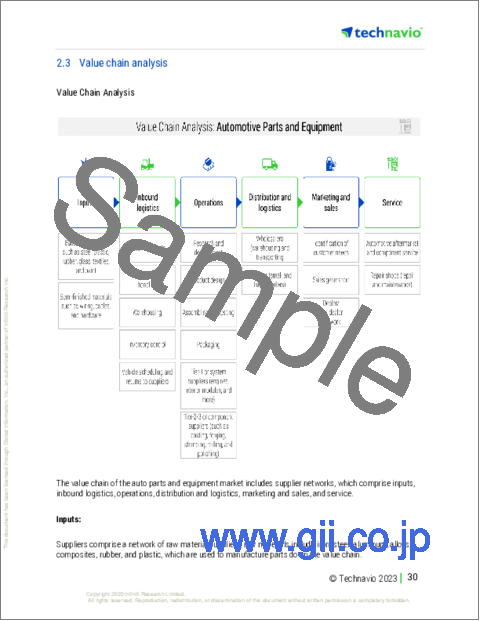
- 2.3 Value chain analysis
- Value Chain Analysis
3 Market Sizing
- 3.1 Market definition
- Offerings of companies included in the market definition
- 3.2 Market segment analysis
- Market segments
- 3.3 Market size 2023
- 3.4 Market outlook: Forecast for 2023-2028
- Chart on Global - Market size and forecast 2023-2028 ($ million)
- Data Table on Global - Market size and forecast 2023-2028 ($ million)
- Chart on Global Market: Year-over-year growth 2023-2028 (%)
- Data Table on Global Market: Year-over-year growth 2023-2028 (%)
4 Historic Market Size
- 4.1 Global Automotive Antenna Module Market 2018 - 2022
- Historic Market Size - Data Table on Global Automotive Antenna Module Market 2018 - 2022 ($ million)
- 4.2 Frequency Range segment analysis 2018 - 2022
- Historic Market Size - Frequency Range Segment 2018 - 2022 ($ million)
- 4.3 Vehicle Type segment analysis 2018 - 2022
- Historic Market Size - Vehicle Type Segment 2018 - 2022 ($ million)
- 4.4 Geography segment analysis 2018 - 2022
- Historic Market Size - Geography Segment 2018 - 2022 ($ million)
- 4.5 Country segment analysis 2018 - 2022
- Historic Market Size - Country Segment 2018 - 2022 ($ million)
5 Five Forces Analysis
- 5.1 Five forces summary
- Five forces analysis - Comparison between 2023 and 2028
- 5.2 Bargaining power of buyers
- Bargaining power of buyers - Impact of key factors 2023 and 2028
- 5.3 Bargaining power of suppliers
- Bargaining power of suppliers - Impact of key factors in 2023 and 2028
- 5.4 Threat of new entrants
- Threat of new entrants - Impact of key factors in 2023 and 2028
- 5.5 Threat of substitutes
- Threat of substitutes - Impact of key factors in 2023 and 2028
- 5.6 Threat of rivalry
- Threat of rivalry - Impact of key factors in 2023 and 2028
- 5.7 Market condition
- Chart on Market condition - Five forces 2023 and 2028
6 Market Segmentation by Frequency Range
- 6.1 Market segments
- Chart on Frequency Range - Market share 2023-2028 (%)
- Data Table on Frequency Range - Market share 2023-2028 (%)
- 6.2 Comparison by Frequency Range
- Chart on Comparison by Frequency Range
- Data Table on Comparison by Frequency Range
- 6.3 High-range - Market size and forecast 2023-2028
- Chart on High-range - Market size and forecast 2023-2028 ($ million)
- Data Table on High-range - Market size and forecast 2023-2028 ($ million)
- Chart on High-range - Year-over-year growth 2023-2028 (%)
- Data Table on High-range - Year-over-year growth 2023-2028 (%)
- 6.4 Medium-range - Market size and forecast 2023-2028
- Chart on Medium-range - Market size and forecast 2023-2028 ($ million)
- Data Table on Medium-range - Market size and forecast 2023-2028 ($ million)
- Chart on Medium-range - Year-over-year growth 2023-2028 (%)
- Data Table on Medium-range - Year-over-year growth 2023-2028 (%)
- 6.5 Low-range - Market size and forecast 2023-2028
- Chart on Low-range - Market size and forecast 2023-2028 ($ million)
- Data Table on Low-range - Market size and forecast 2023-2028 ($ million)
- Chart on Low-range - Year-over-year growth 2023-2028 (%)
- Data Table on Low-range - Year-over-year growth 2023-2028 (%)
- 6.6 Market opportunity by Frequency Range
- Market opportunity by Frequency Range ($ million)
- Data Table on Market opportunity by Frequency Range ($ million)
7 Market Segmentation by Vehicle Type
- 7.1 Market segments
- Chart on Vehicle Type - Market share 2023-2028 (%)
- Data Table on Vehicle Type - Market share 2023-2028 (%)
- 7.2 Comparison by Vehicle Type
- Chart on Comparison by Vehicle Type
- Data Table on Comparison by Vehicle Type
- 7.3 Passenger cars - Market size and forecast 2023-2028
- Chart on Passenger cars - Market size and forecast 2023-2028 ($ million)
- Data Table on Passenger cars - Market size and forecast 2023-2028 ($ million)
- Chart on Passenger cars - Year-over-year growth 2023-2028 (%)
- Data Table on Passenger cars - Year-over-year growth 2023-2028 (%)
- 7.4 Commercial vehicles - Market size and forecast 2023-2028
- Chart on Commercial vehicles - Market size and forecast 2023-2028 ($ million)
- Data Table on Commercial vehicles - Market size and forecast 2023-2028 ($ million)
- Chart on Commercial vehicles - Year-over-year growth 2023-2028 (%)
- Data Table on Commercial vehicles - Year-over-year growth 2023-2028 (%)
- 7.5 Market opportunity by Vehicle Type
- Market opportunity by Vehicle Type ($ million)
- Data Table on Market opportunity by Vehicle Type ($ million)
8 Customer Landscape
- 8.1 Customer landscape overview
- Analysis of price sensitivity, lifecycle, customer purchase basket, adoption rates, and purchase criteria
9 Geographic Landscape
- 9.1 Geographic segmentation
- Chart on Market share By Geographical Landscape2023-2028 (%)
- Data Table on Market share By Geographical Landscape2023-2028 (%)
- 9.2 Geographic comparison
- Chart on Geographic comparison
- Data Table on Geographic comparison
- 9.3 North America - Market size and forecast 2023-2028
- Chart on North America - Market size and forecast 2023-2028 ($ million)
- Data Table on North America - Market size and forecast 2023-2028 ($ million)
- Chart on North America - Year-over-year growth 2023-2028 (%)
- Data Table on North America - Year-over-year growth 2023-2028 (%)
- 9.4 Europe - Market size and forecast 2023-2028
- Chart on Europe - Market size and forecast 2023-2028 ($ million)
- Data Table on Europe - Market size and forecast 2023-2028 ($ million)
- Chart on Europe - Year-over-year growth 2023-2028 (%)
- Data Table on Europe - Year-over-year growth 2023-2028 (%)
- 9.5 APAC - Market size and forecast 2023-2028
- Chart on APAC - Market size and forecast 2023-2028 ($ million)
- Data Table on APAC - Market size and forecast 2023-2028 ($ million)
- Chart on APAC - Year-over-year growth 2023-2028 (%)
- Data Table on APAC - Year-over-year growth 2023-2028 (%)
- 9.6 South America - Market size and forecast 2023-2028
- Chart on South America - Market size and forecast 2023-2028 ($ million)
- Data Table on South America - Market size and forecast 2023-2028 ($ million)
- Chart on South America - Year-over-year growth 2023-2028 (%)
- Data Table on South America - Year-over-year growth 2023-2028 (%)
- 9.7 Middle East and Africa - Market size and forecast 2023-2028
- Chart on Middle East and Africa - Market size and forecast 2023-2028 ($ million)
- Data Table on Middle East and Africa - Market size and forecast 2023-2028 ($ million)
- Chart on Middle East and Africa - Year-over-year growth 2023-2028 (%)
- Data Table on Middle East and Africa - Year-over-year growth 2023-2028 (%)
- 9.8 US - Market size and forecast 2023-2028
- Chart on US - Market size and forecast 2023-2028 ($ million)
- Data Table on US - Market size and forecast 2023-2028 ($ million)
- Chart on US - Year-over-year growth 2023-2028 (%)
- Data Table on US - Year-over-year growth 2023-2028 (%)
- 9.9 Germany - Market size and forecast 2023-2028
- Chart on Germany - Market size and forecast 2023-2028 ($ million)
- Data Table on Germany - Market size and forecast 2023-2028 ($ million)
- Chart on Germany - Year-over-year growth 2023-2028 (%)
- Data Table on Germany - Year-over-year growth 2023-2028 (%)
- 9.10 China - Market size and forecast 2023-2028
- Chart on China - Market size and forecast 2023-2028 ($ million)
- Data Table on China - Market size and forecast 2023-2028 ($ million)
- Chart on China - Year-over-year growth 2023-2028 (%)
- Data Table on China - Year-over-year growth 2023-2028 (%)
- 9.11 France - Market size and forecast 2023-2028
- Chart on France - Market size and forecast 2023-2028 ($ million)
- Data Table on France - Market size and forecast 2023-2028 ($ million)
- Chart on France - Year-over-year growth 2023-2028 (%)
- Data Table on France - Year-over-year growth 2023-2028 (%)
- 9.12 Japan - Market size and forecast 2023-2028
- Chart on Japan - Market size and forecast 2023-2028 ($ million)
- Data Table on Japan - Market size and forecast 2023-2028 ($ million)
- Chart on Japan - Year-over-year growth 2023-2028 (%)
- Data Table on Japan - Year-over-year growth 2023-2028 (%)
- 9.13 Market opportunity by geography
- Market opportunity By Geographical Landscape($ million)
- Data Tables on Market opportunity By Geographical Landscape($ million)
10 Drivers, Challenges, and Opportunity/Restraints
- 10.1 Market drivers
- 10.2 Market challenges
- 10.3 Impact of drivers and challenges
- Impact of drivers and challenges in 2023 and 2028
- 10.4 Market opportunities/restraints
11 Competitive Landscape
- 11.1 Overview
- 11.2 Competitive Landscape
- Overview on criticality of inputs and factors of differentiation
- 11.3 Landscape disruption
- Overview on factors of disruption
- 11.4 Industry risks
- Impact of key risks on business
12 Competitive Analysis
- 12.1 Companies profiled
- Companies covered
- 12.2 Market positioning of companies
- Matrix on companies position and classification
- 12.3 Amphenol Corp.
- Amphenol Corp. - Overview
- Amphenol Corp. - Business segments
- Amphenol Corp. - Key offerings
- Amphenol Corp. - Segment focus
- 12.4 ANTONICS ICP GmbH
- ANTONICS ICP GmbH - Overview
- ANTONICS ICP GmbH - Product / Service
- ANTONICS ICP GmbH - Key offerings
- 12.5 Continental AG
- Continental AG - Overview
- Continental AG - Business segments
- Continental AG - Key news
- Continental AG - Key offerings
- Continental AG - Segment focus
- 12.6 FIAMM Componenti Accessori FCA Spa
- FIAMM Componenti Accessori FCA Spa - Overview
- FIAMM Componenti Accessori FCA Spa - Product / Service
- FIAMM Componenti Accessori FCA Spa - Key offerings
- 12.7 Guangdong Shenglu Telecommunication Tech Co. Ltd.
- Guangdong Shenglu Telecommunication Tech Co. Ltd. - Overview
- Guangdong Shenglu Telecommunication Tech Co. Ltd. - Product / Service
- Guangdong Shenglu Telecommunication Tech Co. Ltd. - Key offerings
- 12.8 Harada Industry Co. Ltd.
- Harada Industry Co. Ltd. - Overview
- Harada Industry Co. Ltd. - Business segments
- Harada Industry Co. Ltd. - Key offerings
- Harada Industry Co. Ltd. - Segment focus
- 12.9 Kymeta Corp.
- Kymeta Corp. - Overview
- Kymeta Corp. - Product / Service
- Kymeta Corp. - Key offerings
- 12.10 Laird Group
- Laird Group - Overview
- Laird Group - Product / Service
- Laird Group - Key offerings
- 12.11 Lorom Industrial Co Ltd
- Lorom Industrial Co Ltd - Overview
- Lorom Industrial Co Ltd - Product / Service
- Lorom Industrial Co Ltd - Key offerings
- 12.12 MP Antenna Ltd.
- MP Antenna Ltd. - Overview
- MP Antenna Ltd. - Product / Service
- MP Antenna Ltd. - Key offerings
- 12.13 Schaffner Group
- Schaffner Group - Overview
- Schaffner Group - Business segments
- Schaffner Group - Key offerings
- Schaffner Group - Segment focus
- 12.14 Taoglas Group Holdings Ltd.
- Taoglas Group Holdings Ltd. - Overview
- Taoglas Group Holdings Ltd. - Product / Service
- Taoglas Group Holdings Ltd. - Key offerings
- 12.15 TE Connectivity Ltd.
- TE Connectivity Ltd. - Overview
- TE Connectivity Ltd. - Business segments
- TE Connectivity Ltd. - Key offerings
- TE Connectivity Ltd. - Segment focus
- 12.16 Telefonaktiebolaget LM Ericsson
- Telefonaktiebolaget LM Ericsson - Overview
- Telefonaktiebolaget LM Ericsson - Business segments
- Telefonaktiebolaget LM Ericsson - Key news
- Telefonaktiebolaget LM Ericsson - Key offerings
- Telefonaktiebolaget LM Ericsson - Segment focus
- 12.17 Texas Instruments Inc.
- Texas Instruments Inc. - Overview
- Texas Instruments Inc. - Business segments
- Texas Instruments Inc. - Key news
- Texas Instruments Inc. - Key offerings
- Texas Instruments Inc. - Segment focus
13 Appendix
- 13.1 Scope of the report
- 13.2 Inclusions and exclusions checklist
- Inclusions checklist
- Exclusions checklist
- 13.3 Currency conversion rates for US$
- Currency conversion rates for US$
- 13.4 Research methodology
- Research methodology
- 13.5 Data procurement
- Information sources
- 13.6 Data validation
- Data validation
- 13.7 Validation techniques employed for market sizing
- Validation techniques employed for market sizing
- 13.8 Data synthesis
- Data synthesis
- 13.9 market analysis
- market analysis
- 13.10 List of abbreviations
- List of abbreviations

