|
|
市場調査レポート
商品コード
1701827
OTC人工涙液市場レポート:製品別、容器タイプ別、製剤別、用途別、流通チャネル別、地域別、2025年~2033年OTC Artificial Tears Market Report by Product, Container Type, Formulation, Application, Distribution Channel, and Region 2025-2033 |
||||||
|
|||||||
カスタマイズ可能
|
|||||||


| OTC人工涙液市場レポート:製品別、容器タイプ別、製剤別、用途別、流通チャネル別、地域別、2025年~2033年 |
|
出版日: 2025年04月01日
発行: IMARC
ページ情報: 英文 147 Pages
納期: 2~3営業日
|

全表示
- 概要
- 図表
- 目次
OTC人工涙液市場の世界市場規模は2024年に54億米ドルに達しました。今後、IMARC Groupは、市場は2033年までに80億米ドルに達し、2025~2033年の成長率(CAGR)は4.4%になると予測しています。
OTC人工涙液は、目の潤滑、目の痛み、不快感、灼熱感、充血、羞明、炎症を緩和するために使用される目薬です。デキストラン、グリセリン、プロピレングリコール、ヒドロキシプロピルメチルセルロース(HPMC)、カルボキシメチルセルロースを使用して製造されます。人工涙液はドライアイの治療に広く使用されています。ドライアイとは、結膜や角膜、目の表面全体に十分な水分や潤滑が生成されない病状です。OTC人工涙液は生体適合性があり、涙液膜を安定させ、治癒を促進し、涙の蒸発を最小限に抑えます。これに加えて、OTC人工涙液は、軟膏、スプレー、乳剤、溶液、ゲルなどの形状で販売されており、利便性に優れています。
OTC人工涙液市場傾向:
慢性的な眼障害に罹患しやすい老人人口の増加は、市場の成長を促進する重要な要因の1つです。ドライアイ症候群(DES)、糖尿病、栄養不足の有病率の増加により、目の不快感を即座に緩和するOTC人工涙液の需要が高まっています。さらに、スマートフォン、テレビ(TV)、ノートパソコンなどの電子機器の利用が増加し、画面の見過ぎや目の疲労につながっていることが、OTC人工涙液の採用にプラスの影響を与えています。まばたき活性化コーティングを強化した製品の開発など、様々な製品革新が市場成長の原動力となっています。これらのコーティングは、蒸発性ドライアイ症候群を患う患者に眼に潤いを与えます。これに伴い、角膜への酸素の流れを促進し、目の表面の乾燥を防ぐためにコンタクトレンズが広く採用されていることも、市場の成長を後押ししています。その他の要因としては、特に都市部における汚染レベルの上昇や、大衆の健康意識の高まりなどが挙げられ、市場成長の原動力になると予想されます。
本レポートで扱う主な質問
- 2024年の世界のOTC人工涙液市場の市場規模は?
- 2025-2033年における世界のOTC人工涙液市場の予想成長率は?
- 世界のOTC人工涙液市場を牽引する主要因は何か?
- 世界のOTC人工涙液市場に対するCOVID-19の影響は?
- 世界のOTC人工涙液市場の製品別内訳は?
- 世界のOTC人工涙液市場の容器タイプ別内訳は?
- 世界のOTC人工涙液市場の剤形別の内訳は?
- 世界のOTC人工涙液市場の用途別の内訳は?
- OTC人工涙液市場の世界における流通チャネル別の内訳は?
- OTC人工涙液市場の世界における主要地域は?
- 世界のOTC人工涙液市場における主要プレイヤー/企業は?
目次
第1章 序文
第2章 調査範囲と調査手法
- 調査の目的
- ステークホルダー
- データソース
- 一次情報
- 二次情報
- 市場推定
- ボトムアップアプローチ
- トップダウンアプローチ
- 調査手法
第3章 エグゼクティブサマリー
第4章 イントロダクション
- 概要
- 主要業界動向
第5章 世界のOTC人工涙液市場
- 市場概要
- 市場実績
- COVID-19の影響
- 市場予測
第6章 市場内訳:製品別
- ソリューション
- 軟膏
- 乳剤
- ゲル
- スプレー溶液
- サスペンション
第7章 市場内訳:容器タイプ別
- プラスチック製単回投与容器
- プラスチック製マルチドーズ容器
- その他
第8章 市場内訳:製剤別
- 防腐剤ベース
- 防腐剤不使用
第9章 市場内訳:用途別
- ドライアイ症候群
- アレルギー
- 感染症
- UVとブルーライトからの保護
- コンタクトレンズの水分保持
- その他
第10章 市場内訳:流通チャネル別
- 病院薬局
- ドラッグストアと薬局
- オンライン薬局
第11章 市場内訳:地域別
- 北米
- 米国
- カナダ
- アジア太平洋地域
- 中国
- 日本
- インド
- 韓国
- オーストラリア
- インドネシア
- その他
- 欧州
- ドイツ
- フランス
- 英国
- イタリア
- スペイン
- ロシア
- その他
- ラテンアメリカ
- ブラジル
- メキシコ
- その他
- 中東・アフリカ
- 市場内訳:国別
第12章 SWOT分析
- 概要
- 強み
- 弱み
- 機会
- 脅威
第13章 バリューチェーン分析
第14章 ポーターのファイブフォース分析
- 概要
- 買い手の交渉力
- 供給企業の交渉力
- 競合の程度
- 新規参入業者の脅威
- 代替品の脅威
第15章 価格分析
第16章 競合情勢
- 市場構造
- 主要企業
- 主要企業のプロファイル
- AbbVie Inc.
- Akorn Inc.
- Alcon
- Bausch Health Companies Inc.
- Johnson & Johnson
- Nicox S.A.
- OASIS Medical
- OCuSOFT Inc.
- Santen Pharmaceutical Co. Ltd.
- Similasan Corporation
- Sun Pharmaceutical Industries Ltd.
- URSAPHARM Arzneimittel GmbH
List of Figures
- Figure 1: Global: OTC Artificial Tears Market: Major Drivers and Challenges
- Figure 2: Global: OTC Artificial Tears Market: Sales Value (in Billion USD), 2019-2024
- Figure 3: Global: OTC Artificial Tears Market Forecast: Sales Value (in Billion USD), 2025-2033
- Figure 4: Global: OTC Artificial Tears Market: Breakup by Product (in %), 2024
- Figure 5: Global: OTC Artificial Tears Market: Breakup by Container Type (in %), 2024
- Figure 6: Global: OTC Artificial Tears Market: Breakup by Formulation (in %), 2024
- Figure 7: Global: OTC Artificial Tears Market: Breakup by Application (in %), 2024
- Figure 8: Global: OTC Artificial Tears Market: Breakup by Distribution Channel (in %), 2024
- Figure 9: Global: OTC Artificial Tears Market: Breakup by Region (in %), 2024
- Figure 10: Global: OTC Artificial Tears (Solution) Market: Sales Value (in Million USD), 2019 & 2024
- Figure 11: Global: OTC Artificial Tears (Solution) Market Forecast: Sales Value (in Million USD), 2025-2033
- Figure 12: Global: OTC Artificial Tears (Ointment) Market: Sales Value (in Million USD), 2019 & 2024
- Figure 13: Global: OTC Artificial Tears (Ointment) Market Forecast: Sales Value (in Million USD), 2025-2033
- Figure 14: Global: OTC Artificial Tears (Emulsion) Market: Sales Value (in Million USD), 2019 & 2024
- Figure 15: Global: OTC Artificial Tears (Emulsion) Market Forecast: Sales Value (in Million USD), 2025-2033
- Figure 16: Global: OTC Artificial Tears (Gel) Market: Sales Value (in Million USD), 2019 & 2024
- Figure 17: Global: OTC Artificial Tears (Gel) Market Forecast: Sales Value (in Million USD), 2025-2033
- Figure 18: Global: OTC Artificial Tears (Spray Solution) Market: Sales Value (in Million USD), 2019 & 2024
- Figure 19: Global: OTC Artificial Tears (Spray Solution) Market Forecast: Sales Value (in Million USD), 2025-2033
- Figure 20: Global: OTC Artificial Tears (Suspensions) Market: Sales Value (in Million USD), 2019 & 2024
- Figure 21: Global: OTC Artificial Tears (Suspensions) Market Forecast: Sales Value (in Million USD), 2025-2033
- Figure 22: Global: OTC Artificial Tears (Plastic Single Dose Container) Market: Sales Value (in Million USD), 2019 & 2024
- Figure 23: Global: OTC Artificial Tears (Plastic Single Dose Container) Market Forecast: Sales Value (in Million USD), 2025-2033
- Figure 24: Global: OTC Artificial Tears (Plastic Multi-Dose Container) Market: Sales Value (in Million USD), 2019 & 2024
- Figure 25: Global: OTC Artificial Tears (Plastic Multi-Dose Container) Market Forecast: Sales Value (in Million USD), 2025-2033
- Figure 26: Global: OTC Artificial Tears (Other Container Types) Market: Sales Value (in Million USD), 2019 & 2024
- Figure 27: Global: OTC Artificial Tears (Other Container Types) Market Forecast: Sales Value (in Million USD), 2025-2033
- Figure 28: Global: OTC Artificial Tears (Preservative Based) Market: Sales Value (in Million USD), 2019 & 2024
- Figure 29: Global: OTC Artificial Tears (Preservative Based) Market Forecast: Sales Value (in Million USD), 2025-2033
- Figure 30: Global: OTC Artificial Tears (Non-Preservative Based) Market: Sales Value (in Million USD), 2019 & 2024
- Figure 31: Global: OTC Artificial Tears (Non-Preservative Based) Market Forecast: Sales Value (in Million USD), 2025-2033
- Figure 32: Global: OTC Artificial Tears (Dry Eye Syndrome) Market: Sales Value (in Million USD), 2019 & 2024
- Figure 33: Global: OTC Artificial Tears (Dry Eye Syndrome) Market Forecast: Sales Value (in Million USD), 2025-2033
- Figure 34: Global: OTC Artificial Tears (Allergies) Market: Sales Value (in Million USD), 2019 & 2024
- Figure 35: Global: OTC Artificial Tears (Allergies) Market Forecast: Sales Value (in Million USD), 2025-2033
- Figure 36: Global: OTC Artificial Tears (Infections) Market: Sales Value (in Million USD), 2019 & 2024
- Figure 37: Global: OTC Artificial Tears (Infections) Market Forecast: Sales Value (in Million USD), 2025-2033
- Figure 38: Global: OTC Artificial Tears (UV and Blue Light Protection) Market: Sales Value (in Million USD), 2019 & 2024
- Figure 39: Global: OTC Artificial Tears (UV and Blue Light Protection) Market Forecast: Sales Value (in Million USD), 2025-2033
- Figure 40: Global: OTC Artificial Tears (Contact Lens Moisture Retention) Market: Sales Value (in Million USD), 2019 & 2024
- Figure 41: Global: OTC Artificial Tears (Contact Lens Moisture Retention) Market Forecast: Sales Value (in Million USD), 2025-2033
- Figure 42: Global: OTC Artificial Tears (Other Applications) Market: Sales Value (in Million USD), 2019 & 2024
- Figure 43: Global: OTC Artificial Tears (Other Applications) Market Forecast: Sales Value (in Million USD), 2025-2033
- Figure 44: Global: OTC Artificial Tears (Hospital Pharmacies) Market: Sales Value (in Million USD), 2019 & 2024
- Figure 45: Global: OTC Artificial Tears (Hospital Pharmacies) Market Forecast: Sales Value (in Million USD), 2025-2033
- Figure 46: Global: OTC Artificial Tears (Drug Store and Retail Pharmacies) Market: Sales Value (in Million USD), 2019 & 2024
- Figure 47: Global: OTC Artificial Tears (Drug Store and Retail Pharmacies) Market Forecast: Sales Value (in Million USD), 2025-2033
- Figure 48: Global: OTC Artificial Tears (Online Pharmacies) Market: Sales Value (in Million USD), 2019 & 2024
- Figure 49: Global: OTC Artificial Tears (Online Pharmacies) Market Forecast: Sales Value (in Million USD), 2025-2033
- Figure 50: North America: OTC Artificial Tears Market: Sales Value (in Million USD), 2019 & 2024
- Figure 51: North America: OTC Artificial Tears Market Forecast: Sales Value (in Million USD), 2025-2033
- Figure 52: United States: OTC Artificial Tears Market: Sales Value (in Million USD), 2019 & 2024
- Figure 53: United States: OTC Artificial Tears Market Forecast: Sales Value (in Million USD), 2025-2033
- Figure 54: Canada: OTC Artificial Tears Market: Sales Value (in Million USD), 2019 & 2024
- Figure 55: Canada: OTC Artificial Tears Market Forecast: Sales Value (in Million USD), 2025-2033
- Figure 56: Asia-Pacific: OTC Artificial Tears Market: Sales Value (in Million USD), 2019 & 2024
- Figure 57: Asia-Pacific: OTC Artificial Tears Market Forecast: Sales Value (in Million USD), 2025-2033
- Figure 58: China: OTC Artificial Tears Market: Sales Value (in Million USD), 2019 & 2024
- Figure 59: China: OTC Artificial Tears Market Forecast: Sales Value (in Million USD), 2025-2033
- Figure 60: Japan: OTC Artificial Tears Market: Sales Value (in Million USD), 2019 & 2024
- Figure 61: Japan: OTC Artificial Tears Market Forecast: Sales Value (in Million USD), 2025-2033
- Figure 62: India: OTC Artificial Tears Market: Sales Value (in Million USD), 2019 & 2024
- Figure 63: India: OTC Artificial Tears Market Forecast: Sales Value (in Million USD), 2025-2033
- Figure 64: South Korea: OTC Artificial Tears Market: Sales Value (in Million USD), 2019 & 2024
- Figure 65: South Korea: OTC Artificial Tears Market Forecast: Sales Value (in Million USD), 2025-2033
- Figure 66: Australia: OTC Artificial Tears Market: Sales Value (in Million USD), 2019 & 2024
- Figure 67: Australia: OTC Artificial Tears Market Forecast: Sales Value (in Million USD), 2025-2033
- Figure 68: Indonesia: OTC Artificial Tears Market: Sales Value (in Million USD), 2019 & 2024
- Figure 69: Indonesia: OTC Artificial Tears Market Forecast: Sales Value (in Million USD), 2025-2033
- Figure 70: Others: OTC Artificial Tears Market: Sales Value (in Million USD), 2019 & 2024
- Figure 71: Others: OTC Artificial Tears Market Forecast: Sales Value (in Million USD), 2025-2033
- Figure 72: Europe: OTC Artificial Tears Market: Sales Value (in Million USD), 2019 & 2024
- Figure 73: Europe: OTC Artificial Tears Market Forecast: Sales Value (in Million USD), 2025-2033
- Figure 74: Germany: OTC Artificial Tears Market: Sales Value (in Million USD), 2019 & 2024
- Figure 75: Germany: OTC Artificial Tears Market Forecast: Sales Value (in Million USD), 2025-2033
- Figure 76: France: OTC Artificial Tears Market: Sales Value (in Million USD), 2019 & 2024
- Figure 77: France: OTC Artificial Tears Market Forecast: Sales Value (in Million USD), 2025-2033
- Figure 78: United Kingdom: OTC Artificial Tears Market: Sales Value (in Million USD), 2019 & 2024
- Figure 79: United Kingdom: OTC Artificial Tears Market Forecast: Sales Value (in Million USD), 2025-2033
- Figure 80: Italy: OTC Artificial Tears Market: Sales Value (in Million USD), 2019 & 2024
- Figure 81: Italy: OTC Artificial Tears Market Forecast: Sales Value (in Million USD), 2025-2033
- Figure 82: Spain: OTC Artificial Tears Market: Sales Value (in Million USD), 2019 & 2024
- Figure 83: Spain: OTC Artificial Tears Market Forecast: Sales Value (in Million USD), 2025-2033
- Figure 84: Russia: OTC Artificial Tears Market: Sales Value (in Million USD), 2019 & 2024
- Figure 85: Russia: OTC Artificial Tears Market Forecast: Sales Value (in Million USD), 2025-2033
- Figure 86: Others: OTC Artificial Tears Market: Sales Value (in Million USD), 2019 & 2024
- Figure 87: Others: OTC Artificial Tears Market Forecast: Sales Value (in Million USD), 2025-2033
- Figure 88: Latin America: OTC Artificial Tears Market: Sales Value (in Million USD), 2019 & 2024
- Figure 89: Latin America: OTC Artificial Tears Market Forecast: Sales Value (in Million USD), 2025-2033
- Figure 90: Brazil: OTC Artificial Tears Market: Sales Value (in Million USD), 2019 & 2024
- Figure 91: Brazil: OTC Artificial Tears Market Forecast: Sales Value (in Million USD), 2025-2033
- Figure 92: Mexico: OTC Artificial Tears Market: Sales Value (in Million USD), 2019 & 2024
- Figure 93: Mexico: OTC Artificial Tears Market Forecast: Sales Value (in Million USD), 2025-2033
- Figure 94: Others: OTC Artificial Tears Market: Sales Value (in Million USD), 2019 & 2024
- Figure 95: Others: OTC Artificial Tears Market Forecast: Sales Value (in Million USD), 2025-2033
- Figure 96: Middle East and Africa: OTC Artificial Tears Market: Sales Value (in Million USD), 2019 & 2024
- Figure 97: Middle East and Africa: OTC Artificial Tears Market: Breakup by Country (in %), 2024
- Figure 98: Middle East and Africa: OTC Artificial Tears Market Forecast: Sales Value (in Million USD), 2025-2033
- Figure 99: Global: OTC Artificial Tears Industry: SWOT Analysis
- Figure 100: Global: OTC Artificial Tears Industry: Value Chain Analysis
- Figure 101: Global: OTC Artificial Tears Industry: Porter's Five Forces Analysis
List of Tables
- Table 1: Global: OTC Artificial Tears Market: Key Industry Highlights, 2024 and 2033
- Table 2: Global: OTC Artificial Tears Market Forecast: Breakup by Product (in Million USD), 2025-2033
- Table 3: Global: OTC Artificial Tears Market Forecast: Breakup by Container Type (in Million USD), 2025-2033
- Table 4: Global: OTC Artificial Tears Market Forecast: Breakup by Formulation (in Million USD), 2025-2033
- Table 5: Global: OTC Artificial Tears Market Forecast: Breakup by Application (in Million USD), 2025-2033
- Table 6: Global: OTC Artificial Tears Market Forecast: Breakup by Distribution Channel (in Million USD), 2025-2033
- Table 7: Global: OTC Artificial Tears Market Forecast: Breakup by Region (in Million USD), 2025-2033
- Table 8: Global: OTC Artificial Tears Market: Competitive Structure
- Table 9: Global: OTC Artificial Tears Market: Key Players
The global OTC artificial tears market size reached USD 5.4 Billion in 2024. Looking forward, IMARC Group expects the market to reach USD 8.0 Billion by 2033, exhibiting a growth rate (CAGR) of 4.4% during 2025-2033.
Over the Counter (OTC) artificial tears are eye drops that are used for lubricating eyes and providing relief from pain, discomfort, burning, redness, photophobia and irritation in the eyes. They are manufactured using dextran, glycerin, propylene glycol, hydroxypropyl methylcellulose (HPMC) and carboxymethylcellulose. Artificial tears are widely used for the treatment of dry eyes, which is a medical condition when sufficient moisture or lubrication is not generated on the conjunctiva, cornea or entire surface of the eye. OTC artificial tears are biocompatible and aid in stabilizing the tear film, promoting healing and minimizing tear evaporation. In addition to this, OTC artificial tears are also available in ointment, spray, emulsion, solution and gel forms that are highly convenient use.
OTC Artificial Tears Market Trends:
The rising geriatric population that is prone to chronic eye-related disorders is one of the key factors driving the growth of the market. Due to the increasing prevalence of dry eye syndrome (DES), diabetes and nutritional deficiencies, there is a rising demand for OTC artificial tears to provide immediate relief from discomfort in the eyes. Additionally, the increasing utilization of electronics, such as smartphones, televisions (TVs) and laptops, leading to excessive screen time and eye fatigue, is positively impacting the adoption of OTC artificial tears. Various product innovations, such as the development of variants fortified with blink-activated coatings, are providing a thrust to the market growth. These coatings provide ocular hydration to patients suffering from evaporative dry eye syndrome. In line with this, the widespread product adoption with contact lenses to facilitate the flow of oxygen to the cornea and prevent dryness on the surface of the eyes is favoring the market growth. Other factors, including rising levels of pollution, especially in the urban regions, along with the increasing health consciousness among the masses, are anticipated to drive the market toward growth.
Key Market Segmentation:
Breakup by Product:
- Solution
- Ointment
- Emulsion
- Gel
- Spray Solution
- Suspensions
Breakup by Container Type:
- Plastic Single Dose Container
- Plastic Multi-Dose Container
- Others
Breakup by Formulation:
- Preservative Based
- Non-Preservative Based
Breakup by Application:
- Dry Eye Syndrome
- Allergies
- Infections
- UV and Blue Light Protection
- Contact Lens Moisture Retention
- Others
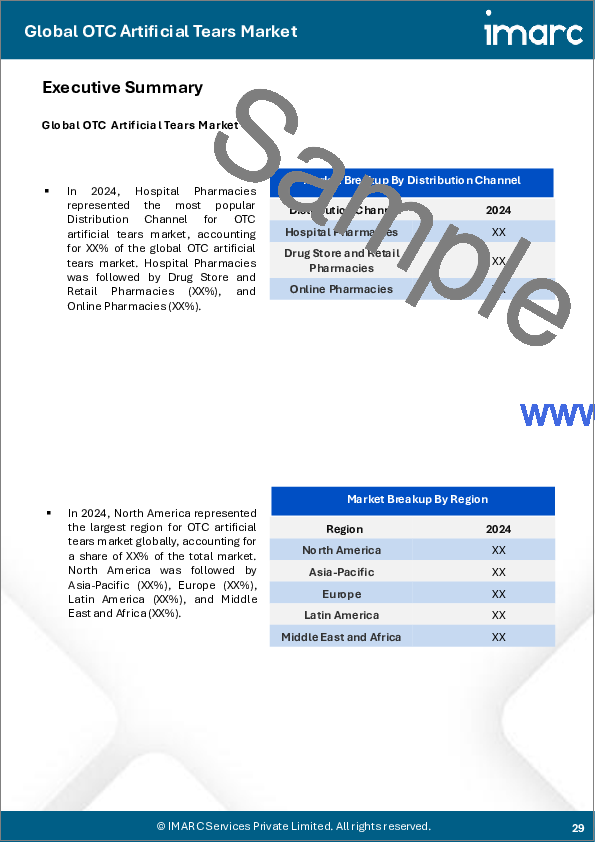
Breakup by Distribution Channel:
- Hospital Pharmacies
- Drug Store and Retail Pharmacies
- Online Pharmacies
Breakup by Region:
- North America
- United States
- Canada
- Asia-Pacific
- China
- Japan
- India
- South Korea
- Australia
- Indonesia
- Others
- Europe
- Germany
- France
- United Kingdom
- Italy
- Spain
- Russia
- Others
- Latin America
- Brazil
- Mexico
- Others
- Middle East and Africa
Competitive Landscape:
The competitive landscape of the industry has also been examined along with the profiles of the key players being AbbVie Inc., Akorn Inc., Alcon, Bausch Health Companies Inc., Johnson & Johnson, Nicox S.A., OASIS Medical, OCuSOFT Inc., Santen Pharmaceutical Co. Ltd., Similasan Corporation, Sun Pharmaceutical Industries Ltd. and URSAPHARM Arzneimittel GmbH.
Key Questions Answered in This Report
- 1.What was the size of the global OTC artificial tears market in 2024?
- 2.What is the expected growth rate of the global OTC artificial tears market during 2025-2033?
- 3.What are the key factors driving the global OTC artificial tears market?
- 4.What has been the impact of COVID-19 on the global OTC artificial tears market?
- 5.What is the breakup of the global OTC artificial tears market based on the product?
- 6.What is the breakup of the global OTC artificial tears market based on the container type?
- 7.What is the breakup of the global OTC artificial tears market based on formulation?
- 8.What is the breakup of the global OTC artificial tears market based on the application?
- 9. What is the breakup of the global OTC artificial tears market based on the distribution channel?
- 10.What are the key regions in the global OTC artificial tears market?
- 11.Who are the key players/companies in the global OTC artificial tears market?
Table of Contents
1 Preface
2 Scope and Methodology
- 2.1 Objectives of the Study
- 2.2 Stakeholders
- 2.3 Data Sources
- 2.3.1 Primary Sources
- 2.3.2 Secondary Sources
- 2.4 Market Estimation
- 2.4.1 Bottom-Up Approach
- 2.4.2 Top-Down Approach
- 2.5 Forecasting Methodology
3 Executive Summary
4 Introduction
- 4.1 Overview
- 4.2 Key Industry Trends
5 Global OTC Artificial Tears Market
- 5.1 Market Overview
- 5.2 Market Performance
- 5.3 Impact of COVID-19
- 5.4 Market Forecast
6 Market Breakup by Product
- 6.1 Solution
- 6.1.1 Market Trends
- 6.1.2 Market Forecast
- 6.2 Ointment
- 6.2.1 Market Trends
- 6.2.2 Market Forecast
- 6.3 Emulsion
- 6.3.1 Market Trends
- 6.3.2 Market Forecast
- 6.4 Gel
- 6.4.1 Market Trends
- 6.4.2 Market Forecast
- 6.5 Spray Solution
- 6.5.1 Market Trends
- 6.5.2 Market Forecast
- 6.6 Suspensions
- 6.6.1 Market Trends
- 6.6.2 Market Forecast
7 Market Breakup by Container Type
- 7.1 Plastic Single Dose Container
- 7.1.1 Market Trends
- 7.1.2 Market Forecast
- 7.2 Plastic Multi-Dose Container
- 7.2.1 Market Trends
- 7.2.2 Market Forecast
- 7.3 Others
- 7.3.1 Market Trends
- 7.3.2 Market Forecast
8 Market Breakup by Formulation
- 8.1 Preservative Based
- 8.1.1 Market Trends
- 8.1.2 Market Forecast
- 8.2 Non-Preservative Based
- 8.2.1 Market Trends
- 8.2.2 Market Forecast
9 Market Breakup by Application
- 9.1 Dry Eye Syndrome
- 9.1.1 Market Trends
- 9.1.2 Market Forecast
- 9.2 Allergies
- 9.2.1 Market Trends
- 9.2.2 Market Forecast
- 9.3 Infections
- 9.3.1 Market Trends
- 9.3.2 Market Forecast
- 9.4 UV and Blue Light Protection
- 9.4.1 Market Trends
- 9.4.2 Market Forecast
- 9.5 Contact Lens Moisture Retention
- 9.5.1 Market Trends
- 9.5.2 Market Forecast
- 9.6 Others
- 9.6.1 Market Trends
- 9.6.2 Market Forecast
10 Market Breakup by Distribution Channel
- 10.1 Hospital Pharmacies
- 10.1.1 Market Trends
- 10.1.2 Market Forecast
- 10.2 Drug Store and Retail Pharmacies
- 10.2.1 Market Trends
- 10.2.2 Market Forecast
- 10.3 Online Pharmacies
- 10.3.1 Market Trends
- 10.3.2 Market Forecast
11 Market Breakup by Region
- 11.1 North America
- 11.1.1 United States
- 11.1.1.1 Market Trends
- 11.1.1.2 Market Forecast
- 11.1.2 Canada
- 11.1.2.1 Market Trends
- 11.1.2.2 Market Forecast
- 11.1.1 United States
- 11.2 Asia-Pacific
- 11.2.1 China
- 11.2.1.1 Market Trends
- 11.2.1.2 Market Forecast
- 11.2.2 Japan
- 11.2.2.1 Market Trends
- 11.2.2.2 Market Forecast
- 11.2.3 India
- 11.2.3.1 Market Trends
- 11.2.3.2 Market Forecast
- 11.2.4 South Korea
- 11.2.4.1 Market Trends
- 11.2.4.2 Market Forecast
- 11.2.5 Australia
- 11.2.5.1 Market Trends
- 11.2.5.2 Market Forecast
- 11.2.6 Indonesia
- 11.2.6.1 Market Trends
- 11.2.6.2 Market Forecast
- 11.2.7 Others
- 11.2.7.1 Market Trends
- 11.2.7.2 Market Forecast
- 11.2.1 China
- 11.3 Europe
- 11.3.1 Germany
- 11.3.1.1 Market Trends
- 11.3.1.2 Market Forecast
- 11.3.2 France
- 11.3.2.1 Market Trends
- 11.3.2.2 Market Forecast
- 11.3.3 United Kingdom
- 11.3.3.1 Market Trends
- 11.3.3.2 Market Forecast
- 11.3.4 Italy
- 11.3.4.1 Market Trends
- 11.3.4.2 Market Forecast
- 11.3.5 Spain
- 11.3.5.1 Market Trends
- 11.3.5.2 Market Forecast
- 11.3.6 Russia
- 11.3.6.1 Market Trends
- 11.3.6.2 Market Forecast
- 11.3.7 Others
- 11.3.7.1 Market Trends
- 11.3.7.2 Market Forecast
- 11.3.1 Germany
- 11.4 Latin America
- 11.4.1 Brazil
- 11.4.1.1 Market Trends
- 11.4.1.2 Market Forecast
- 11.4.2 Mexico
- 11.4.2.1 Market Trends
- 11.4.2.2 Market Forecast
- 11.4.3 Others
- 11.4.3.1 Market Trends
- 11.4.3.2 Market Forecast
- 11.4.1 Brazil
- 11.5 Middle East and Africa
- 11.5.1 Market Trends
- 11.5.2 Market Breakup by Country
- 11.5.3 Market Forecast
12 SWOT Analysis
- 12.1 Overview
- 12.2 Strengths
- 12.3 Weaknesses
- 12.4 Opportunities
- 12.5 Threats
13 Value Chain Analysis
14 Porters Five Forces Analysis
- 14.1 Overview
- 14.2 Bargaining Power of Buyers
- 14.3 Bargaining Power of Suppliers
- 14.4 Degree of Competition
- 14.5 Threat of New Entrants
- 14.6 Threat of Substitutes
15 Price Analysis
16 Competitive Landscape
- 16.1 Market Structure
- 16.2 Key Players
- 16.3 Profiles of Key Players
- 16.3.1 AbbVie Inc.
- 16.3.1.1 Company Overview
- 16.3.1.2 Product Portfolio
- 16.3.1.3 Financials
- 16.3.1.4 SWOT Analysis
- 16.3.2 Akorn Inc.
- 16.3.2.1 Company Overview
- 16.3.2.2 Product Portfolio
- 16.3.2.3 Financials
- 16.3.2.4 SWOT Analysis
- 16.3.3 Alcon
- 16.3.3.1 Company Overview
- 16.3.3.2 Product Portfolio
- 16.3.3.3 Financials
- 16.3.4 Bausch Health Companies Inc.
- 16.3.4.1 Company Overview
- 16.3.4.2 Product Portfolio
- 16.3.4.3 Financials
- 16.3.4.4 SWOT Analysis
- 16.3.5 Johnson & Johnson
- 16.3.5.1 Company Overview
- 16.3.5.2 Product Portfolio
- 16.3.5.3 Financials
- 16.3.5.4 SWOT Analysis
- 16.3.6 Nicox S.A.
- 16.3.6.1 Company Overview
- 16.3.6.2 Product Portfolio
- 16.3.6.3 Financials
- 16.3.7 OASIS Medical
- 16.3.7.1 Company Overview
- 16.3.7.2 Product Portfolio
- 16.3.8 OCuSOFT Inc.
- 16.3.8.1 Company Overview
- 16.3.8.2 Product Portfolio
- 16.3.9 Santen Pharmaceutical Co. Ltd.
- 16.3.9.1 Company Overview
- 16.3.9.2 Product Portfolio
- 16.3.9.3 Financials
- 16.3.9.4 SWOT Analysis
- 16.3.10 Similasan Corporation
- 16.3.10.1 Company Overview
- 16.3.10.2 Product Portfolio
- 16.3.11 Sun Pharmaceutical Industries Ltd.
- 16.3.11.1 Company Overview
- 16.3.11.2 Product Portfolio
- 16.3.11.3 Financials
- 16.3.11.4 SWOT Analysis
- 16.3.12 URSAPHARM Arzneimittel GmbH
- 16.3.12.1 Company Overview
- 16.3.12.2 Product Portfolio
- 16.3.1 AbbVie Inc.
