|
|
市場調査レポート
商品コード
1422070
人工涙液市場:製品・剤形・適応症・配合・流通チャネル・地域別、機会、予測、2017年~2031年Artificial Tears Market Assessment, By Product, By Dosage Form, By Indication, By Formulation, By Distribution Channel, By Region, Opportunities and Forecast, 2017-2031F |
||||||

|
|||||||
カスタマイズ可能
|
|||||||

| 人工涙液市場:製品・剤形・適応症・配合・流通チャネル・地域別、機会、予測、2017年~2031年 |
|
出版日: 2024年02月07日
発行: Markets & Data
ページ情報: 英文 231 Pages
納期: 3~5営業日
|

全表示
- 概要
- 図表
- 目次
世界の人工涙液の市場規模は、2023年の32億7,000万米ドルから、予測期間中は6.14%のCAGRで推移し、2031年には52億6,000万米ドルに達すると予測されています。
世界の人工涙液市場の成長は、加齢、長時間の画面露出、環境要因に影響されるドライアイ症候群の発生率の上昇など、さまざまな要因に起因しています。さらに、アイケア技術の進歩やドライアイになりやすい高齢化社会の進行も、市場成長を大きく後押ししています。さらに、ライフスタイルの変化や目の健康に関する意識の高まりも、市場成長を促進する上で極めて重要な役割を果たしています。
ドライアイ症候群の発生率の増加
ドライアイ症候群の大幅な増加は、世界の人工涙液市場の急速な拡大を促進する主な要因です。ドライアイ症候群の増加は、人口の高齢化、長時間のスクリーン使用、環境要因などさまざまな影響から生じています。加齢に伴う生理的変化によって、涙の分泌量が変化し、ドライアイになりやすくなります。
同時に、コンピューターやスマートフォンなどの機器による長時間の画面露出は、眼精疲労とそれに続くドライアイに大きく影響します。汚染や乾燥した気候などの環境要素もこれらの懸念を悪化させ、人工涙液の需要を増大させています。ドライアイ症候群の有病率の増加は、人工涙液の処方や治療法における継続的な進歩や技術革新を刺激する極めて重要な要因です。これらの進歩は、眼症状の緩和を求める人々のニーズの拡大に対応しています。
技術の進歩
技術の進歩も人工涙液の世界市場を促進する触媒の役割を果たします。眼科医療技術における継続的な技術革新は、ドライアイ問題を管理するためのより効率的で専門的な治療法を常に生み出しています。これらの画期的な技術革新は、改良された製剤、正確な送達システム、改良された診断機器を提示することで、治療アプローチを大きく変えます。高度な技術により、個々の患者の要望に合わせた人工涙液製剤の開発が容易になり、有効性と快適性が向上しています。このような進歩は市場を拡大し、人工涙液製品の水準を高め、ドライアイ症状の緩和を求める人々の進化するニーズを満たすのに役立っています。
当レポートでは、世界の人工涙液の市場を調査し、市場の定義と概要、市場規模の推移・予測、各種区分・地域別の詳細分析、産業構造、市場成長への影響因子の分析、ケーススタディ、競合情勢、主要企業のプロファイルなどをまとめています。
目次
第1章 調査手法
第2章 プロジェクトの範囲と定義
第3章 エグゼクティブサマリー
第4章 世界の人工涙液市場の展望
- 市場規模・予測
- 製品別
- ヒアルロン酸ナトリウム
- ポリエチレングリコール
- プロピレングリコール
- 油性エマルジョン
- セルロース
- グリセリン
- 剤形別
- ソリューション
- 乳剤
- 軟膏
- 噴射
- ゲル
- 懸濁液
- 適応症別
- ドライアイ症候群
- 感染症
- アレルギー
- コンタクトレンズの保湿
- 紫外線とブルーライトからの保護
- その他
- 配合別
- 防腐剤使用
- 防腐剤不使用
- 流通チャネル別
- 病院薬局
- 小売薬局
- 眼科薬局
- オンライン薬局
- 地域別
- 北米
- 欧州
- 南米
- アジア太平洋
- 中東・アフリカ
- 企業別市場シェア
第5章 世界の人工涙液市場の見通し:地域別
- 北米
- 欧州
- 南米
- アジア太平
- 中東・アフリカ
第6章 市場マッピング
- 製品別
- 剤形別
- 適応症別
- 配合別
- 流通チャネル別
- 地域別
第7章 マクロ環境と産業構造
- 需給分析
- 輸出入分析
- バリューチェーン分析
- PESTEL分析
- ポーターのファイブフォース分析
第8章 市場力学
- 成長推進因子
- 成長抑制因子 (課題・障壁)
第9章 規制の枠組み・イノベーション
- 臨床試験
- 特許の情勢
- 規制当局の承認
- イノベーション/最新技術
第10章 主要企業の情勢
- 市場リーダー上位5社の競合マトリックス
- 市場リーダー上位5社の市場収益分析
- M&A・ジョイントベンチャー (該当する場合)
- SWOT分析 (参入5社)
- 特許分析 (該当する場合)
第11章 価格分析
第12章 ケーススタディ
第13章 主要企業の見通し
- Johnson & Johnson Services, Inc.
- Bausch & Lomb Incorporated
- AbbVie Inc.
- Alimera Sciences, Inc.
- Sun Pharmaceutical Industries Limited
- Akorn Operating Company LLC
- Alcon Laboratories Inc.
- OCuSOFT Inc.
- Santen Pharmaceutical Co., Ltd.
- Similasan AG
- Ursapharm Arzneimittel GmbH
- Allergan plc
第14章 戦略的提言
第15章 当社について・免責事項
List of Tables
- Table 1. Pricing Analysis of Products from Key Players
- Table 2. Competition Matrix of Top 5 Market Leaders
- Table 3. Mergers & Acquisitions/ Joint Ventures (If Applicable)
- Table 4. About Us - Regions and Countries Where We Have Executed Client Projects
List of Figures
- Figure 1. Global Artificial Tears Market, By Value, In USD Billion, 2017-2031F
- Figure 2. Global Artificial Tears Market, By Volume, In Thousand Units, 2017-2031F
- Figure 3. Global Artificial Tears Market Share (%), By Product, 2017-2031F
- Figure 4. Global Artificial Tears Market Share (%), By Dosage Form, 2017-2031F
- Figure 5. Global Artificial Tears Market Share (%), By Indication, 2017-2031F
- Figure 6. Global Artificial Tears Market Share (%), By Formulation, 2017-2031F
- Figure 7. Global Artificial Tears Market Share (%), By Distribution Channel, 2017-2031F
- Figure 8. Global Artificial Tears Market Share (%), By Region, 2017-2031F
- Figure 9. North America Artificial Tears Market, By Value, In USD Billion, 2017-2031F
- Figure 10. North America Artificial Tears Market, By Volume, In Thousand Units, 2017-2031F
- Figure 11. North America Artificial Tears Market Share (%), By Product, 2017-2031F
- Figure 12. North America Artificial Tears Market Share (%), By Dosage Form, 2017-2031F
- Figure 13. North America Artificial Tears Market Share (%), By Indication, 2017-2031F
- Figure 14. North America Artificial Tears Market Share (%), By Formulation, 2017-2031F
- Figure 15. North America Artificial Tears Market Share (%), By Distribution Channel, 2017-2031F
- Figure 16. North America Artificial Tears Market Share (%), By Country, 2017-2031F
- Figure 17. United States Artificial Tears Market, By Value, In USD Billion, 2017-2031F
- Figure 18. United States Artificial Tears Market, By Volume, In Thousand Units, 2017-2031F
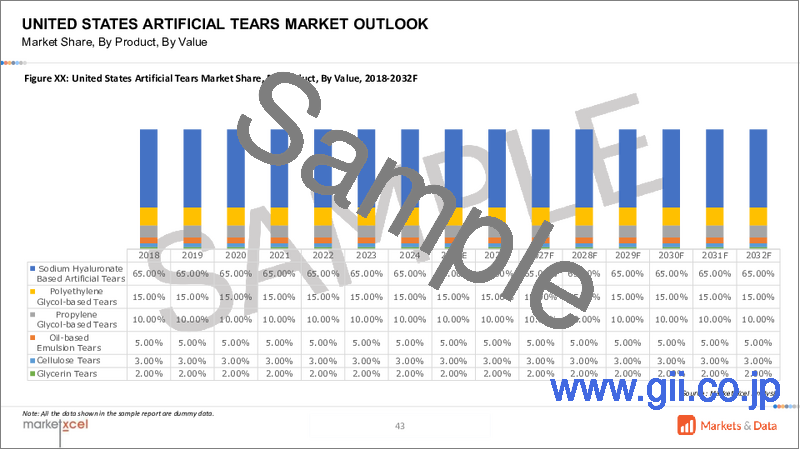
- Figure 19. United States Artificial Tears Market Share (%), By Product, 2017-2031F
- Figure 20. United States Artificial Tears Market Share (%), By Dosage Form, 2017-2031F
- Figure 21. United States Artificial Tears Market Share (%), By Indication, 2017-2031F
- Figure 22. United States Artificial Tears Market Share (%), By Formulation, 2017-2031F
- Figure 23. United States Artificial Tears Market Share (%), By Distribution Channel, 2017-2031F
- Figure 24. Canada Artificial Tears Market, By Value, In USD Billion, 2017-2031F
- Figure 25. Canada Artificial Tears Market, By Volume, In Thousand Units, 2017-2031F
- Figure 26. Canada Artificial Tears Market Share (%), By Product, 2017-2031F
- Figure 27. Canada Artificial Tears Market Share (%), By Dosage Form, 2017-2031F
- Figure 28. Canada Artificial Tears Market Share (%), By Indication, 2017-2031F
- Figure 29. Canada Artificial Tears Market Share (%), By Formulation, 2017-2031F
- Figure 30. Canada Artificial Tears Market Share (%), By Distribution Channel, 2017-2031F
- Figure 31. Mexico Artificial Tears Market, By Value, In USD Billion, 2017-2031F
- Figure 32. Mexico Artificial Tears Market, By Volume, In Thousand Units, 2017-2031F
- Figure 33. Mexico Artificial Tears Market Share (%), By Product, 2017-2031F
- Figure 34. Mexico Artificial Tears Market Share (%), By Dosage Form, 2017-2031F
- Figure 35. Mexico Artificial Tears Market Share (%), By Indication, 2017-2031F
- Figure 36. Mexico Artificial Tears Market Share (%), By Formulation, 2017-2031F
- Figure 37. Mexico Artificial Tears Market Share (%), By Distribution Channel, 2017-2031F
- Figure 38. Europe Artificial Tears Market, By Value, In USD Billion, 2017-2031F
- Figure 39. Europe Artificial Tears Market, By Volume, In Thousand Units, 2017-2031F
- Figure 40. Europe Artificial Tears Market Share (%), By Product, 2017-2031F
- Figure 41. Europe Artificial Tears Market Share (%), By Dosage Form, 2017-2031F
- Figure 42. Europe Artificial Tears Market Share (%), By Indication, 2017-2031F
- Figure 43. Europe Artificial Tears Market Share (%), By Formulation, 2017-2031F
- Figure 44. Europe Artificial Tears Market Share (%), By Distribution Channel, 2017-2031F
- Figure 45. Europe Artificial Tears Market Share (%), By Country, 2017-2031F
- Figure 46. Germany Artificial Tears Market, By Value, In USD Billion, 2017-2031F
- Figure 47. Germany Artificial Tears Market, By Volume, In Thousand Units, 2017-2031F
- Figure 48. Germany Artificial Tears Market Share (%), By Product, 2017-2031F
- Figure 49. Germany Artificial Tears Market Share (%), By Dosage Form, 2017-2031F
- Figure 50. Germany Artificial Tears Market Share (%), By Indication, 2017-2031F
- Figure 51. Germany Artificial Tears Market Share (%), By Formulation, 2017-2031F
- Figure 52. Germany Artificial Tears Market Share (%), By Distribution Channel, 2017-2031F
- Figure 53. France Artificial Tears Market, By Value, In USD Billion, 2017-2031F
- Figure 54. France Artificial Tears Market, By Volume, In Thousand Units, 2017-2031F
- Figure 55. France Artificial Tears Market Share (%), By Product, 2017-2031F
- Figure 56. France Artificial Tears Market Share (%), By Dosage Form, 2017-2031F
- Figure 57. France Artificial Tears Market Share (%), By Indication, 2017-2031F
- Figure 58. France Artificial Tears Market Share (%), By Formulation, 2017-2031F
- Figure 59. France Artificial Tears Market Share (%), By Distribution Channel, 2017-2031F
- Figure 60. Italy Artificial Tears Market, By Value, In USD Billion, 2017-2031F
- Figure 61. Italy Artificial Tears Market, By Volume, In Thousand Units, 2017-2031F
- Figure 62. Italy Artificial Tears Market Share (%), By Product, 2017-2031F
- Figure 63. Italy Artificial Tears Market Share (%), By Dosage Form, 2017-2031F
- Figure 64. Italy Artificial Tears Market Share (%), By Indication, 2017-2031F
- Figure 65. Italy Artificial Tears Market Share (%), By Formulation, 2017-2031F
- Figure 66. Italy Artificial Tears Market Share (%), By Distribution Channel, 2017-2031F
- Figure 67. United Kingdom Artificial Tears Market, By Value, In USD Billion, 2017-2031F
- Figure 68. United Kingdom Artificial Tears Market, By Volume, In Thousand Units, 2017-2031F
- Figure 69. United Kingdom Artificial Tears Market Share (%), By Product, 2017-2031F
- Figure 70. United Kingdom Artificial Tears Market Share (%), By Dosage Form, 2017-2031F
- Figure 71. United Kingdom Artificial Tears Market Share (%), By Indication, 2017-2031F
- Figure 72. United Kingdom Artificial Tears Market Share (%), By Formulation, 2017-2031F
- Figure 73. United Kingdom Artificial Tears Market Share (%), By Distribution Channel, 2017-2031F
- Figure 74. Russia Artificial Tears Market, By Value, In USD Billion, 2017-2031F
- Figure 75. Russia Artificial Tears Market, By Volume, In Thousand Units, 2017-2031F
- Figure 76. Russia Artificial Tears Market Share (%), By Product, 2017-2031F
- Figure 77. Russia Artificial Tears Market Share (%), By Dosage Form, 2017-2031F
- Figure 78. Russia Artificial Tears Market Share (%), By Indication, 2017-2031F
- Figure 79. Russia Artificial Tears Market Share (%), By Formulation, 2017-2031F
- Figure 80. Russia Artificial Tears Market Share (%), By Distribution Channel, 2017-2031F
- Figure 81. Netherlands Artificial Tears Market, By Value, In USD Billion, 2017-2031F
- Figure 82. Netherlands Artificial Tears Market, By Volume, In Thousand Units, 2017-2031F
- Figure 83. Netherlands Artificial Tears Market Share (%), By Product, 2017-2031F
- Figure 84. Netherlands Artificial Tears Market Share (%), By Dosage Form, 2017-2031F
- Figure 85. Netherlands Artificial Tears Market Share (%), By Indication, 2017-2031F
- Figure 86. Netherlands Artificial Tears Market Share (%), By Formulation, 2017-2031F
- Figure 87. Netherlands Artificial Tears Market Share (%), By Distribution Channel, 2017-2031F
- Figure 88. Spain Artificial Tears Market, By Value, In USD Billion, 2017-2031F
- Figure 89. Spain Artificial Tears Market, By Volume, In Thousand Units, 2017-2031F
- Figure 90. Spain Artificial Tears Market Share (%), By Product, 2017-2031F
- Figure 91. Spain Artificial Tears Market Share (%), By Dosage Form, 2017-2031F
- Figure 92. Spain Artificial Tears Market Share (%), By Indication, 2017-2031F
- Figure 93. Spain Artificial Tears Market Share (%), By Formulation, 2017-2031F
- Figure 94. Spain Artificial Tears Market Share (%), By Distribution Channel, 2017-2031F
- Figure 95. Turkey Artificial Tears Market, By Value, In USD Billion, 2017-2031F
- Figure 96. Turkey Artificial Tears Market, By Volume, In Thousand Units, 2017-2031F
- Figure 97. Turkey Artificial Tears Market Share (%), By Product, 2017-2031F
- Figure 98. Turkey Artificial Tears Market Share (%), By Dosage Form, 2017-2031F
- Figure 99. Turkey Artificial Tears Market Share (%), By Indication, 2017-2031F
- Figure 100. Turkey Artificial Tears Market Share (%), By Formulation, 2017-2031F
- Figure 101. Turkey Artificial Tears Market Share (%), By Distribution Channel, 2017-2031F
- Figure 102. Poland Artificial Tears Market, By Value, In USD Billion, 2017-2031F
- Figure 103. Poland Artificial Tears Market, By Volume, In Thousand Units, 2017-2031F
- Figure 104. Poland Artificial Tears Market Share (%), By Product, 2017-2031F
- Figure 105. Poland Artificial Tears Market Share (%), By Dosage Form, 2017-2031F
- Figure 106. Poland Artificial Tears Market Share (%), By Indication, 2017-2031F
- Figure 107. Poland Artificial Tears Market Share (%), By Formulation, 2017-2031F
- Figure 108. Poland Artificial Tears Market Share (%), By Distribution Channel, 2017-2031F
- Figure 109. South America Artificial Tears Market, By Value, In USD Billion, 2017-2031F
- Figure 110. South America Artificial Tears Market, By Volume, In Thousand Units, 2017-2031F
- Figure 111. South America Artificial Tears Market Share (%), By Product, 2017-2031F
- Figure 112. South America Artificial Tears Market Share (%), By Dosage Form, 2017-2031F
- Figure 113. South America Artificial Tears Market Share (%), By Indication, 2017-2031F
- Figure 114. South America Artificial Tears Market Share (%), By Formulation, 2017-2031F
- Figure 115. South America Artificial Tears Market Share (%), By Distribution Channel, 2017-2031F
- Figure 116. South America Artificial Tears Market Share (%), By Country, 2017-2031F
- Figure 117. Brazil Artificial Tears Market, By Value, In USD Billion, 2017-2031F
- Figure 118. Brazil Artificial Tears Market, By Volume, In Thousand Units, 2017-2031F
- Figure 119. Brazil Artificial Tears Market Share (%), By Product, 2017-2031F
- Figure 120. Brazil Artificial Tears Market Share (%), By Dosage Form, 2017-2031F
- Figure 121. Brazil Artificial Tears Market Share (%), By Indication, 2017-2031F
- Figure 122. Brazil Artificial Tears Market Share (%), By Formulation, 2017-2031F
- Figure 123. Brazil Artificial Tears Market Share (%), By Distribution Channel, 2017-2031F
- Figure 124. Argentina Artificial Tears Market, By Value, In USD Billion, 2017-2031F
- Figure 125. Argentina Artificial Tears Market, By Volume, In Thousand Units, 2017-2031F
- Figure 126. Argentina Artificial Tears Market Share (%), By Product, 2017-2031F
- Figure 127. Argentina Artificial Tears Market Share (%), By Dosage Form, 2017-2031F
- Figure 128. Argentina Artificial Tears Market Share (%), By Indication, 2017-2031F
- Figure 129. Argentina Artificial Tears Market Share (%), By Formulation, 2017-2031F
- Figure 130. Argentina Artificial Tears Market Share (%), By Distribution Channel, 2017-2031F
- Figure 131. Asia-Pacific Artificial Tears Market, By Value, In USD Billion, 2017-2031F
- Figure 132. Asia-Pacific Artificial Tears Market, By Volume, In Thousand Units, 2017-2031F
- Figure 133. Asia-Pacific Artificial Tears Market Share (%), By Product, 2017-2031F
- Figure 134. Asia-Pacific Artificial Tears Market Share (%), By Dosage Form, 2017-2031F
- Figure 135. Asia-Pacific Artificial Tears Market Share (%), By Indication, 2017-2031F
- Figure 136. Asia-Pacific Artificial Tears Market Share (%), By Formulation, 2017-2031F
- Figure 137. Asia- Pacific Artificial Tears Market Share (%), By Distribution Channel, 2017-2031F
- Figure 138. Asia-Pacific Artificial Tears Market Share (%), By Country, 2017-2031F
- Figure 139. India Artificial Tears Market, By Value, In USD Billion, 2017-2031F
- Figure 140. India Artificial Tears Market, By Volume, In Thousand Units, 2017-2031F
- Figure 141. India Artificial Tears Market Share (%), By Product, 2017-2031F
- Figure 142. India Artificial Tears Market Share (%), By Dosage Form, 2017-2031F
- Figure 143. India Artificial Tears Market Share (%), By Indication, 2017-2031F
- Figure 144. India Artificial Tears Market Share (%), By Formulation, 2017-2031F
- Figure 145. India Artificial Tears Market Share (%), By Distribution Channel, 2017-2031F
- Figure 146. China Artificial Tears Market, By Value, In USD Billion, 2017-2031F
- Figure 147. China Artificial Tears Market, By Volume, In Thousand Units, 2017-2031F
- Figure 148. China Artificial Tears Market Share (%), By Product, 2017-2031F
- Figure 149. China Artificial Tears Market Share (%), By Dosage Form, 2017-2031F
- Figure 150. China Artificial Tears Market Share (%), By Indication, 2017-2031F
- Figure 151. China Artificial Tears Market Share (%), By Formulation, 2017-2031F
- Figure 152. China Artificial Tears Market Share (%), By Distribution Channel, 2017-2031F
- Figure 153. Japan Artificial Tears Market, By Value, In USD Billion, 2017-2031F
- Figure 154. Japan Artificial Tears Market, By Volume, In Thousand Units, 2017-2031F
- Figure 155. Japan Artificial Tears Market Share (%), By Product, 2017-2031F
- Figure 156. Japan Artificial Tears Market Share (%), By Dosage Form, 2017-2031F
- Figure 157. Japan Artificial Tears Market Share (%), By Indication, 2017-2031F
- Figure 158. Japan Artificial Tears Market Share (%), By Formulation, 2017-2031F
- Figure 159. Japan Artificial Tears Market Share (%), By Distribution Channel, 2017-2031F
- Figure 160. Australia Artificial Tears Market, By Value, In USD Billion, 2017-2031F
- Figure 161. Australia Artificial Tears Market, By Volume, In Thousand Units, 2017-2031F
- Figure 162. Australia Artificial Tears Market Share (%), By Product, 2017-2031F
- Figure 163. Australia Artificial Tears Market Share (%), By Dosage Form, 2017-2031F
- Figure 164. Australia Artificial Tears Market Share (%), By Indication, 2017-2031F
- Figure 165. Australia Artificial Tears Market Share (%), By Formulation, 2017-2031F
- Figure 166. Australia Artificial Tears Market Share (%), By Distribution Channel, 2017-2031F
- Figure 167. Vietnam Artificial Tears Market, By Value, In USD Billion, 2017-2031F
- Figure 168. Vietnam Artificial Tears Market, By Volume, In Thousand Units, 2017-2031F
- Figure 169. Vietnam Artificial Tears Market Share (%), By Product, 2017-2031F
- Figure 170. Vietnam Artificial Tears Market Share (%), By Dosage Form, 2017-2031F
- Figure 171. Vietnam Artificial Tears Market Share (%), By Indication, 2017-2031F
- Figure 172. Vietnam Artificial Tears Market Share (%), By Formulation, 2017-2031F
- Figure 173. Vietnam Artificial Tears Market Share (%), By Distribution Channel, 2017-2031F
- Figure 174. South Korea Artificial Tears Market, By Value, In USD Billion, 2017-2031F
- Figure 175. South Korea Artificial Tears Market, By Volume, In Thousand Units, 2017-2031F
- Figure 176. South Korea Artificial Tears Market Share (%), By Product, 2017-2031F
- Figure 177. South Korea Artificial Tears Market Share (%), By Dosage Form, 2017-2031F
- Figure 178. South Korea Artificial Tears Market Share (%), By Indication, 2017-2031F
- Figure 179. South Korea Artificial Tears Market Share (%), By Formulation, 2017-2031F
- Figure 180. South Korea Artificial Tears Market Share (%), By Distribution Channel, 2017-2031F
- Figure 181. Indonesia Artificial Tears Market, By Value, In USD Billion, 2017-2031F
- Figure 182. Indonesia Artificial Tears Market, By Volume, In Thousand Units, 2017-2031F
- Figure 183. Indonesia Artificial Tears Market Share (%), By Product, 2017-2031F
- Figure 184. Indonesia Artificial Tears Market Share (%), By Dosage Form, 2017-2031F
- Figure 185. Indonesia Artificial Tears Market Share (%), By Indication, 2017-2031F
- Figure 186. Indonesia Artificial Tears Market Share (%), By Formulation, 2017-2031F
- Figure 187. Indonesia Artificial Tears Market Share (%), By Distribution Channel, 2017-2031F
- Figure 188. Philippines Artificial Tears Market, By Value, In USD Billion, 2017-2031F
- Figure 189. Philippines Artificial Tears Market, By Volume, In Thousand Units, 2017-2031F
- Figure 190. Philippines Artificial Tears Market Share (%), By Product, 2017-2031F
- Figure 191. Philippines Artificial Tears Market Share (%), By Dosage Form, 2017-2031F
- Figure 192. Philippines Artificial Tears Market Share (%), By Indication, 2017-2031F
- Figure 193. Philippines Artificial Tears Market Share (%), By Formulation, 2017-2031F
- Figure 194. Philippines Artificial Tears Market Share (%), By Distribution Channel, 2017-2031F
- Figure 195. Middle East & Africa Artificial Tears Market, By Value, In USD Billion, 2017-2031F
- Figure 196. Middle East & Africa Artificial Tears Market, By Volume, In Thousand Units, 2017-2031F
- Figure 197. Middle East & Africa Artificial Tears Market Share (%), By Product, 2017-2031F
- Figure 198. Middle East & Africa Artificial Tears Market Share (%), By Dosage Form, 2017-2031F
- Figure 199. Middle East & Africa Artificial Tears Market Share (%), By Indication, 2017-2031F
- Figure 200. Middle East & Africa Artificial Tears Market Share (%), By Formulation, 2017-2031F
- Figure 201. Middle East & Africa Artificial Tears Market Share (%), By Distribution Channel, 2017-2031F
- Figure 202. Middle East & Africa Artificial Tears Market Share (%), By Country, 2017-2031F
- Figure 203. Saudi Arabia Artificial Tears Market, By Value, In USD Billion, 2017-2031F
- Figure 204. Saudi Arabia Artificial Tears Market, By Volume, In Thousand Units, 2017-2031F
- Figure 205. Saudi Arabia Artificial Tears Market Share (%), By Product, 2017-2031F
- Figure 206. Saudi Arabia Artificial Tears Market Share (%), By Dosage Form, 2017-2031F
- Figure 207. Saudi Arabia Artificial Tears Market Share (%), By Indication, 2017-2031F
- Figure 208. Saudi Arabia Artificial Tears Market Share (%), By Formulation, 2017-2031F
- Figure 209. Saudi Arabia Artificial Tears Market Share (%), By Distribution Channel, 2017-2031F
- Figure 210. UAE Artificial Tears Market, By Value, In USD Billion, 2017-2031F
- Figure 211. UAE Artificial Tears Market, By Volume, In Thousand Units, 2017-2031F
- Figure 212. UAE Artificial Tears Market Share (%), By Product, 2017-2031F
- Figure 213. UAE Artificial Tears Market Share (%), By Dosage Form, 2017-2031F
- Figure 214. UAE Artificial Tears Market Share (%), By Indication, 2017-2031F
- Figure 215. UAE Artificial Tears Market Share (%), By Formulation, 2017-2031F
- Figure 216. UAE Artificial Tears Market Share (%), By Distribution Channel, 2017-2031F
- Figure 217. South Africa Artificial Tears Market, By Value, In USD Billion, 2017-2031F
- Figure 218. South Africa Artificial Tears Market, By Volume, In Thousand Units, 2017-2031F
- Figure 219. South Africa Artificial Tears Market Share (%), By Product, 2017-2031F
- Figure 220. South Africa Artificial Tears Market Share (%), By Dosage Form, 2017-2031F
- Figure 221. South Africa Artificial Tears Market Share (%), By Indication, 2017-2031F
- Figure 222. South Africa Artificial Tears Market Share (%), By Formulation, 2017-2031F
- Figure 223. South Africa Artificial Tears Market Share (%), By Distribution Channel, 2017-2031F
- Figure 224. By Product Map-Market Size (USD Billion) & Growth Rate (%), 2023
- Figure 225. By Dosage Form Map-Market Size (USD Billion) & Growth Rate (%), 2023
- Figure 226. By Indication Map-Market Size (USD Billion) & Growth Rate (%), 2023
- Figure 227. By Formulation Map-Market Size (USD Billion) & Growth Rate (%), 2023
- Figure 228. By Distribution Channel Map-Market Size (USD Billion) & Growth Rate (%), 2023
- Figure 229. By Region Map-Market Size (USD Billion) & Growth Rate (%), 2023
Global artificial tears market size was valued at USD 3.27 billion in 2023, which is expected to reach USD 5.26 billion in 2031, with a CAGR of 6.14% for the forecast period between 2024 and 2031F. The growth of global artificial tears market stems from various elements such as rising incidence of dry eye syndrome influenced by age, prolonged screen exposure, and environmental factors. Moreover, advancements in eye care technology and a progressively aging population prone to dry eye problems significantly propel the expansion of global artificial tears market. Furthermore, changes in lifestyle and heightened awareness regarding eye health play pivotal roles in fostering market growth.
The growth of the global artificial tears market finds its foundation in many factors. Surging prevalence of dry eye syndrome is a pivotal driver behind the upward momentum of global artificial tears market. The increase is notably influenced by diverse elements, encompassing an aging population, prolonged exposure to screens, and environmental circumstances. Advancing age heightens susceptibility to dry eye issues due to alterations in tear production and composition. Similarly, extended screen usage, like computers and smartphones, contributes to eye strain and dryness. Moreover, factors such as pollution and arid climates compound these challenges, further amplifying the demand for artificial tear remedies.
Advancements in eye care technologies significantly propel the expansion of the global artificial tears market. Consistently evolving treatments and therapies present more efficient and tailored approaches to tackle dry eye conditions. Additionally, the ongoing global demographic shift towards an older population substantially contributes to the market growth. As individuals age, the probability of encountering dry eye symptoms surges, escalating the need for artificial tears. Furthermore, evolving lifestyles and heightened awareness regarding eye health play a pivotal role in nurturing the market's trajectory. With increased emphasis on preventive healthcare practices, people actively seek solutions for dry eye discomfort, contributing to sustained market expansion. The intricate interplay of factors collectively propels the upward trajectory of the global artificial tears market.
Rising Incidence of Dry Eye Syndrome
The significant increase in dry eye syndrome prevalence is a primary force driving the rapid expansion of the global artificial tears market. An increase in dry eye instances results from various influences, including an aging population, extended screen usage, and environmental factors. Age-related physiological changes render individuals more susceptible to dry eye issues due to shifts in tear production.
Simultaneously, prolonged screen exposure from devices like computers and smartphones contributes substantially to eye strain and subsequent dryness. Environmental elements such as pollution and dry climates also exacerbate these concerns, amplifying the demand for artificial tear solutions. The rising prevalence of dry eye syndrome is a pivotal catalyst, stimulating continuous advancements and innovations in artificial tear formulations and therapies. These advancements address the expanding needs of individuals seeking relief from widespread ocular conditions.
Technological Advancements
Technological progressiveness acts as a catalyst, propelling the global artificial tears market. Ongoing innovations in eye care technologies consistently produce more efficient and specialized remedies for managing dry eye issues. These breakthroughs transform treatment approaches by presenting enhanced formulations, accurate delivery systems, and improved diagnostic instruments. Advanced technologies facilitate the creation of tailored artificial tear formulations, enhancing effectiveness and comfort for individual patient requirements. The advancements help to widen the market and elevate the standards of artificial tear products, fulfilling the evolving needs of those seeking relief from dry eye symptoms.
For instance, in May 2023, Entod Pharmaceuticals, a research-based Ophthalmic, ENT & Dermatology Pharmaceutical Company, announced the launch of Cyclotears, an eye drop, in India and its various global markets. Based on self-emulsifying drug delivery system (SEDDS) technology, the eye drops are used for patients with inflammatory dry eye disease (DED). The company hails it as the first dry eye therapy in the world that incorporates SEDDS technology.
Government Initiatives
Around the globe, governments are actively launching diverse strategies to strengthen the global artificial tears market. These strategies involve financing research initiatives to progress eye health solutions and stimulate advancements in treatments for ocular conditions. Furthermore, regulatory bodies are adopting favorable policies to expedite the authorization of new artificial tear formulas, fostering market development. Partnerships between public health sectors and industry players drive awareness initiatives, educating people about eye health, and available remedies for ailments such as dry eyes. These combined efforts propel market growth and underscore the importance of ocular health in worldwide public healthcare priorities. For example, the Karnataka State Health Department and the National Programme for Control of Blindness collaborated to create Asha Kirana - Eye Care at Your Doorstep - a groundbreaking program in the Chickballapur area in September 2023. The districts of Kalaburagi, Haveri, and Chamarajanagar are now included in this scheme. The program is an essential first step in closing the accessibility gap for eye health.
Artificial Tears for Dry Eye Disease
The extensive use of artificial tears to address dry eye disease significantly propels the thriving global artificial tears market. As dry eye cases escalate globally, there's an increased quest for viable solutions. Artificial tears promptly soothe discomfort by moisturizing and lubricating the eyes, easing dryness. Furthermore, the ease of access and convenience of these over-the-counter remedies greatly contribute to their widespread acceptance. As people increasingly seek relief from dry eye symptoms, the artificial tears market expands, meeting the growing demands of a diverse population affected by the widespread eye condition.
For example, Bausch + Lomb, an American Canadian eye health products company, in September 2023, announced the commercial launch of Miebo, an ophthalmic solution containing perfluorohexyl octane that is intended to treat dry eye symptoms by addressing tear evaporation directly. Miebo is a prescription eye drop with just one ingredient that distributes easily and fast, minimizing tear evaporation at the ocular surface. It is free of water, preservatives, and steroids.
Growing Demand for Glycerin Tears
The global artificial tears market is experiencing a rise in the request for glycerin-infused variants. Heightened demand arises from the exceptional moisturizing qualities inherent in glycerin, which is particularly beneficial for managing dry eyes. Glycerin-based tears emulate the eye's natural tear film, ensuring prolonged hydration and proficiently relieving discomfort. The increasing preference for these artificial tears is driven by their ability to effectively sustain ocular moisture levels, presenting a comprehensive solution for dryness. As individuals actively pursue dependable remedies for dry eye symptoms, the distinct attributes of glycerin-based tears position them prominently, fueling their amplified adoption in the global artificial tears market.
For instance, in March 2023, Avenova Pharmaceuticals, Inc. and Eyeganics announced a collaboration to market OTC Organic Tears (0.2% organic glycerin) via Avenova's physician-dispensed channel and on Avenova.com. Organic Tears is a lubricating eye drop approved by the USDA as 100% organic and devoid of preservatives, it contains neither artificial chemicals nor additions. Compared to other preservative-free artificial tears found in single-use vials, Organic Tears are more affordable and convenient due to their breakthrough technology that dispenses more than 250 drops in each bottle of 10 ml quantity of product, available for USD 29.
Future Market Scenario
The prospects for the global artificial tears market are notably optimistic, driven by several key elements. Increasing prevalence of conditions like dry eye syndrome, linked to factors such as aging populations and heightened screen usage, continue to broaden the market's reach. Additionally, ongoing advancements in eye care technologies hold the promise of novel formulations and delivery methods, enhancing the effectiveness of artificial tear remedies. Moreover, increasing awareness regarding ocular health and the availability of easily accessible over-the-counter artificial tears propel market expansion.
Furthermore, the pursuit of improved formulations, including preservative-free variants and those tailored for specific dry eye variations, fosters market growth and diversification. The evolution caters to the changing requirements of a broader demographic seeking relief from dry eye discomfort, ensuring sustained growth and ongoing innovation in the artificial tears market.
Key Players Landscape and Outlook
The top firms in global artificial tears market are actively engaging in merger and acquisition tactics. These initiatives encompass larger corporations collaborating or buying smaller enterprises to diversify their product ranges, bolster research potential, and extend market presence. These strategic maneuvers facilitate entry to innovative technologies and various products, cultivating competitive edges. Moreover, mergers and acquisitions allow companies to fortify their standings, leverage synergies, and streamline operations, reinforcing their positions in the ever-evolving artificial tears sector.
For example, in July 2023, Bausch acquired Johnson & Johnson Vision's Blink product line of eye and contact lens drops + Lomb Corporation, a renowned worldwide eye health firm committed to enabling people to see better to live better. The company's ongoing efforts to improve consumer convenience for over-the-counter (OTC) eye care is exemplified by this strategic purchase. With the addition of Blink, the company's extensive portfolio of over-the-counter eye care brands has expanded, giving consumers and eye care professionals even more options.
Table of Contents
1. Research Methodology
2. Project Scope & Definitions
3. Executive Summary
4. Global Artificial Tears Market Outlook, 2017-2031F
- 4.1. Market Size & Forecast
- 4.1.1. Value
- 4.1.2. Volume
- 4.2. By Product
- 4.2.1. Sodium Hyaluronate Based Artificial Tears
- 4.2.2. Polyethylene Glycol-based Tears
- 4.2.3. Propylene Glycol-based Tears
- 4.2.4. Oil-based Emulsion Tears
- 4.2.5. Cellulose Tears
- 4.2.6. Glycerin Tears
- 4.3. By Dosage Form
- 4.3.1. Solution
- 4.3.2. Emulsion
- 4.3.3. Ointment
- 4.3.4. Spray
- 4.3.5. Gel
- 4.3.6. Suspensions
- 4.4. By Indication
- 4.4.1. Dry Eye Syndrome
- 4.4.2. Infections
- 4.4.3. Allergies
- 4.4.4. Contact Lens Moisture Retention
- 4.4.5. UV & Blue Light Protection
- 4.4.6. Others
- 4.5. By Formulation
- 4.5.1. Preservative Based
- 4.5.2. Non-Preservative Based
- 4.6. By Distribution Channel
- 4.6.1. Hospital Pharmacies
- 4.6.2. Retail Pharmacies
- 4.6.3. Ophthalmic Pharmacies
- 4.6.4. Online Pharmacies
- 4.7. By Region
- 4.7.1. North America
- 4.7.2. Europe
- 4.7.3. South America
- 4.7.4. Asia-Pacific
- 4.7.5. Middle East and Africa
- 4.8. By Company Market Share (%), 2023
5. Global Artificial Tears Market Outlook, By Region, 2017-2031F
- 5.1. North America*
- 5.1.1. Market Size & Forecast
- 5.1.1.1. Value
- 5.1.1.2. Volume
- 5.1.2. By Product
- 5.1.2.1. Sodium Hyaluronate Based Artificial Tears
- 5.1.2.2. Polyethylene Glycol-based Tears
- 5.1.2.3. Propylene Glycol-based Tears
- 5.1.2.4. Oil-based Emulsion Tears
- 5.1.2.5. Cellulose Tears
- 5.1.2.6. Glycerin Tears
- 5.1.3. By Dosage Form
- 5.1.3.1. Solution
- 5.1.3.2. Emulsion
- 5.1.3.3. Ointment
- 5.1.3.4. Spray
- 5.1.3.5. Gel
- 5.1.3.6. Suspensions
- 5.1.4. By Indication
- 5.1.4.1. Dry Eye Syndrome
- 5.1.4.2. Infections
- 5.1.4.3. Allergies
- 5.1.4.4. Contact Lens Moisture Retention
- 5.1.4.5. UV & Blue Light Protection
- 5.1.4.6. Others
- 5.1.5. By Formulation
- 5.1.5.1. Preservative Based
- 5.1.5.2. Non-Preservative Based
- 5.1.6. By Distribution Channel
- 5.1.6.1. Hospital Pharmacies
- 5.1.6.2. Retail Pharmacies
- 5.1.6.3. Ophthalmic Pharmacies
- 5.1.6.4. Online Pharmacies
- 5.1.7. United States*
- 5.1.7.1. Market Size & Forecast
- 5.1.7.1.1. Value
- 5.1.7.1.2. Volume
- 5.1.7.2. By Product
- 5.1.7.2.1. Sodium Hyaluronate Based Artificial Tears
- 5.1.7.2.2. Polyethylene Glycol-based Tears
- 5.1.7.2.3. Propylene Glycol-based Tears
- 5.1.7.2.4. Oil-based Emulsion Tears
- 5.1.7.2.5. Cellulose Tears
- 5.1.7.2.6. Glycerin Tears
- 5.1.7.3. By Dosage Form
- 5.1.7.3.1. Solution
- 5.1.7.3.2. Emulsion
- 5.1.7.3.3. Ointment
- 5.1.7.3.4. Spray
- 5.1.7.3.5. Gel
- 5.1.7.3.6. Suspensions
- 5.1.7.4. By Indication
- 5.1.7.4.1. Dry Eye Syndrome
- 5.1.7.4.2. Infections
- 5.1.7.4.3. Allergies
- 5.1.7.4.4. Contact Lens Moisture Retention
- 5.1.7.4.5. UV & Blue Light Protection
- 5.1.7.4.6. Others
- 5.1.7.5. By Formulation
- 5.1.7.5.1. Preservative Based
- 5.1.7.5.2. Non-Preservative Based
- 5.1.7.6. By Distribution Channel
- 5.1.7.6.1. Hospital Pharmacies
- 5.1.7.6.2. Retail Pharmacies
- 5.1.7.6.3. Ophthalmic Pharmacies
- 5.1.7.6.4. Online Pharmacies
- 5.1.8. Canada
- 5.1.9. Mexico
- 5.1.1. Market Size & Forecast
All segments will be provided for all regions and countries covered:
- 5.2. Europe
- 5.2.1 Germany
- 5.2.2 France
- 5.2.3 Italy
- 5.2.4 United Kingdom
- 5.2.5 Russia
- 5.2.6 Netherlands
- 5.2.7 Spain
- 5.2.8 Turkey
- 5.2.9 Poland
- 5.3. South America
- 5.3.1. Brazil
- 5.3.2. Argentina
- 5.4. Asia-Pacific
- 5.4.1. India
- 5.4.2. China
- 5.4.3. Japan
- 5.4.4. Australia
- 5.4.5. Vietnam
- 5.4.6. South Korea
- 5.4.7. Indonesia
- 5.4.8. Philippines
- 5.5. Middle East & Africa
- 5.5.1. Saudi Arabia
- 5.5.2. UAE
- 5.5.3. South Africa
6. Market Mapping, 2023
- 6.1. By Product
- 6.2. By Dosage Form
- 6.3. By Indication
- 6.4. By Formulation
- 6.5. By Distribution Channel
- 6.6. By Region
7. Macro Environment and Industry Structure
- 7.1. Supply Demand Analysis
- 7.2. Import Export Analysis
- 7.3. Value Chain Analysis
- 7.4. PESTEL Analysis
- 7.4.1. Political Factors
- 7.4.2. Economic System
- 7.4.3. Social Implications
- 7.4.4. Technological Advancements
- 7.4.5. Environmental Impacts
- 7.4.6. Legal Compliances and Regulatory Policies (Statutory Bodies Included)
- 7.5. Porter's Five Forces Analysis
- 7.5.1. Supplier Power
- 7.5.2. Buyer Power
- 7.5.3. Substitution Threat
- 7.5.4. Threat from New Entrant
- 7.5.5. Competitive Rivalry
8. Market Dynamics
- 8.1. Growth Drivers
- 8.2. Growth Inhibitors (Challenges and Restraints)
9. Regulatory Framework and Innovation
- 9.1. Clinical Trials
- 9.2. Patent Landscape
- 9.3. Regulatory Approvals
- 9.4. Innovations/Emerging Technologies
10. Key Players Landscape
- 10.1. Competition Matrix of Top Five Market Leaders
- 10.2. Market Revenue Analysis of Top Five Market Leaders (in %, 2023)
- 10.3. Mergers and Acquisitions/Joint Ventures (If Applicable)
- 10.4. SWOT Analysis (For Five Market Players)
- 10.5. Patent Analysis (If Applicable)
11. Pricing Analysis
12. Case Studies
13. Key Players Outlook
- 13.1. Johnson & Johnson Services, Inc.
- 13.1.1. Company Details
- 13.1.2. Key Management Personnel
- 13.1.3. Products & Services
- 13.1.4. Financials (As reported)
- 13.1.5. Key Market Focus & Geographical Presence
- 13.1.6. Recent Developments
- 13.2. Bausch & Lomb Incorporated
- 13.3. AbbVie Inc.
- 13.4. Alimera Sciences, Inc.
- 13.5. Sun Pharmaceutical Industries Limited
- 13.6. Akorn Operating Company LLC
- 13.7. Alcon Laboratories Inc.
- 13.8. OCuSOFT Inc.
- 13.9. Santen Pharmaceutical Co., Ltd.
- 13.10. Similasan AG
- 13.11. Ursapharm Arzneimittel GmbH
- 13.12. Allergan plc
Companies mentioned above DO NOT hold any order as per market share and can be changed as per information available during research work.

