|
|
市場調査レポート
商品コード
1702010
関節再建デバイス市場:技術別、関節タイプ別、エンドユーザー別、地域別、2025-2033年Joint Reconstruction Devices Market Report by Technique, Joint Type, End User (Hospitals, Orthopedic Clinics, Ambulatory Surgical Centers, and Others), and Region 2025-2033 |
||||||

|
|||||||
カスタマイズ可能
|
|||||||


| 関節再建デバイス市場:技術別、関節タイプ別、エンドユーザー別、地域別、2025-2033年 |
|
出版日: 2025年04月01日
発行: IMARC
ページ情報: 英文 141 Pages
納期: 2~3営業日
|

全表示
- 概要
- 図表
- 目次
関節再建デバイス市場の世界市場規模は2024年に287億米ドルに達しました。今後、IMARC Groupは、市場は2033年までに427億米ドルに達し、2025~2033年の成長率(CAGR)は4.51%になると予測しています。
関節再建デバイスは主に、関節の動きを回復させたり、関節を一時的または永続的に構造的に支えたり、組織の再建を助けたりするために設計されています。これらの器具は、肩関節、股関節、膝関節の全部または一部を置換するものとして、単独で、あるいは1つ以上の埋め込み型医療器具とともに利用されます。今日では、座りっぱなしのライフスタイルや不健康な食生活のために、変形性関節症(OA)のような関節障害が広く蔓延しています。これは、世界中で関節再建デバイスの需要にプラスの影響を与えています。
関節再建デバイス市場傾向:
世界中で老年人口が増加していることは、市場の成長を刺激する重要な要因のひとつです。さらに、3Dプリンティング、ロボット工学、拡張現実(AR)などの先進的な新技術の登場により、関節再建がより安全で正確かつ効率的になりつつあります。3Dプリンティングは、複雑な外科手術の計画とシミュレーションのために、カスタマイズされた生体モデル(患者の解剖学的構造のレプリカ)、器具、インプラントの作成にますます使用されるようになっています。この技術は、感染症や以前の人工関節の故障に伴う人工関節置換術を容易にします。これに加えて、ロボット支援手術は、コンポーネントの位置決めの強化、軟部組織の緊張とバランスに関するリアルタイムの情報、股関節の長さとオフセットの回復を提供するため、人工股関節置換術や人工膝関節置換術の革新的な方法として台頭してきています。このことは、骨折や脱臼の原因となる事故やスポーツ関連の怪我の増加と相まって、市場の成長を強めています。これとは別に、足関節炎の外科的管理のために足関節全置換術(TAR)や脛骨動脈関節置換術(TTA)を必要とする人の数も増加しており、これが市場を牽引すると予測されています。
本レポートで扱う主な質問
- 2024年の世界の関節再建デバイス市場の市場規模は?
- 2025-2033年の世界の関節再建デバイス市場の予想成長率は?
- 世界の関節再建デバイス市場を牽引する主要因は何か?
- 世界の関節再建デバイス市場に対するCOVID-19の影響は?
- 世界の関節再建デバイス市場の技術別内訳は?
- 世界の関節再建デバイス市場の関節タイプ別の内訳は?
- 世界の関節再建デバイス市場における主要地域は?
- 世界の関節再建デバイス市場における主要プレーヤー/企業は?
目次
第1章 序文
第2章 調査範囲と調査手法
- 調査の目的
- ステークホルダー
- データソース
- 一次情報
- 二次情報
- 市場推定
- ボトムアップアプローチ
- トップダウンアプローチ
- 調査手法
第3章 エグゼクティブサマリー
第4章 イントロダクション
- 概要
- 主要業界動向
第5章 世界の関節再建デバイス市場
- 市場概要
- 市場実績
- COVID-19の影響
- 市場予測
第6章 市場内訳:技術別
- 関節置換
- 主要セグメント
- インプラント
- 骨移植
- 主要セグメント
- 骨切り術
- 関節鏡
- 表面再建術
- 関節固定術
- その他
第7章 市場内訳:関節タイプ別
- 膝関節
- 股関節
- 肩関節
- 足関節
- その他
第8章 市場内訳:エンドユーザー別
- 病院
- 整形外科クリニック
- 外来手術センター(ASC)
- その他
第9章 市場内訳:地域別
- 北米
- 米国
- カナダ
- アジア太平洋地域
- 中国
- 日本
- インド
- 韓国
- オーストラリア
- インドネシア
- その他
- 欧州
- ドイツ
- フランス
- 英国
- イタリア
- スペイン
- ロシア
- その他
- ラテンアメリカ
- ブラジル
- メキシコ
- その他
- 中東・アフリカ
- 市場内訳:国別
第10章 SWOT分析
- 概要
- 強み
- 弱み
- 機会
- 脅威
第11章 バリューチェーン分析
第12章 ポーターのファイブフォース分析
- 概要
- 買い手の交渉力
- 供給企業の交渉力
- 競合の程度
- 新規参入業者の脅威
- 代替品の脅威
第13章 価格分析
第14章 競合情勢
- 市場構造
- 主要企業
- 主要企業のプロファイル
- Aesculap Inc.(B. Braun Melsungen AG)
- Conformis Inc.
- Conmed Corporation
- DJO Global Inc.(Enovis Corporation)
- Exactech Inc.
- Johnson & Johnson Services Inc
- Kyocera Medical Technologies Inc.(Kyocera Corporation)
- Medacta International SA
- Smith & Nephew plc
- Stryker Corporation
- Zimmer Biomet
List of Figures
- Figure 1: Global: Joint Reconstruction Devices Market: Major Drivers and Challenges
- Figure 2: Global: Joint Reconstruction Devices Market: Sales Value (in Billion USD), 2019-2024
- Figure 3: Global: Joint Reconstruction Devices Market Forecast: Sales Value (in Billion USD), 2025-2033
- Figure 4: Global: Joint Reconstruction Devices Market: Breakup by Technique (in %), 2024
- Figure 5: Global: Joint Reconstruction Devices Market: Breakup by Joint Type (in %), 2024
- Figure 6: Global: Joint Reconstruction Devices Market: Breakup by End User (in %), 2024
- Figure 7: Global: Joint Reconstruction Devices Market: Breakup by Region (in %), 2024
- Figure 8: Global: Joint Reconstruction Devices (Joint Replacement) Market: Sales Value (in Million USD), 2019 & 2024
- Figure 9: Global: Joint Reconstruction Devices (Joint Replacement) Market Forecast: Sales Value (in Million USD), 2025-2033
- Figure 10: Global: Joint Reconstruction Devices (Osteotomy) Market: Sales Value (in Million USD), 2019 & 2024
- Figure 11: Global: Joint Reconstruction Devices (Osteotomy) Market Forecast: Sales Value (in Million USD), 2025-2033
- Figure 12: Global: Joint Reconstruction Devices (Arthroscopy) Market: Sales Value (in Million USD), 2019 & 2024
- Figure 13: Global: Joint Reconstruction Devices (Arthroscopy) Market Forecast: Sales Value (in Million USD), 2025-2033
- Figure 14: Global: Joint Reconstruction Devices (Resurfacing) Market: Sales Value (in Million USD), 2019 & 2024
- Figure 15: Global: Joint Reconstruction Devices (Resurfacing) Market Forecast: Sales Value (in Million USD), 2025-2033
- Figure 16: Global: Joint Reconstruction Devices (Arthrodesis) Market: Sales Value (in Million USD), 2019 & 2024
- Figure 17: Global: Joint Reconstruction Devices (Arthrodesis) Market Forecast: Sales Value (in Million USD), 2025-2033
- Figure 18: Global: Joint Reconstruction Devices (Other Techniques) Market: Sales Value (in Million USD), 2019 & 2024
- Figure 19: Global: Joint Reconstruction Devices (Other Techniques) Market Forecast: Sales Value (in Million USD), 2025-2033
- Figure 20: Global: Joint Reconstruction Devices (Knee) Market: Sales Value (in Million USD), 2019 & 2024
- Figure 21: Global: Joint Reconstruction Devices (Knee) Market Forecast: Sales Value (in Million USD), 2025-2033
- Figure 22: Global: Joint Reconstruction Devices (Hip) Market: Sales Value (in Million USD), 2019 & 2024
- Figure 23: Global: Joint Reconstruction Devices (Hip) Market Forecast: Sales Value (in Million USD), 2025-2033
- Figure 24: Global: Joint Reconstruction Devices (Shoulder) Market: Sales Value (in Million USD), 2019 & 2024
- Figure 25: Global: Joint Reconstruction Devices (Shoulder) Market Forecast: Sales Value (in Million USD), 2025-2033
- Figure 26: Global: Joint Reconstruction Devices (Ankle) Market: Sales Value (in Million USD), 2019 & 2024
- Figure 27: Global: Joint Reconstruction Devices (Ankle) Market Forecast: Sales Value (in Million USD), 2025-2033
- Figure 28: Global: Joint Reconstruction Devices (Other Joint Types) Market: Sales Value (in Million USD), 2019 & 2024
- Figure 29: Global: Joint Reconstruction Devices (Other Joint Types) Market Forecast: Sales Value (in Million USD), 2025-2033
- Figure 30: Global: Joint Reconstruction Devices (Hospitals) Market: Sales Value (in Million USD), 2019 & 2024
- Figure 31: Global: Joint Reconstruction Devices (Hospitals) Market Forecast: Sales Value (in Million USD), 2025-2033
- Figure 32: Global: Joint Reconstruction Devices (Orthopedic Clinics) Market: Sales Value (in Million USD), 2019 & 2024
- Figure 33: Global: Joint Reconstruction Devices (Orthopedic Clinics) Market Forecast: Sales Value (in Million USD), 2025-2033
- Figure 34: Global: Joint Reconstruction Devices (Ambulatory Surgical Centers (ASCs)) Market: Sales Value (in Million USD), 2019 & 2024
- Figure 35: Global: Joint Reconstruction Devices (Ambulatory Surgical Centers (ASCs)) Market Forecast: Sales Value (in Million USD), 2025-2033
- Figure 36: Global: Joint Reconstruction Devices (Other End Users) Market: Sales Value (in Million USD), 2019 & 2024
- Figure 37: Global: Joint Reconstruction Devices (Other End Users) Market Forecast: Sales Value (in Million USD), 2025-2033
- Figure 38: North America: Joint Reconstruction Devices Market: Sales Value (in Million USD), 2019 & 2024
- Figure 39: North America: Joint Reconstruction Devices Market Forecast: Sales Value (in Million USD), 2025-2033
- Figure 40: United States: Joint Reconstruction Devices Market: Sales Value (in Million USD), 2019 & 2024
- Figure 41: United States: Joint Reconstruction Devices Market Forecast: Sales Value (in Million USD), 2025-2033
- Figure 42: Canada: Joint Reconstruction Devices Market: Sales Value (in Million USD), 2019 & 2024
- Figure 43: Canada: Joint Reconstruction Devices Market Forecast: Sales Value (in Million USD), 2025-2033
- Figure 44: Asia-Pacific: Joint Reconstruction Devices Market: Sales Value (in Million USD), 2019 & 2024
- Figure 45: Asia-Pacific: Joint Reconstruction Devices Market Forecast: Sales Value (in Million USD), 2025-2033
- Figure 46: China: Joint Reconstruction Devices Market: Sales Value (in Million USD), 2019 & 2024
- Figure 47: China: Joint Reconstruction Devices Market Forecast: Sales Value (in Million USD), 2025-2033
- Figure 48: Japan: Joint Reconstruction Devices Market: Sales Value (in Million USD), 2019 & 2024
- Figure 49: Japan: Joint Reconstruction Devices Market Forecast: Sales Value (in Million USD), 2025-2033
- Figure 50: India: Joint Reconstruction Devices Market: Sales Value (in Million USD), 2019 & 2024
- Figure 51: India: Joint Reconstruction Devices Market Forecast: Sales Value (in Million USD), 2025-2033
- Figure 52: South Korea: Joint Reconstruction Devices Market: Sales Value (in Million USD), 2019 & 2024
- Figure 53: South Korea: Joint Reconstruction Devices Market Forecast: Sales Value (in Million USD), 2025-2033
- Figure 54: Australia: Joint Reconstruction Devices Market: Sales Value (in Million USD), 2019 & 2024
- Figure 55: Australia: Joint Reconstruction Devices Market Forecast: Sales Value (in Million USD), 2025-2033
- Figure 56: Indonesia: Joint Reconstruction Devices Market: Sales Value (in Million USD), 2019 & 2024
- Figure 57: Indonesia: Joint Reconstruction Devices Market Forecast: Sales Value (in Million USD), 2025-2033
- Figure 58: Others: Joint Reconstruction Devices Market: Sales Value (in Million USD), 2019 & 2024
- Figure 59: Others: Joint Reconstruction Devices Market Forecast: Sales Value (in Million USD), 2025-2033
- Figure 60: Europe: Joint Reconstruction Devices Market: Sales Value (in Million USD), 2019 & 2024
- Figure 61: Europe: Joint Reconstruction Devices Market Forecast: Sales Value (in Million USD), 2025-2033
- Figure 62: Germany: Joint Reconstruction Devices Market: Sales Value (in Million USD), 2019 & 2024
- Figure 63: Germany: Joint Reconstruction Devices Market Forecast: Sales Value (in Million USD), 2025-2033
- Figure 64: France: Joint Reconstruction Devices Market: Sales Value (in Million USD), 2019 & 2024
- Figure 65: France: Joint Reconstruction Devices Market Forecast: Sales Value (in Million USD), 2025-2033
- Figure 66: United Kingdom: Joint Reconstruction Devices Market: Sales Value (in Million USD), 2019 & 2024
- Figure 67: United Kingdom: Joint Reconstruction Devices Market Forecast: Sales Value (in Million USD), 2025-2033
- Figure 68: Italy: Joint Reconstruction Devices Market: Sales Value (in Million USD), 2019 & 2024
- Figure 69: Italy: Joint Reconstruction Devices Market Forecast: Sales Value (in Million USD), 2025-2033
- Figure 70: Spain: Joint Reconstruction Devices Market: Sales Value (in Million USD), 2019 & 2024
- Figure 71: Spain: Joint Reconstruction Devices Market Forecast: Sales Value (in Million USD), 2025-2033
- Figure 72: Russia: Joint Reconstruction Devices Market: Sales Value (in Million USD), 2019 & 2024
- Figure 73: Russia: Joint Reconstruction Devices Market Forecast: Sales Value (in Million USD), 2025-2033
- Figure 74: Others: Joint Reconstruction Devices Market: Sales Value (in Million USD), 2019 & 2024
- Figure 75: Others: Joint Reconstruction Devices Market Forecast: Sales Value (in Million USD), 2025-2033
- Figure 76: Latin America: Joint Reconstruction Devices Market: Sales Value (in Million USD), 2019 & 2024
- Figure 77: Latin America: Joint Reconstruction Devices Market Forecast: Sales Value (in Million USD), 2025-2033
- Figure 78: Brazil: Joint Reconstruction Devices Market: Sales Value (in Million USD), 2019 & 2024
- Figure 79: Brazil: Joint Reconstruction Devices Market Forecast: Sales Value (in Million USD), 2025-2033
- Figure 80: Mexico: Joint Reconstruction Devices Market: Sales Value (in Million USD), 2019 & 2024
- Figure 81: Mexico: Joint Reconstruction Devices Market Forecast: Sales Value (in Million USD), 2025-2033
- Figure 82: Others: Joint Reconstruction Devices Market: Sales Value (in Million USD), 2019 & 2024
- Figure 83: Others: Joint Reconstruction Devices Market Forecast: Sales Value (in Million USD), 2025-2033
- Figure 84: Middle East and Africa: Joint Reconstruction Devices Market: Sales Value (in Million USD), 2019 & 2024
- Figure 85: Middle East and Africa: Joint Reconstruction Devices Market: Breakup by Country (in %), 2024
- Figure 86: Middle East and Africa: Joint Reconstruction Devices Market Forecast: Sales Value (in Million USD), 2025-2033
- Figure 87: Global: Joint Reconstruction Devices Industry: SWOT Analysis
- Figure 88: Global: Joint Reconstruction Devices Industry: Value Chain Analysis
- Figure 89: Global: Joint Reconstruction Devices Industry: Porter's Five Forces Analysis
List of Tables
- Table 1: Global: Joint Reconstruction Devices Market: Key Industry Highlights, 2024 & 2033
- Table 2: Global: Joint Reconstruction Devices Market Forecast: Breakup by Technique (in Million USD), 2025-2033
- Table 3: Global: Joint Reconstruction Devices Market Forecast: Breakup by Joint Type (in Million USD), 2025-2033
- Table 4: Global: Joint Reconstruction Devices Market Forecast: Breakup by End User (in Million USD), 2025-2033
- Table 5: Global: Joint Reconstruction Devices Market Forecast: Breakup by Region (in Million USD), 2025-2033
- Table 6: Global: Joint Reconstruction Devices Market: Competitive Structure
- Table 7: Global: Joint Reconstruction Devices Market: Key Players
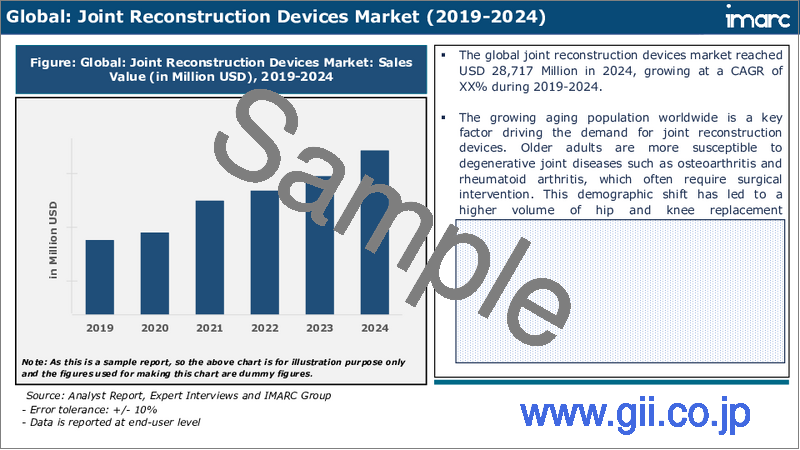
The global joint reconstruction devices market size reached USD 28.7 Billion in 2024. Looking forward, IMARC Group expects the market to reach USD 42.7 Billion by 2033, exhibiting a growth rate (CAGR) of 4.51% during 2025-2033.
Joint reconstruction devices are primarily designed for restoring the movement of joints, providing them with structural support either temporarily or permanently, or aiding in tissue reconstruction. These devices are utilized separately or together with one or more implantable medical devices as a replacement in whole or part for shoulder, hip, or knee joints. Nowadays, joint disorders like osteoarthritis (OA) are widely becoming prevalent on account of sedentary lifestyles and unhealthy dietary patterns of individuals. This is positively influencing the requirement for joint reconstruction devices across the globe.
Joint Reconstruction Devices Market Trends:
The rising geriatric population around the world represents one of the key factors stimulating the growth of the market. Moreover, the advent of advanced, emerging technologies, such as 3D printing, robotics, and augmented reality (AR), are making joint reconstruction safer, more accurate, and efficient. 3D printing is increasingly being used in creating customized bio models (replicas of patient anatomy), devices, and implants to plan and simulate complex surgical procedures. This technology facilitates joint replacements associated with infection or the failure of a previous replacement joint. Besides this, robotic-assisted surgery is emerging as an innovative method for hip and knee arthroplasty as it offers enhanced component positioning, real-time information about soft tissue tensioning and balance, and restoration of hip length and offset. This, coupled with the increasing accidental or sports-related injuries that cause broken bones and dislocations, is strengthening the growth of the market. Apart from this, there is a rise in the number of individuals requiring total ankle replacement (TAR) and tibiotalar arthrodesis (TTA) for the surgical management of ankle arthritis, which is projected to drive the market.
Key Market Segmentation:
Breakup by Technique:
- Joint Replacement
- Implants
- Bone Graft
- Osteotomy
- Arthroscopy
- Resurfacing
- Arthrodesis
- Others
Breakup by Joint Type:
- Knee
- Hip
- Shoulder
- Ankle
- Others
Breakup by End User:
- Hospitals
- Orthopedic Clinics
- Ambulatory Surgical Centers (ASCs)
- Others
Breakup by Region:
- North America
- United States
- Canada
- Asia-Pacific
- China
- Japan
- India
- South Korea
- Australia
- Indonesia
- Others
- Europe
- Germany
- France
- United Kingdom
- Italy
- Spain
- Russia
- Others
- Latin America
- Brazil
- Mexico
- Others
- Middle East and Africa
Competitive Landscape:
The competitive landscape of the industry has also been examined along with the profiles of the key players being Aesculap Inc. (B. Braun Melsungen AG), Conformis Inc., Conmed Corporation, DJO Global Inc. (Enovis Corporation), Exactech Inc., Johnson & Johnson Services Inc, Kyocera Medical Technologies Inc. (Kyocera Corporation), Medacta International SA, Smith & Nephew plc, Stryker Corporation and Zimmer Biomet.
Key Questions Answered in This Report
- 1.What was the size of the global joint reconstruction devices market in 2024?
- 2.What is the expected growth rate of the global joint reconstruction devices market during 2025-2033?
- 3.What are the key factors driving the global joint reconstruction devices market?
- 4.What has been the impact of COVID-19 on the global joint reconstruction devices market?
- 5.What is the breakup of the global joint reconstruction devices market based on the technique?
- 6.What is the breakup of the global joint reconstruction devices market based on the joint type?
- 7.What are the key regions in the global joint reconstruction devices market?
- 8.Who are the key players/companies in the global joint reconstruction devices market?
Table of Contents
1 Preface
2 Scope and Methodology
- 2.1 Objectives of the Study
- 2.2 Stakeholders
- 2.3 Data Sources
- 2.3.1 Primary Sources
- 2.3.2 Secondary Sources
- 2.4 Market Estimation
- 2.4.1 Bottom-Up Approach
- 2.4.2 Top-Down Approach
- 2.5 Forecasting Methodology
3 Executive Summary
4 Introduction
- 4.1 Overview
- 4.2 Key Industry Trends
5 Global Joint Reconstruction Devices Market
- 5.1 Market Overview
- 5.2 Market Performance
- 5.3 Impact of COVID-19
- 5.4 Market Forecast
6 Market Breakup by Technique
- 6.1 Joint Replacement
- 6.1.1 Market Trends
- 6.1.2 Key segments
- 6.1.2.1 Implants
- 6.1.2.2 Bone Graft
- 6.1.3 Market Forecast
- 6.2 Osteotomy
- 6.2.1 Market Trends
- 6.2.2 Market Forecast
- 6.3 Arthroscopy
- 6.3.1 Market Trends
- 6.3.2 Market Forecast
- 6.4 Resurfacing
- 6.4.1 Market Trends
- 6.4.2 Market Forecast
- 6.5 Arthrodesis
- 6.5.1 Market Trends
- 6.5.2 Market Forecast
- 6.6 Others
- 6.6.1 Market Trends
- 6.6.2 Market Forecast
7 Market Breakup by Joint Type
- 7.1 Knee
- 7.1.1 Market Trends
- 7.1.2 Market Forecast
- 7.2 Hip
- 7.2.1 Market Trends
- 7.2.2 Market Forecast
- 7.3 Shoulder
- 7.3.1 Market Trends
- 7.3.2 Market Forecast
- 7.4 Ankle
- 7.4.1 Market Trends
- 7.4.2 Market Forecast
- 7.5 Others
- 7.5.1 Market Trends
- 7.5.2 Market Forecast
8 Market Breakup by End User
- 8.1 Hospitals
- 8.1.1 Market Trends
- 8.1.2 Market Forecast
- 8.2 Orthopedic Clinics
- 8.2.1 Market Trends
- 8.2.2 Market Forecast
- 8.3 Ambulatory Surgical Centers (ASCs)
- 8.3.1 Market Trends
- 8.3.2 Market Forecast
- 8.4 Others
- 8.4.1 Market Trends
- 8.4.2 Market Forecast
9 Market Breakup by Region
- 9.1 North America
- 9.1.1 United States
- 9.1.1.1 Market Trends
- 9.1.1.2 Market Forecast
- 9.1.2 Canada
- 9.1.2.1 Market Trends
- 9.1.2.2 Market Forecast
- 9.1.1 United States
- 9.2 Asia-Pacific
- 9.2.1 China
- 9.2.1.1 Market Trends
- 9.2.1.2 Market Forecast
- 9.2.2 Japan
- 9.2.2.1 Market Trends
- 9.2.2.2 Market Forecast
- 9.2.3 India
- 9.2.3.1 Market Trends
- 9.2.3.2 Market Forecast
- 9.2.4 South Korea
- 9.2.4.1 Market Trends
- 9.2.4.2 Market Forecast
- 9.2.5 Australia
- 9.2.5.1 Market Trends
- 9.2.5.2 Market Forecast
- 9.2.6 Indonesia
- 9.2.6.1 Market Trends
- 9.2.6.2 Market Forecast
- 9.2.7 Others
- 9.2.7.1 Market Trends
- 9.2.7.2 Market Forecast
- 9.2.1 China
- 9.3 Europe
- 9.3.1 Germany
- 9.3.1.1 Market Trends
- 9.3.1.2 Market Forecast
- 9.3.2 France
- 9.3.2.1 Market Trends
- 9.3.2.2 Market Forecast
- 9.3.3 United Kingdom
- 9.3.3.1 Market Trends
- 9.3.3.2 Market Forecast
- 9.3.4 Italy
- 9.3.4.1 Market Trends
- 9.3.4.2 Market Forecast
- 9.3.5 Spain
- 9.3.5.1 Market Trends
- 9.3.5.2 Market Forecast
- 9.3.6 Russia
- 9.3.6.1 Market Trends
- 9.3.6.2 Market Forecast
- 9.3.7 Others
- 9.3.7.1 Market Trends
- 9.3.7.2 Market Forecast
- 9.3.1 Germany
- 9.4 Latin America
- 9.4.1 Brazil
- 9.4.1.1 Market Trends
- 9.4.1.2 Market Forecast
- 9.4.2 Mexico
- 9.4.2.1 Market Trends
- 9.4.2.2 Market Forecast
- 9.4.3 Others
- 9.4.3.1 Market Trends
- 9.4.3.2 Market Forecast
- 9.4.1 Brazil
- 9.5 Middle East and Africa
- 9.5.1 Market Trends
- 9.5.2 Market Breakup by Country
- 9.5.3 Market Forecast
10 SWOT Analysis
- 10.1 Overview
- 10.2 Strengths
- 10.3 Weaknesses
- 10.4 Opportunities
- 10.5 Threats
11 Value Chain Analysis
12 Porters Five Forces Analysis
- 12.1 Overview
- 12.2 Bargaining Power of Buyers
- 12.3 Bargaining Power of Suppliers
- 12.4 Degree of Competition
- 12.5 Threat of New Entrants
- 12.6 Threat of Substitutes
13 Price Analysis
14 Competitive Landscape
- 14.1 Market Structure
- 14.2 Key Players
- 14.3 Profiles of Key Players
- 14.3.1 Aesculap Inc. (B. Braun Melsungen AG)
- 14.3.1.1 Company Overview
- 14.3.1.2 Product Portfolio
- 14.3.2 Conformis Inc.
- 14.3.2.1 Company Overview
- 14.3.2.2 Product Portfolio
- 14.3.2.3 Financials
- 14.3.3 Conmed Corporation
- 14.3.3.1 Company Overview
- 14.3.3.2 Product Portfolio
- 14.3.3.3 Financials
- 14.3.3.4 SWOT Analysis
- 14.3.4 DJO Global Inc. (Enovis Corporation)
- 14.3.4.1 Company Overview
- 14.3.4.2 Product Portfolio
- 14.3.5 Exactech Inc.
- 14.3.5.1 Company Overview
- 14.3.5.2 Product Portfolio
- 14.3.6 Johnson & Johnson Services Inc
- 14.3.6.1 Company Overview
- 14.3.6.2 Product Portfolio
- 14.3.6.3 Financials
- 14.3.6.4 SWOT Analysis
- 14.3.7 Kyocera Medical Technologies Inc. (Kyocera Corporation)
- 14.3.7.1 Company Overview
- 14.3.7.2 Product Portfolio
- 14.3.8 Medacta International SA
- 14.3.8.1 Company Overview
- 14.3.8.2 Product Portfolio
- 14.3.9 Smith & Nephew plc
- 14.3.9.1 Company Overview
- 14.3.9.2 Product Portfolio
- 14.3.9.3 Financials
- 14.3.9.4 SWOT Analysis
- 14.3.10 Stryker Corporation
- 14.3.10.1 Company Overview
- 14.3.10.2 Product Portfolio
- 14.3.10.3 Financials
- 14.3.10.4 SWOT Analysis
- 14.3.11 Zimmer Biomet
- 14.3.11.1 Company Overview
- 14.3.11.2 Product Portfolio
- 14.3.11.3 Financials
- 14.3.11.4 SWOT Analysis
- 14.3.1 Aesculap Inc. (B. Braun Melsungen AG)
