|
|
市場調査レポート
商品コード
1642470
ビジネストラベル市場レポート:タイプ別、目的別、支出別、年齢層別、サービスタイプ別、旅行タイプ別、エンドユーザー別、地域別、2025年~2033年Business Travel Market Report by Type, Purpose Type, Expenditure, Age Group, Service Type, Travel Type, End-User, and Region 2025-2033 |
||||||

|
|||||||
カスタマイズ可能
|
|||||||


| ビジネストラベル市場レポート:タイプ別、目的別、支出別、年齢層別、サービスタイプ別、旅行タイプ別、エンドユーザー別、地域別、2025年~2033年 |
|
出版日: 2025年01月18日
発行: IMARC
ページ情報: 英文 137 Pages
納期: 2~3営業日
|

全表示
- 概要
- 図表
- 目次
世界のビジネストラベル市場の市場規模は2024年に1兆1,000億米ドルに達しました。IMARC Groupは、2025年から2033年にかけての成長率(CAGR)は6.3%で、2033年には2兆米ドルに達すると予測しています。ビジネスの世界化の進展、遠隔コミュニケーションを容易にする技術の進歩、国境を越えた出張を必要とする多国籍企業の台頭、新興市場の重要性の高まり、出張管理ソリューションの進化、柔軟な勤務形態の採用、観光を促進する政府の取り組みなどが、市場成長を促進する要因の一部です。
ビジネストラベルは企業旅行とも呼ばれ、業務目的や事業拡大のために明示的に行われる旅行です。会社の別支店への出張や、サプライヤーやバイヤーとの打ち合わせ、会議やビジネス・イベントのための別拠点への出張などが含まれます。近年、急速に世界化する世界の動向は、クライアントとのミーティング、ブランドや製品のプロモーション、事業拡大、従業員の研修やインセンティブなどを総称しビジネストラベルの傾向を加速させています。
世界市場は主に、観光や企業セクターにおけるデジタル化の進展の影響を受けています。これに伴い、モノのインターネット(IoT)の普及が進み、旅行者と旅行オペレーターの双方が迅速かつ容易に物事を成し遂げることができるようになっています。これに伴い、バーチャルリアリティ(VR)技術も、より良い、効率的でパーソナライズされた顧客体験を提供し、市場の成長を後押ししています。これとは別に、ビジネスとレジャーの要素を取り入れ、レジャーやレクリエーション活動を提供してストレスを解消し、仕事の効率を向上させるブレジャートラベルの動向が高まっていることも、市場にプラスの推進力を与えています。旅行・観光部門の大規模な開発、中小企業(SME)の増加、急速な世界化により、ビジネストラベル者数が増加しています。これに加え、複数の企業組織が主要ビジネストラベル企業と提携し、カスタマイズされたコラボレーション・スペースやチーム・ビルディングのエクササイズを提供していることも、成長を促す大きな要因となっています。
目次
第1章 序文
第2章 調査範囲と調査手法
- 調査の目的
- ステークホルダー
- データソース
- 一次情報
- 二次情報
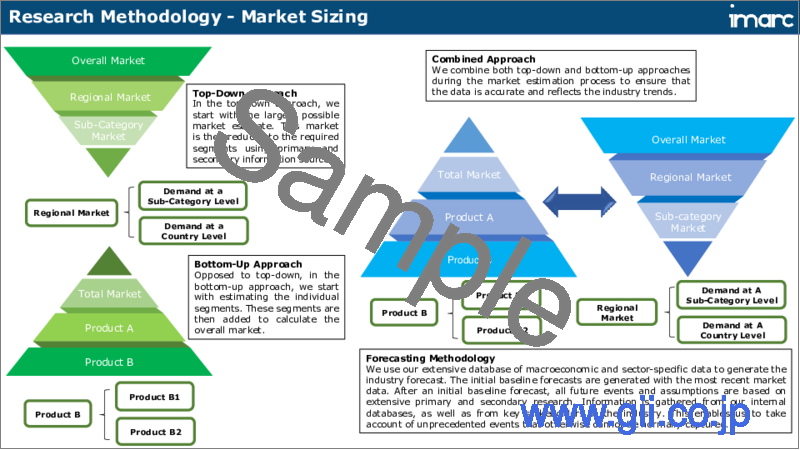
- 市場推定
- ボトムアップアプローチ
- トップダウンアプローチ
- 調査手法
第3章 エグゼクティブサマリー
第4章 イントロダクション
- 概要
- 主要業界動向
第5章 世界のビジネストラベル市場
- 市場概要
- 市場実績
- COVID-19の影響
- 市場予測
第6章 市場内訳:タイプ別
- 管理されたビジネストラベル
- 市場動向
- 市場予測
- 管理されていないビジネストラベル
- 市場動向
- 市場予測
第7章 市場内訳:目的別
- マーケティング
- 市場動向
- 市場予測
- 社内会議
- 市場動向
- 市場予測
- 展示会
- 市場動向
- 市場予測
- 製品発売
- 市場動向
- 市場予測
- その他
- 市場動向
- 市場予測
第8章 市場内訳:支出別
- 旅行料金
- 市場動向
- 市場予測
- 宿泊
- 市場動向
- 市場予測
- ダイニング
- 市場動向
- 市場予測
- その他
- 市場動向
- 市場予測
第9章 市場内訳:年齢層別
- 40歳未満の旅行者
- 市場動向
- 市場予測
- 40歳以上の旅行者
- 市場動向
- 市場予測
第10章 市場内訳:サービス種別
- 交通機関
- 市場動向
- 市場予測
- 食事と宿泊
- 市場動向
- 市場予測
- レクリエーション活動
- 市場動向
- 市場予測
- その他
- 市場動向
- 市場予測
第11章 市場内訳:旅行タイプ別
- 団体旅行
- 市場動向
- 市場予測
- 一人旅
- 市場動向
- 市場予測
第12章 市場内訳:エンドユーザー別
- 政府
- 市場動向
- 市場予測
- 企業
- 市場動向
- 市場予測
- その他
- 市場動向
- 市場予測
第13章 市場内訳:地域別
- 北米
- 米国
- カナダ
- アジア太平洋地域
- 中国
- 日本
- インド
- 韓国
- オーストラリア
- インドネシア
- その他
- 欧州
- ドイツ
- フランス
- 英国
- イタリア
- スペイン
- ロシア
- その他
- ラテンアメリカ
- ブラジル
- メキシコ
- その他
- 中東・アフリカ
- 市場動向
- 市場内訳:国別
- 市場予測
第14章 SWOT分析
- 概要
- 強み
- 弱み
- 機会
- 脅威
第15章 バリューチェーン分析
第16章 ポーターのファイブフォース分析
- 概要
- 買い手の交渉力
- 供給企業の交渉力
- 競合の程度
- 新規参入業者の脅威
- 代替品の脅威
第17章 競合情勢
- 市場構造
- 主要企業
- 主要企業のプロファイル
- Airbnb Inc.
- American Express Company
- BCD Travel
- Booking Holdings Inc.
- Carlson Wagonlit Travel Inc.
- Expedia Group Inc.
- Fareportal Inc.
- Flight Centre Travel Group
- Hogg Robinson Group
- Travel Leaders Group LLC
- Wexas Ltd.
List of Figures
- Figure 1: Global: Business Travel Market: Major Drivers and Challenges
- Figure 2: Global: Business Travel Market: Sales Value (in Trillion USD), 2019-2024
- Figure 3: Global: Business Travel Market: Breakup by Type (in %), 2024
- Figure 4: Global: Business Travel Market: Breakup by Purpose Type (in %), 2024
- Figure 5: Global: Business Travel Market: Breakup by Expenditure (in %), 2024
- Figure 6: Global: Business Travel Market: Breakup by Age Group (in %), 2024
- Figure 7: Global: Business Travel Market: Breakup by Service Type (in %), 2024
- Figure 8: Global: Business Travel Market: Breakup by Travel Type (in %), 2024
- Figure 9: Global: Business Travel Market: Breakup by End-User (in %), 2024
- Figure 10: Global: Business Travel Market: Breakup by Region (in %), 2024
- Figure 11: Global: Business Travel Market Forecast: Sales Value (in Trillion USD), 2025-2033
- Figure 12: Global: Business Travel (Managed Business Travel) Market: Sales Value (in Billion USD), 2019 & 2024
- Figure 13: Global: Business Travel (Managed Business Travel) Market Forecast: Sales Value (in Billion USD), 2025-2033
- Figure 14: Global: Business Travel (Unmanaged Business Travel) Market: Sales Value (in Billion USD), 2019 & 2024
- Figure 15: Global: Business Travel (Unmanaged Business Travel) Market Forecast: Sales Value (in Billion USD), 2025-2033
- Figure 16: Global: Business Travel (Marketing) Market: Sales Value (in Billion USD), 2019 & 2024
- Figure 17: Global: Business Travel (Marketing) Market Forecast: Sales Value (in Billion USD), 2025-2033
- Figure 18: Global: Business Travel (Internal Meetings) Market: Sales Value (in Billion USD), 2019 & 2024
- Figure 19: Global: Business Travel (Internal Meetings) Market Forecast: Sales Value (in Billion USD), 2025-2033
- Figure 20: Global: Business Travel (Trade Shows) Market: Sales Value (in Billion USD), 2019 & 2024
- Figure 21: Global: Business Travel (Trade Shows) Market Forecast: Sales Value (in Billion USD), 2025-2033
- Figure 22: Global: Business Travel (Product Launch) Market: Sales Value (in Billion USD), 2019 & 2024
- Figure 23: Global: Business Travel (Product Launch) Market Forecast: Sales Value (in Billion USD), 2025-2033
- Figure 24: Global: Business Travel (Others) Market: Sales Value (in Billion USD), 2019 & 2024
- Figure 25: Global: Business Travel (Others) Market Forecast: Sales Value (in Billion USD), 2025-2033
- Figure 26: Global: Business Travel (Travel Fare) Market: Sales Value (in Billion USD), 2019 & 2024
- Figure 27: Global: Business Travel (Travel Fare) Market Forecast: Sales Value (in Billion USD), 2025-2033
- Figure 28: Global: Business Travel (Lodging) Market: Sales Value (in Billion USD), 2019 & 2024
- Figure 29: Global: Business Travel (Lodging) Market Forecast: Sales Value (in Billion USD), 2025-2033
- Figure 30: Global: Business Travel (Dining) Market: Sales Value (in Billion USD), 2019 & 2024
- Figure 31: Global: Business Travel (Dining) Market Forecast: Sales Value (in Billion USD), 2025-2033
- Figure 32: Global: Business Travel (Others) Market: Sales Value (in Billion USD), 2019 & 2024
- Figure 33: Global: Business Travel (Others) Market Forecast: Sales Value (in Billion USD), 2025-2033
- Figure 34: Global: Business Travel (Travelers Below 40 Years) Market: Sales Value (in Billion USD), 2019 & 2024
- Figure 35: Global: Business Travel (Travelers Below 40 Years) Market Forecast: Sales Value (in Billion USD), 2025-2033
- Figure 36: Global: Business Travel (Travelers Above 40 Years) Market: Sales Value (in Billion USD), 2019 & 2024
- Figure 37: Global: Business Travel (Travelers Above 40 Years) Market Forecast: Sales Value (in Billion USD), 2025-2033
- Figure 38: Global: Business Travel (Transportation) Market: Sales Value (in Billion USD), 2019 & 2024
- Figure 39: Global: Business Travel (Transportation) Market Forecast: Sales Value (in Billion USD), 2025-2033
- Figure 40: Global: Business Travel (Food and Lodging) Market: Sales Value (in Billion USD), 2019 & 2024
- Figure 41: Global: Business Travel (Food and Lodging) Market Forecast: Sales Value (in Billion USD), 2025-2033
- Figure 42: Global: Business Travel (Recreational Activities) Market: Sales Value (in Billion USD), 2019 & 2024
- Figure 43: Global: Business Travel (Recreational Activities) Market Forecast: Sales Value (in Billion USD), 2025-2033
- Figure 44: Global: Business Travel (Others) Market: Sales Value (in Billion USD), 2019 & 2024
- Figure 45: Global: Business Travel (Others) Market Forecast: Sales Value (in Billion USD), 2025-2033
- Figure 46: Global: Business Travel (Group Travel) Market: Sales Value (in Billion USD), 2019 & 2024
- Figure 47: Global: Business Travel (Group Travel) Market Forecast: Sales Value (in Billion USD), 2025-2033
- Figure 48: Global: Business Travel (Solo Travel) Market: Sales Value (in Billion USD), 2019 & 2024
- Figure 49: Global: Business Travel (Solo Travel) Market Forecast: Sales Value (in Billion USD), 2025-2033
- Figure 50: Global: Business Travel (Government) Market: Sales Value (in Billion USD), 2019 & 2024
- Figure 51: Global: Business Travel (Government) Market Forecast: Sales Value (in Billion USD), 2025-2033
- Figure 52: Global: Business Travel (Corporate) Market: Sales Value (in Billion USD), 2019 & 2024
- Figure 53: Global: Business Travel (Corporate) Market Forecast: Sales Value (in Billion USD), 2025-2033
- Figure 54: Global: Business Travel (Others) Market: Sales Value (in Billion USD), 2019 & 2024
- Figure 55: Global: Business Travel (Others) Market Forecast: Sales Value (in Billion USD), 2025-2033
- Figure 56: North America: Business Travel Market: Sales Value (in Billion USD), 2019 & 2024
- Figure 57: North America: Business Travel Market Forecast: Sales Value (in Billion USD), 2025-2033
- Figure 58: United States: Business Travel Market: Sales Value (in Billion USD), 2019 & 2024
- Figure 59: United States: Business Travel Market Forecast: Sales Value (in Billion USD), 2025-2033
- Figure 60: Canada: Business Travel Market: Sales Value (in Billion USD), 2019 & 2024
- Figure 61: Canada: Business Travel Market Forecast: Sales Value (in Billion USD), 2025-2033
- Figure 62: Asia Pacific: Business Travel Market: Sales Value (in Billion USD), 2019 & 2024
- Figure 63: Asia Pacific: Business Travel Market Forecast: Sales Value (in Billion USD), 2025-2033
- Figure 64: China: Business Travel Market: Sales Value (in Billion USD), 2019 & 2024
- Figure 65: China: Business Travel Market Forecast: Sales Value (in Billion USD), 2025-2033
- Figure 66: Japan: Business Travel Market: Sales Value (in Billion USD), 2019 & 2024
- Figure 67: Japan: Business Travel Market Forecast: Sales Value (in Billion USD), 2025-2033
- Figure 68: India: Business Travel Market: Sales Value (in Billion USD), 2019 & 2024
- Figure 69: India: Business Travel Market Forecast: Sales Value (in Billion USD), 2025-2033
- Figure 70: South Korea: Business Travel Market: Sales Value (in Billion USD), 2019 & 2024
- Figure 71: South Korea: Business Travel Market Forecast: Sales Value (in Billion USD), 2025-2033
- Figure 72: Australia: Business Travel Market: Sales Value (in Billion USD), 2019 & 2024
- Figure 73: Australia: Business Travel Market Forecast: Sales Value (in Billion USD), 2025-2033
- Figure 74: Indonesia: Business Travel Market: Sales Value (in Billion USD), 2019 & 2024
- Figure 75: Indonesia: Business Travel Market Forecast: Sales Value (in Billion USD), 2025-2033
- Figure 76: Others: Business Travel Market: Sales Value (in Billion USD), 2019 & 2024
- Figure 77: Others: Business Travel Market Forecast: Sales Value (in Billion USD), 2025-2033
- Figure 78: Europe: Business Travel Market: Sales Value (in Billion USD), 2019 & 2024
- Figure 79: Europe: Business Travel Market Forecast: Sales Value (in Billion USD), 2025-2033
- Figure 80: Germany: Business Travel Market: Sales Value (in Billion USD), 2019 & 2024
- Figure 81: Germany: Business Travel Market Forecast: Sales Value (in Billion USD), 2025-2033
- Figure 82: France: Business Travel Market: Sales Value (in Billion USD), 2019 & 2024
- Figure 83: France: Business Travel Market Forecast: Sales Value (in Billion USD), 2025-2033
- Figure 84: United Kingdom: Business Travel Market: Sales Value (in Billion USD), 2019 & 2024
- Figure 85: United Kingdom: Business Travel Market Forecast: Sales Value (in Billion USD), 2025-2033
- Figure 86: Italy: Business Travel Market: Sales Value (in Billion USD), 2019 & 2024
- Figure 87: Italy: Business Travel Market Forecast: Sales Value (in Billion USD), 2025-2033
- Figure 88: Spain: Business Travel Market: Sales Value (in Billion USD), 2019 & 2024
- Figure 89: Spain: Business Travel Market Forecast: Sales Value (in Billion USD), 2025-2033
- Figure 90: Russia: Business Travel Market: Sales Value (in Billion USD), 2019 & 2024
- Figure 91: Russia: Business Travel Market Forecast: Sales Value (in Billion USD), 2025-2033
- Figure 92: Others: Business Travel Market: Sales Value (in Billion USD), 2019 & 2024
- Figure 93: Others: Business Travel Market Forecast: Sales Value (in Billion USD), 2025-2033
- Figure 94: Latin America: Business Travel Market: Sales Value (in Billion USD), 2019 & 2024
- Figure 95: Latin America: Business Travel Market Forecast: Sales Value (in Billion USD), 2025-2033
- Figure 96: Brazil: Business Travel Market: Sales Value (in Billion USD), 2019 & 2024
- Figure 97: Brazil: Business Travel Market Forecast: Sales Value (in Billion USD), 2025-2033
- Figure 98: Mexico: Business Travel Market: Sales Value (in Billion USD), 2019 & 2024
- Figure 99: Mexico: Business Travel Market Forecast: Sales Value (in Billion USD), 2025-2033
- Figure 100: Others: Business Travel Market: Sales Value (in Billion USD), 2019 & 2024
- Figure 101: Others: Business Travel Market Forecast: Sales Value (in Billion USD), 2025-2033
- Figure 102: Middle East and Africa: Business Travel Market: Sales Value (in Billion USD), 2019 & 2024
- Figure 103: Middle East and Africa: Business Travel Market Forecast: Sales Value (in Billion USD), 2025-2033
- Figure 104: Global: Business Travel Industry: SWOT Analysis
- Figure 105: Global: Business Travel Industry: Value Chain Analysis
- Figure 106: Global: Business Travel Industry: Porter's Five Forces Analysis
List of Tables
- Table 1: Global: Business Travel Market: Key Industry Highlights, 2024 and 2033
- Table 2: Global: Business Travel Market Forecast: Breakup by Type (in Billion USD), 2025-2033
- Table 3: Global: Business Travel Market Forecast: Breakup by Purpose Type (in Billion USD), 2025-2033
- Table 4: Global: Business Travel Market Forecast: Breakup by Expenditure (in Billion USD), 2025-2033
- Table 5: Global: Business Travel Market Forecast: Breakup by Age Group (in Billion USD), 2025-2033
- Table 6: Global: Business Travel Market Forecast: Breakup by Service Type (in Billion USD), 2025-2033
- Table 7: Global: Business Travel Market Forecast: Breakup by Travel Type (in Billion USD), 2025-2033
- Table 8: Global: Business Travel Market Forecast: Breakup by End-User (in Billion USD), 2025-2033
- Table 9: Global: Business Travel Market Forecast: Breakup by Region (in Billion USD), 2025-2033
- Table 10: Global: Business Travel Market Structure
- Table 11: Global: Business Travel Market: Key Players
The global business travel market size reached USD 1.1 Trillion in 2024. Looking forward, IMARC Group expects the market to reach USD 2.0 Trillion by 2033, exhibiting a growth rate (CAGR) of 6.3% during 2025-2033. Increasing globalization of businesses, advancements in technology facilitating remote communication, the rise of multinational corporations necessitating cross-border travel, the growing importance of emerging markets, evolution of travel management solutions, adoption of flexible work arrangements, and government initiatives promoting tourism are factors some of the factors facilitating the market growth
Business travel, also known as corporate travel, is a journey explicitly undertaken for work purposes or to expand business operations. It includes traveling to a different branch of the company, or to a different location to meet with suppliers and buyers, or for conferences and business events. In recent years, the rapidly globalizing world has accelerated the trend of business travel, which collectively includes client meetings, brand and product promotion, business expansion, and employee training and incentives.
The global market is primarily being influenced by the increasing digitization in the tourism and corporate sectors. In line with this, growing penetration of the Internet of Things (IoT) has enabled both the travelers and the travel operators to get things done swiftly and with ease. Along with this, the virtual reality (VR) technology also provides better, efficient and personalized customer experiences, thus bolstering the market growth. Apart from this, the rising trend of Bleisure travel, which incorporates business with pleasure elements and offers leisure or recreational activities to relieve stress and improve work efficiency, has provided a positive thrust to the market. Large-scale developments in the travel and tourism sector, an increase in small and medium enterprises (SMEs) and fast-paced globalization has led to a rise in the number of business travelers. This, along with tie-ups of several corporate organizations with the leading business travel companies to provide customized collaborative spaces and team-building exercises, is acting as another major growth-inducing factor.
Business Travel Market Segmentation:
Breakup by Type:
Managed Business Travel
Unmanaged Business Travel
Breakup by Purpose Type:
Marketing
Internal Meetings
Trade Shows
Product Launch
Others
Breakup by Expenditure:
Travel Fare
Lodging
Dining
Others
Breakup by Age Group:
Travelers Below 40 Years
Travelers Above 40 Years
Breakup by Service Type:
Transportation
Food and Lodging
Recreational Activities
Others
Breakup by Travel Type:
Group Travel
Solo Travel
Breakup by End-User:
Government
Corporate
Others
Breakup by Region:
North America
United States
Canada
Asia Pacific
China
Japan
India
South Korea
Australia
Indonesia
Others
Europe
Germany
France
United Kingdom
Italy
Spain
Russia
Others
Latin America
Brazil
Mexico
Others
Middle East and Africa
Competitive Landscape:
The report has also analysed the competitive landscape of the market with some of the key players being Airbnb Inc., American Express Company, BCD Travel, Booking Holdings Inc., Carlson Wagonlit Travel Inc., Expedia Group Inc., Fareportal Inc., Flight Centre Travel Group, Hogg Robinson Group, Travel Leaders Group LLC, Wexas Ltd. etc.
Key Questions Answered in This Report
- 1. What was the size of the global business travel market in 2024?
- 2. What is the expected growth rate of the global business travel market during 2025-2033?
- 3. What are the key factors driving the global business travel market?
- 4. What has been the impact of COVID-19 on the global business travel market?
- 5. What is the breakup of the global business travel market based on the type?
- 6. What is the breakup of the global business travel market based on the purpose type?
- 7. What is the breakup of the global business travel market based on the expenditure?
- 8. What is the breakup of the global business travel market based on the age group?
- 9. What is the breakup of the global business travel market based on the service type?
- 10. What is the breakup of the global business travel market based on the travel type?
- 11. What is the breakup of the global business travel market based on the end-user?
- 12. What are the key regions in the global business travel market?
- 13. Who are the key companies/players in the global business travel market?
Table of Contents
1 Preface
2 Scope and Methodology
- 2.1 Objectives of the Study
- 2.2 Stakeholders
- 2.3 Data Sources
- 2.3.1 Primary Sources
- 2.3.2 Secondary Sources
- 2.4 Market Estimation
- 2.4.1 Bottom-Up Approach
- 2.4.2 Top-Down Approach
- 2.5 Forecasting Methodology
3 Executive Summary
4 Introduction
- 4.1 Overview
- 4.2 Key Industry Trends
5 Global Business Travel Market
- 5.1 Market Overview
- 5.2 Market Performance
- 5.3 Impact of COVID-19
- 5.4 Market Forecast
6 Market Breakup by Type
- 6.1 Managed Business Travel
- 6.1.1 Market Trends
- 6.1.2 Market Forecast
- 6.2 Unmanaged Business Travel
- 6.2.1 Market Trends
- 6.2.2 Market Forecast
7 Market Breakup by Purpose Type
- 7.1 Marketing
- 7.1.1 Market Trends
- 7.1.2 Market Forecast
- 7.2 Internal Meetings
- 7.2.1 Market Trends
- 7.2.2 Market Forecast
- 7.3 Trade Shows
- 7.3.1 Market Trends
- 7.3.2 Market Forecast
- 7.4 Product Launch
- 7.4.1 Market Trends
- 7.4.2 Market Forecast
- 7.5 Others
- 7.5.1 Market Trends
- 7.5.2 Market Forecast
8 Market Breakup by Expenditure
- 8.1 Travel Fare
- 8.1.1 Market Trends
- 8.1.2 Market Forecast
- 8.2 Lodging
- 8.2.1 Market Trends
- 8.2.2 Market Forecast
- 8.3 Dining
- 8.3.1 Market Trends
- 8.3.2 Market Forecast
- 8.4 Others
- 8.4.1 Market Trends
- 8.4.2 Market Forecast
9 Market Breakup by Age Group
- 9.1 Travelers Below 40 Years
- 9.1.1 Market Trends
- 9.1.2 Market Forecast
- 9.2 Travelers Above 40 Years
- 9.2.1 Market Trends
- 9.2.2 Market Forecast
10 Market Breakup by Service Type
- 10.1 Transportation
- 10.1.1 Market Trends
- 10.1.2 Market Forecast
- 10.2 Food and Lodging
- 10.2.1 Market Trends
- 10.2.2 Market Forecast
- 10.3 Recreational Activities
- 10.3.1 Market Trends
- 10.3.2 Market Forecast
- 10.4 Others
- 10.4.1 Market Trends
- 10.4.2 Market Forecast
11 Market Breakup by Travel Type
- 11.1 Group Travel
- 11.1.1 Market Trends
- 11.1.2 Market Forecast
- 11.2 Solo Travel
- 11.2.1 Market Trends
- 11.2.2 Market Forecast
12 Market Breakup by End-User
- 12.1 Government
- 12.1.1 Market Trends
- 12.1.2 Market Forecast
- 12.2 Corporate
- 12.2.1 Market Trends
- 12.2.2 Market Forecast
- 12.3 Others
- 12.3.1 Market Trends
- 12.3.2 Market Forecast
13 Market Breakup by Region
- 13.1 North America
- 13.1.1 United States
- 13.1.1.1 Market Trends
- 13.1.1.2 Market Forecast
- 13.1.2 Canada
- 13.1.2.1 Market Trends
- 13.1.2.2 Market Forecast
- 13.1.1 United States
- 13.2 Asia Pacific
- 13.2.1 China
- 13.2.1.1 Market Trends
- 13.2.1.2 Market Forecast
- 13.2.2 Japan
- 13.2.2.1 Market Trends
- 13.2.2.2 Market Forecast
- 13.2.3 India
- 13.2.3.1 Market Trends
- 13.2.3.2 Market Forecast
- 13.2.4 South Korea
- 13.2.4.1 Market Trends
- 13.2.4.2 Market Forecast
- 13.2.5 Australia
- 13.2.5.1 Market Trends
- 13.2.5.2 Market Forecast
- 13.2.6 Indonesia
- 13.2.6.1 Market Trends
- 13.2.6.2 Market Forecast
- 13.2.7 Others
- 13.2.7.1 Market Trends
- 13.2.7.2 Market Forecast
- 13.2.1 China
- 13.3 Europe
- 13.3.1 Germany
- 13.3.1.1 Market Trends
- 13.3.1.2 Market Forecast
- 13.3.2 France
- 13.3.2.1 Market Trends
- 13.3.2.2 Market Forecast
- 13.3.3 United Kingdom
- 13.3.3.1 Market Trends
- 13.3.3.2 Market Forecast
- 13.3.4 Italy
- 13.3.4.1 Market Trends
- 13.3.4.2 Market Forecast
- 13.3.5 Spain
- 13.3.5.1 Market Trends
- 13.3.5.2 Market Forecast
- 13.3.6 Russia
- 13.3.6.1 Market Trends
- 13.3.6.2 Market Forecast
- 13.3.7 Others
- 13.3.7.1 Market Trends
- 13.3.7.2 Market Forecast
- 13.3.1 Germany
- 13.4 Latin America
- 13.4.1 Brazil
- 13.4.1.1 Market Trends
- 13.4.1.2 Market Forecast
- 13.4.2 Mexico
- 13.4.2.1 Market Trends
- 13.4.2.2 Market Forecast
- 13.4.3 Others
- 13.4.3.1 Market Trends
- 13.4.3.2 Market Forecast
- 13.4.1 Brazil
- 13.5 Middle East and Africa
- 13.5.1 Market Trends
- 13.5.2 Market Breakup by Country
- 13.5.3 Market Forecast
14 SWOT Analysis
- 14.1 Overview
- 14.2 Strengths
- 14.3 Weaknesses
- 14.4 Opportunities
- 14.5 Threats
15 Value Chain Analysis
16 Porters Five Forces Analysis
- 16.1 Overview
- 16.2 Bargaining Power of Buyers
- 16.3 Bargaining Power of Suppliers
- 16.4 Degree of Competition
- 16.5 Threat of New Entrants
- 16.6 Threat of Substitutes
17 Competitive Landscape
- 17.1 Market Structure
- 17.2 Key Players
- 17.3 Profiles of Key Players
- 17.3.1 Airbnb Inc.
- 17.3.1.1 Company Overview
- 17.3.1.2 Product Portfolio
- 17.3.2 American Express Company
- 17.3.2.1 Company Overview
- 17.3.2.2 Product Portfolio
- 17.3.2.3 Financials
- 17.3.2.4 SWOT Analysis
- 17.3.3 BCD Travel
- 17.3.3.1 Company Overview
- 17.3.3.2 Product Portfolio
- 17.3.4 Booking Holdings Inc.
- 17.3.4.1 Company Overview
- 17.3.4.2 Product Portfolio
- 17.3.4.3 Financials
- 17.3.4.4 SWOT Analysis
- 17.3.5 Carlson Wagonlit Travel Inc.
- 17.3.5.1 Company Overview
- 17.3.5.2 Product Portfolio
- 17.3.6 Expedia Group Inc.
- 17.3.6.1 Company Overview
- 17.3.6.2 Product Portfolio
- 17.3.6.3 Financials
- 17.3.6.4 SWOT Analysis
- 17.3.7 Fareportal Inc.
- 17.3.7.1 Company Overview
- 17.3.7.2 Product Portfolio
- 17.3.8 Flight Centre Travel Group
- 17.3.8.1 Company Overview
- 17.3.8.2 Product Portfolio
- 17.3.8.3 Financials
- 17.3.9 Hogg Robinson Group
- 17.3.9.1 Company Overview
- 17.3.9.2 Product Portfolio
- 17.3.9.3 Financials
- 17.3.10 Travel Leaders Group LLC
- 17.3.10.1 Company Overview
- 17.3.10.2 Product Portfolio
- 17.3.11 Wexas Ltd.
- 17.3.11.1 Company Overview
- 17.3.11.2 Product Portfolio
- 17.3.1 Airbnb Inc.

