|
|
市場調査レポート
商品コード
1721646
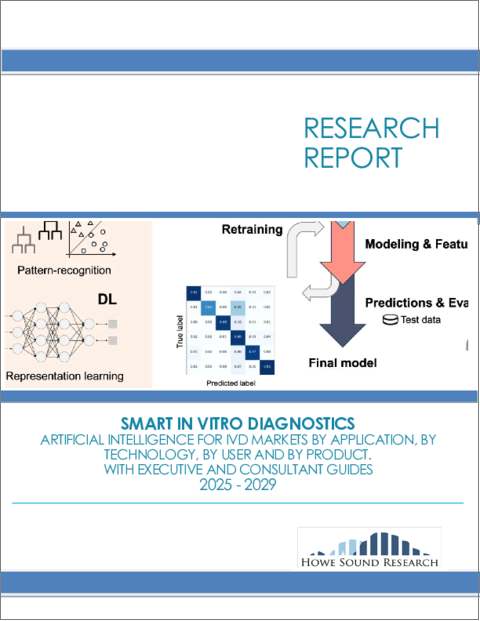
スマート体外診断薬市場 - 体外診断薬市場における人工知能 - 用途別、技術別、場所別、製品別 - エグゼクティブコンサルタントガイド付き(2025年~2029年)Smart In Vitro Diagnostics. Artificial Intelligence for IVD Markets by Application, By Technology, By Product and By User. With Executive and Consultant Guides 2025-2029 |
||||||
|
|||||||
| スマート体外診断薬市場 - 体外診断薬市場における人工知能 - 用途別、技術別、場所別、製品別 - エグゼクティブコンサルタントガイド付き(2025年~2029年) |
|
出版日: 2025年03月30日
発行: Howe Sound Research
ページ情報: 英文 417 Pages
納期: 即日から翌営業日
|
全表示
- 概要
- 図表
- 目次
人工知能が今後20年間の体外診断薬市場の成長を牽引します。医師があらゆる情報を駆使して病気と闘うため、市場は爆発的に拡大しています。一方、製薬会社はほぼすべての治療法を実現できる可能性を見出しています。診断へのこの新しいアプローチが、医療をどのように変えていくかをご覧いただけます。
ゼロから創造される市場で、参入企業がどのようにポジションを争っているのでしょうか。一部の参入企業は大きくリードし、世界に展開しています。適切な診断薬と適切なサポートがあれば、プレミアム価格で取引される可能性のある、巨大な機会を秘めたダイナミックな市場状況です。また、科学が開発されると同時に、新たな機会も定期的に生まれています。そして、多くの汎用診断薬のコストは下がり続けています。
当レポートには18カ国と4地域の詳細な内訳が含まれています。本レポートを購入された方は、世界のどの国の詳細な内訳もご覧いただけます。
当レポートは、世界のスマート体外診断薬市場について調査し、市場の概要とともに、用途別、技術別、場所別、製品別動向、および市場に参入する企業のプロファイルなどを提供しています。
目次
第1章 市場ガイド
第2章 イントロダクションと市場の定義
- スマート診断とは何か
- 市場定義
- 調査手法
- 視点:ヘルスケアとIVD業界
第3章 市場概要
- 市場参入組織
- 学術研究機関
- 診断試験開発者
- 計測機器サプライヤー
- 薬品・試薬メーカー
- 病理サプライヤー
- 独立系臨床検査室
- 公共の国立/地域研究所
- 病院検査室
- 臨床検査室
- 監査機関
- 認証機関
- 人工知能を理解する
- IVDにおけるAIの応用
第4章 市場動向
- 成長促進要因
- 成長抑制要因
- 計測、自動化、診断の動向
第5章 最近の動向
第6章 主要企業のプロファイル
- Adaptive Biotechnologies
- Aidoc
- Anumana
- ARUP Laboratories
- Atomwise
- Bayesian Health
- Behold.ai
- BGI Genomics Co. Ltd
- bioMerieux Diagnostics
- Bio-Rad Laboratories, Inc
- Cambridge Cognition
- Cardiologs(Phillips)
- CareDx
- Caris Molecular Diagnostics
- Cleerly
- ClosedLoop AI
- CloudMedX Health
- Deepcell
- Digital Diagnostics
- EKF Diagnostics Holdings
- Freenome
- GE Healthcare
- Glooko
- Idoven
- Illumina
- Infohealth
- Jade
- K Health
- Lunit
- Luventix
- MaxCyte
- Mayo Clinic Laboratories
- Medtronic
- Merative
- Nanox
- NIOX Group
- Niramai Health Analytix
- NVIDIA
- Oncohost
- OraLiva
- Owkin
- Oxford Nanopore Technologies
- Pacific Biosciences
- Paige.AI
- PathAI
- Perthera
- Philips Healthcare
- Prognos
- Qiagen
- Qure.ai
- Renalytix
- Seegene
- Siemens Healthineers
- Sophia Genetics
- Sysmex
- Viz.ai
第7章 世界のスマート体外診断薬市場
- 国別世界市場概要
- 用途別世界市場- 概要
- 技術別世界市場- 概要
- 場所別世界市場- 概要
- 製品別世界市場- 概要
第8章 世界市場 - 用途別
- がん
- 感染症検査
- 代謝検査
- 心臓検査
- 糖尿病検査
- その他
第9章 世界市場 - 技術別
- NGS技術
- PCR技術
- 化学/IA技術
- 病理学技術
- その他の技術
第10章 世界の市場 - 場所別
- 研究
- 医薬品研究
- 臨床
- その他
第11章 世界の市場 - 製品別
- 機器
- アッセイ
- ソフトウェア
- サービス
- その他
第12章 付録
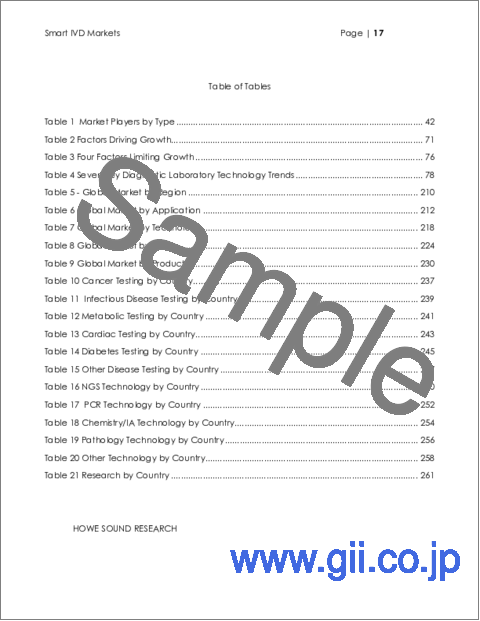
Table of Tables
- Table 1: Market Players by Type
- Table 2: Factors Driving Growth
- Table 3: Four Factors Limiting Growth
- Table 4: Seven Key Diagnostic Laboratory Technology Trends
- Table 5: Global Market by Region
- Table 6: Global Market by Application
- Table 7: Global Market by Technology
- Table 8: Global Market by Place
- Table 9: Global Market by Product
- Table 10: Cancer Testing by Country
- Table 11: Infectious Disease Testing by Country
- Table 12: Metabolic Testing by Country
- Table 13: Cardiac Testing by Country
- Table 14: Diabetes Testing by Country
- Table 15: Other Disease Testing by Country
- Table 16: NGS Technology by Country
- Table 17: PCR Technology by Country
- Table 18: Chemistry/IA Technology by Country
- Table 19: Pathology Technology by Country
- Table 20: Other Technology by Country
- Table 21: Research by Country
- Table 22: Pharmaceutical Research by Country
- Table 23: Clinical by Country
- Table 24: Other Place by Country
- Table 25: Instruments by Country
- Table 26: Assay by Country
- Table 27: Software by Country
- Table 28: Services by Country
- Table 29: Other Product by Country
- Table 30: Laboratory Fee Schedule
- Table 31: The Most Common Assays
- Table 32: Largest Revenue Assays
Table of Figures
- Figure 1: Global Healthcare Spending
- Figure 2: The Lab Test Pie
- Figure 3: The Road to Diagnostics
- Figure 4: AI and Learning Methods
- Figure 5: The Changing Age of The World's Population
- Figure 6: Health Care Consumption by Age
- Figure 7: Cancer Incidence - Age at Diagnosis
- Figure 8: Centralized vs. Decentralized Laboratory Service
- Figure 9: A Highly Multiplexed Syndromic Testing Unit
- Figure 10: The Real Cost to Sequence the Human Genome
- Figure 11: The Codevelopment Process
- Figure 12: Comparing MDx Diagnostic and Traditional Testing
- Figure 13: Base Year Country Global Share
- Figure 14: Global Market by Application - Base vs. Final Year
- Figure 15: Market by Application Base Year
- Figure 16: Market by Application Final Year
- Figure 17: Application Share by Year
- Figure 18: Application Segment Growth
- Figure 19: Global Market by Technology - Base vs. Final Year
- Figure 20: Market by Technology Base Year
- Figure 21: Market by Technology Final Year
- Figure 22: Market by Technology Share by Year
- Figure 23: Market by Technology Segment Growth
- Figure 24: Market by Place - Base vs. Final Year
- Figure 25: Market by Place Base Year
- Figure 26: Market by Place Final Year
- Figure 27: Market by Place Share by Year
- Figure 28: Market by Place Segment Growth
- Figure 29: Market by Product - Base vs. Final Year
- Figure 30: Market by Product Base Year
- Figure 31: Market by Product Final Year
- Figure 32: Market by Product Share by Year
- Figure 33: Market by Product Segment Growth
- Figure 34: Cancer Testing Growth
- Figure 35: Infectious Disease Testing Growth
- Figure 36: Metabolic Testing Growth
- Figure 37: Cardiac Testing Growth
- Figure 38: Diabetes Testing Growth
- Figure 39: Other Disease Testing Growth
- Figure 40: NGS Technology Growth
- Figure 41: PCR Technology Growth
- Figure 42: Chemistry/IA Technology Growth
- Figure 43: Pathology Technology Growth
- Figure 44: Other Technology Growth
- Figure 45: Research Growth
- Figure 46: Pharmaceutical Research Growth
- Figure 47: Clinical Growth
- Figure 48: Other Place Growth
- Figure 49: Instruments Growth
- Figure 50: Assay Growth
- Figure 51: Software Growth
- Figure 52: Services Growth
- Figure 53: Other Product Growth
Artificial Intelligence will drive IVD market growth over the next 20 years. The market is exploding as physicians use all the information they can get to battle disease. While Pharmaceutical Companies see the potential to make nearly any therapy viable. Find out how this new approach to diagnostics will change medical care forever.
Learn all about how players are jockeying for position in a market that is being created from scratch. And some players are pulling way out in front and expanding globally. It is a dynamic market situation with enormous opportunity where the right diagnostic with the right support can command premium pricing. And the science is developing at the same time creating new opportunities with regularity. And the cost of many commodity diagnostics continues to fall.
The report includes detailed breakouts for 18 Countries and 4 Regions. A detailed breakout for any country in the world is available to purchasers of the report.
Table of Contents
1. Market Guides
- 1.1. Strategic Situation Analysis
- 1.2. Guide for Executives, Marketing, and Business Development Staff
- 1.3. Guide for Management Consultants and Investment Advisors
2. Introduction and Market Definition
- 2.1. What are Smart Diagnostics?
- 2.2. Market Definition
- 2.2.1. Revenue Market Size
- 2.3. Methodology
- 2.3.1. Methodology
- 2.3.2. Sources
- 2.3.3. Authors
- 2.4. Perspective: Healthcare and the IVD Industry
- 2.4.1. Global Healthcare Spending
- 2.4.2. Spending on Diagnostics
- 2.4.3. Important Role of Insurance for Diagnostics
3. Market Overview
- 3.1. Players in a Dynamic Market
- 3.1.1. Academic Research Lab
- 3.1.2. Diagnostic Test Developer
- 3.1.3. Instrumentation Supplier
- 3.1.4. Chemical/Reagent Supplier
- 3.1.5. Pathology Supplier
- 3.1.6. Independent Clinical Laboratory
- 3.1.7. Public National/regional Laboratory
- 3.1.8. Hospital Laboratory
- 3.1.9. Physicians Office Lab (POLS)
- 3.1.10. Audit Body
- 3.1.11. Certification Body
- 3.2. Understanding Artificial Intelligence
- 3.2.1. Artificial intelligence
- 3.2.2. Machine learning
- 3.2.3. Deep learning
- 3.2.4. Convolutional neural networks
- 3.2.5. Generative adversarial networks
- 3.2.6. Limitations
- 3.3. AI Applications in IVD
- 3.3.1. Infectious Disease
- 3.3.1.1. Known vs. Unknown
- 3.3.1.2. TMI
- 3.3.1.3. Disease surveillance
- 3.3.1.4. Outbreak detection
- 3.3.1.5. Contact tracing
- 3.3.1.6. Forecasting
- 3.3.1.7. Drug discovery
- 3.3.1.8. Resource allocation
- 3.3.2. Oncology
- 3.3.2.1. Electronic health records
- 3.3.2.2. Genomic analysis
- 3.3.2.3. Treatment planning
- 3.3.2.4. Clinical trial matching
- 3.3.3. Anatomic Pathology
- 3.3.3.1. Image analysis
- 3.3.3.2. Tumor segmentation
- 3.3.3.3. Disease classification
- 3.3.3.4. Predictive modeling
- 3.3.3.5. Quality control
- 3.3.3.6. Digital pathology
- 3.3.4. Cardiology
- 3.3.4.1. Electrocardiogram analysis
- 3.3.4.2. Electronic health records
- 3.3.4.3. Genomic analysis
- 3.3.4.4. Treatment planning
- 3.3.4.5. Prediction of outcomes
- 3.3.5. Diabetes
- 3.3.5.1. Diagnosis
- 3.3.5.2. Blood glucose monitoring
- 3.3.5.3. Personalized treatment plans
- 3.3.5.4. Medication management
- 3.3.5.5. Diabetes education
- 3.3.5.6. Predictive analytics
- 3.3.6. General Medicine
- 3.3.6.1. Diagnosis
- 3.3.6.2. Predictive Analytics
- 3.3.6.3. Personalized Treatment Plans
- 3.3.6.4. Medication Management
- 3.3.6.5. Disease Monitoring
- 3.3.6.6. Telemedicine
- 3.3.1. Infectious Disease
4. Market Trends
- 4.1. Factors Driving Growth
- 4.1.1. Outcome Improvement
- 4.1.2. The Aging Effect
- 4.1.3. Cost Containment
- 4.1.4. Physician Impact
- 4.1.5. Cost of Intelligence
- 4.2. Factors Limiting Growth
- 4.2.1. State of knowledge
- 4.2.2. Genetic Blizzard
- 4.2.3. Protocol Resistance
- 4.2.4. Regulation and coverage
- 4.3. Instrumentation, Automation and Diagnostic Trends
- 4.3.1. Traditional Automation and Centralization
- 4.3.2. The New Automation, Decentralization and Point Of Care
- 4.3.3. Instruments Key to Market Share
- 4.3.4. Bioinformatics Plays a Role
- 4.3.5. PCR Takes Command
- 4.3.6. Next Generation Sequencing Fuels a Revolution
- 4.3.7. NGS Impact on Pricing
- 4.3.8. Whole Genome Sequencing, A Brave New World
- 4.3.9. Companion Diagnostics Blurs Diagnosis and Treatment
- 4.3.10. Shifting Role of Diagnostics
5. Recent Developments
- 5.1. Recent Developments - Importance and How to Use This Section
- 5.1.1. Importance of These Developments
- 5.1.2. How to Use This Section
- 5.2. Ataraxis AI Nabs Financing
- 5.3. Myriad Genetics Licenses Image Analysis Technology
- 5.4. Danaher, AI Firm I Form Investment Partnership
- 5.5. Cardio Dx AI-Based Tests Receive Final CMS Pricing
- 5.6. Ataraxis AI Launches AI Cancer Dx
- 5.7. Tempus Immuno-Oncology Portfolio AI-enabled
- 5.8. AI enables precision diagnosis of cervical cancer
- 5.9. UK to Rollout Digital Pathology Across NHS
- 5.10. AI Based Next-Generation Colorectal Cancer Test
- 5.11. Evident, Corista, Sakura Finetek, Visiopharm Form Digital Pathology Alliance
- 5.12. Viome Life Sciences Raises $86.5M in Oversubscribed Series C Round
- 5.13. Becton Dickinson Gets Clearance for AI-Based Bacterial Imaging
- 5.14. Paige, Leica Biosystems Expand Digital Pathology Partnership
- 5.15. Clarapath Acquires Digital Pathology Company Crosscope
- 5.16. CanSense to Develop Colorectal Cancer Test
- 5.17. Owkin-led Machine Learning Study IDs Cancer Treatment Biomarkers
- 5.18. Guardant Health to Integrate Lunit's AI PD-L1 Algorithm
- 5.19. Vesale Bioscience to Develop AI Phage Therapy Diagnostic Platform
- 5.20. Caris Life Sciences To Use AI and Machine Learning
- 5.21. Numares Health To Develop AI for "Metabolite Constellations"
- 5.22. Sepsis Testing Startup DeepUll to Use AI for Medical Decisions
- 5.23. Viome Life Sciences Raises $67M in Series C Financing For AI Cancer Dx
- 5.24. ADM Diagnostics Wins Grant for Brain Injury Test Development
- 5.25. Paige to Develop New AI-based Pathology Test
- 5.26. Aiforia Gains CE-IVD Mark for AI-Powered Histopathology
- 5.27. Genetic Profiling May Identify Patients Who Do Not Need Radiation Therapy
- 5.28. Thermo Fisher Introduces Homologous Score for Cancer Profiling
- 5.29. Genomic Test IDs Cancer Cells Early
6. Profiles of Key Players
- 6.1. Adaptive Biotechnologies
- 6.2. Aidoc
- 6.3. Anumana
- 6.4. ARUP Laboratories
- 6.5. Atomwise
- 6.6. Bayesian Health
- 6.7. Behold.ai
- 6.8. BGI Genomics Co. Ltd
- 6.9. bioMerieux Diagnostics
- 6.10. Bio-Rad Laboratories, Inc
- 6.11. Cambridge Cognition
- 6.12. Cardiologs (Phillips)
- 6.13. CareDx
- 6.14. Caris Molecular Diagnostics
- 6.15. Cleerly
- 6.16. ClosedLoop AI
- 6.17. CloudMedX Health
- 6.18. Deepcell
- 6.19. Digital Diagnostics
- 6.20. EKF Diagnostics Holdings
- 6.21. Freenome
- 6.22. GE Healthcare
- 6.23. Glooko
- 6.24. Idoven
- 6.25. Illumina
- 6.26. Infohealth
- 6.27. Jade
- 6.28. K Health
- 6.29. Lunit
- 6.30. Luventix
- 6.31. MaxCyte
- 6.32. Mayo Clinic Laboratories
- 6.33. Medtronic
- 6.34. Merative
- 6.35. Nanox
- 6.36. NIOX Group
- 6.37. Niramai Health Analytix
- 6.38. NVIDIA
- 6.39. Oncohost
- 6.40. OraLiva
- 6.41. Owkin
- 6.42. Oxford Nanopore Technologies
- 6.43. Pacific Biosciences
- 6.44. Paige.AI
- 6.45. PathAI
- 6.46. Perthera
- 6.47. Philips Healthcare
- 6.48. Prognos
- 6.49. Qiagen
- 6.50. Qure.ai
- 6.51. Renalytix
- 6.52. Seegene
- 6.53. Siemens Healthineers
- 6.54. Sophia Genetics
- 6.55. Sysmex
- 6.56. Viz.ai
7. The Global Market for Smart Diagnostics
- 7.1. Global Market Overview by Country
- 7.1.1. Table - Global Market by Country
- 7.1.2. Chart - Global Market by Country
- 7.2. Global Market by Application - Overview
- 7.2.1. Table - Global Market by Application
- 7.2.2. Chart - Global Market by Application - Base/Final Year Comparison
- 7.2.3. Chart - Global Market by Application - Base Year
- 7.2.4. Chart - Global Market by Application - Final Year
- 7.2.5. Chart - Global Market by Application - Share by Year
- 7.2.6. Chart - Global Market by Application - Segment Growth
- 7.3. Global Market by Technology - Overview
- 7.3.1. Table - Global Market by Technology
- 7.3.2. Chart - Global Market by Technology - Base/Final Year Comparison
- 7.3.3. Chart - Global Market by Technology - Base Year
- 7.3.4. Chart - Global Market by Technology - Final Year
- 7.3.5. Chart - Global Market by Technology - Share by Year
- 7.3.6. Chart - Global Market by Technology - Segment Growth
- 7.4. Global Market by Place - Overview
- 7.4.1. Table - Global Market by Place
- 7.4.2. Chart - Global Market by Place - Base/Final Year Comparison
- 7.4.3. Chart - Global Market by Place - Base Year
- 7.4.4. Chart - Global Market by Place - Final Year
- 7.4.5. Chart - Global Market by Place - Share by Year
- 7.4.6. Chart - Global Market by Place - Segment Growth
- 7.5. Global Market by Product - Overview
- 7.5.1. Table - Global Market by Product
- 7.5.2. Chart - Global Market by Product - Base/Final Year Comparison
- 7.5.3. Chart - Global Market by Product - Base Year
- 7.5.4. Chart - Global Market by Product - Final Year
- 7.5.5. Chart - Global Market by Product - Share by Year
- 7.5.6. Chart - Global Market by Product - Segment Growth
8. Global Markets - By Application
- 8.1. Cancer
- 8.1.1. Table Cancer Testing - by Country
- 8.1.2. Chart - Cancer Testing Growth
- 8.2. Infectious Disease Testing
- 8.2.1. Table Infectious Disease Testing - by Country
- 8.2.2. Chart - Infectious Disease Testing Growth
- 8.3. Metabolic Testing
- 8.3.1. Table Metabolic Testing - by Country
- 8.3.2. Chart - Metabolic Testing Growth
- 8.4. Cardiac Testing
- 8.4.1. Table Cardiac Testing - by Country
- 8.4.2. Chart - Cardiac Testing Growth
- 8.5. Diabetes Testing
- 8.5.1. Table Diabetes Testing - by Country
- 8.5.2. Chart - Diabetes Testing Growth
- 8.6. Other Disease Testing
- 8.6.1. Table Other Disease Testing - by Country
- 8.6.2. Chart - Other Disease Testing Growth
9. Global Markets - By Technology
- 9.1. NGS Technology
- 9.1.1. Table NGS Technology - by Country
- 9.1.2. Chart - NGS Technology Growth
- 9.2. PCR Technology
- 9.2.1. Table PCR Technology - by Country
- 9.2.2. Chart - PCR Technology Growth
- 9.3. Chemistry/IA Technology
- 9.3.1. Table Chemistry/IA Technology - by Country
- 9.3.2. Chart - Chemistry/IA Technology Growth
- 9.4. Pathology Technology
- 9.4.1. Table Pathology Technology - by Country
- 9.4.2. Chart - Pathology Technology Growth
- 9.5. Other Technology
- 9.5.1. Table Other Technology - by Country
- 9.5.2. Chart - Other Technology Growth
10. Global Markets - By Place
- 10.1. Research
- 10.1.1. Table Research - by Country
- 10.1.2. Chart - Research Growth
- 10.2. Pharmaceutical Research
- 10.2.1. Table Pharmaceutical Research - by Country
- 10.2.2. Chart - Pharmaceutical Research Growth
- 10.3. Clinical
- 10.3.1. Table Clinical - by Country
- 10.3.2. Chart - Clinical Growth
- 10.4. Other Place
- 10.4.1. Table Other Place - by Country
- 10.4.2. Chart - Other Place Growth
11. Global Markets - By Product
- 11.1. Instruments
- 11.1.1. Table Instruments - by Country
- 11.1.2. Chart - Instruments Growth
- 11.2. Assay
- 11.2.1. Table Assay - by Country
- 11.2.2. Chart - Assay Growth
- 11.3. Software
- 11.3.1. Table Software - by Country
- 11.3.2. Chart - Software Growth
- 11.4. Services
- 11.4.1. Table Services - by Country
- 11.4.2. Chart - Services Growth
- 11.5. Other Product
- 11.5.1. Table Other Product - by Country
- 11.5.2. Chart - Other Product Growth
12. Appendices
- 12.1. United States Clinical Laboratory Fees Schedule
- 12.1.1. Laboratory Fees Schedule
- 12.1.2. The Most Used IVD Assays
- 12.1.3. The Highest Grossing Assays


