|
|
市場調査レポート
商品コード
1507974
コンピュータ断層撮影(CT)の世界市場:用途別、技術別、場所別、製品別 - エグゼクティブコンサルタントガイド付き(2024年~2028年)Computed Tomography (CT) Markets by Application, By Technology, By Place and By Product with Executive and Consultant Guides 2024-2028 |
||||||
|
|||||||
|
|||||||

| コンピュータ断層撮影(CT)の世界市場:用途別、技術別、場所別、製品別 - エグゼクティブコンサルタントガイド付き(2024年~2028年) |
|
出版日: 2024年07月05日
発行: Howe Sound Research
ページ情報: 英文 192 Pages
納期: 即日から翌営業日
|

全表示
- 概要
- 図表
- 目次
当レポートは、世界のコンピュータ断層撮影(CT)市場について調査し、市場の概要とともに、用途別、技術別、場所別、製品別動向、および市場に参入する企業のプロファイルなどを提供しています。
目次
第1章 市場ガイド
第2章 イントロダクションと市場の定義
- コンピュータ断層撮影とは何か
- 市場の定義
- 調査手法
- 視点:ヘルスケアと画像産業
第3章 市場概要
- 市場参入組織
- 学術調査室
- 計測機器サプライヤー
- メディアサプライヤー
- 病院放射線科
- 病院放射線治療
- 画像センター
- コンピュータ断層撮影
- 医療用途
- 産業構造の影響
- 技術の戦場
第4章 市場動向
- 成長促進要因
- 成長制限要因
第5章 最近の動向
第6章 主要企業のプロファイル
- Agfa Healthcare
- Bruker
- Canon Medical Systems
- Fujifilm
- GE Healthcare
- Hologic
- Mindray
- Neurologica
- Neusoft Medical Systems
- Orimtech
- Philips Healthcare
- Siemens Healthineers
- Shanghai United Imaging
- Shimadzu Corporation
第7章 世界のコンピュータ断層撮影市場
- 国別世界市場概要
- 用途別世界市場概要
- 技術別世界市場概要
- 地域別世界市場概要
- 製品別世界市場概要
第8章 世界市場- 用途別
- 腫瘍
- 神経
- 心臓病
- 筋骨格
- その他
第9章 世界市場- 技術別
- ハイスライス
- ミッドスライス
- 円錐
- スペクトル
- 光子/その他
第10章 世界の市場- 場所別
- 病院
- イメージングセンター
- 歯科センター
- 動物病院
- オフィスおよびその他
第11章 世界市場- 製品別
- 機器
- メディア
- ソフトウェア
- サービス
Table of Tables
- Table 1 Market Players by Type
- Table 2 Five Factors Driving Growth
- Table 3 Four Factors Limiting Growth
- Table 4 Global Market by Region
- Table 5 Global Market by Application
- Table 6 Global Market by Technology
- Table 7 Global Market by Place
- Table 8 Global Market by Product
- Table 9 Oncology by Country
- Table 10 Neurology by Country
- Table 11 Cardiology by Country
- Table 12 MuscoSkeletal by Country
- Table 13 Other Application by Country
- Table 14 HiSlice by Country
- Table 15 MidSlice by Country
- Table 16 Cone by Country
- Table 17 Spectral by Country
- Table 18 Photon/Other by Country
- Table 19 Hospital by Country
- Table 20 Imaging Center by Country
- Table 21 Dental by Country
- Table 22 Veterinary by Country
- Table 23 Office and Other by Country
- Table 24 Instruments by Country
- Table 25 Media by Country
- Table 26 Software by Country
- Table 27 Service by Country
Table of Figures
- Figure 1 A Typical CT Scanner
- Figure 2 Global Healthcare Spending
- Figure 3 The Road to Imaging
- Figure 4 The Changing Age of The World's Population
- Figure 5 Health Care Consumption by Age
- Figure 6 Cancer Incidence-Age at Diagnosis
- Figure 7 Global Market Pareto Chart
- Figure 8 Global Market by Application-Base vs. Final Year
- Figure 9 Application Market Base Year
- Figure 10 Application Market Final Year
- Figure 11 Application Share by Year
- Figure 12 Application Segment Growth
- Figure 13 Global Market by Technology-Base vs. Final Year
- Figure 14 Technology Market Base Year
- Figure 15 Technology Market Final Year
- Figure 16 Technology Share by Year
- Figure 17 Technology Segment Growth
- Figure 18 Global Market by Place-Base vs. Final Year
- Figure 19 Place Market Base Year
- Figure 20 Place Market Final Year
- Figure 21 Place Share by Year
- Figure 22 Place Segment Growth
- Figure 23 by Product-Base vs. Final Year
- Figure 24 by Product Market Base Year
- Figure 25 by Product Market Final Year
- Figure 26 by Product Share by Year
- Figure 27 by Product Segment Growth
- Figure 28 Oncology Growth
- Figure 29 Neurology Growth
- Figure 30 Cardiology Growth
- Figure 31 MuscoSkeletal Growth
- Figure 32 Other Application Growth
- Figure 33 HiSlice Growth
- Figure 34 MidSlice Growth
- Figure 35 Cone Growth
- Figure 36 Spectral Growth
- Figure 37 Photon/Other Growth
- Figure 38 Hospital Growth
- Figure 39 Imaging Center Growth
- Figure 40 Dental Growth
- Figure 41 Veterinary Growth
- Figure 42 Office and Other Growth
- Figure 43 Instruments Growth
- Figure 44 Media Growth
- Figure 45 Software Growth
OVERVIEW:
Photon counting? More slices? Where does advancement stop? Now Mobile and Point of Care are taking a new lead. This exciting imaging market is driving into new territory driven by greater capability and impressive medical research results. Find out all about it in this comprehensive report.
What is the impact of falling costs? What new market segments are being created? Why is growth so strong? What about Veterinary and Dental applications?
The Computer Tomography Markets report provides data that analysts and planners can use. Forecast demand for new testing regimes or technologies. Make research investment decisions. Assistance in providing specific growth and market size estimates normally provided without additional charges. Existing hospitals can use the information directly to forecast and plan for clinical facilities growth. Again, assistance in using the information is normally provided without additional charges.
The report includes detailed breakouts for 18 Countries and 4 Regions. A detailed breakout for any country in the world is available to purchasers of the report.
ABOUT THE LEAD AUTHOR:
Mr. Greg Powell, B.SC., M.B.A is the President of Howe Sound Research. He is an experienced business and clinical professional. He is co-author of the paper "The Radioimmunoassay of Angiotensinogen by Antibody Trapping." He has worked in laboratory testing and management for over 20 years. Mr. Powell's education includes:
- B.Sc. (Chemistry) University of BC
- M.B.A. (Finance and Policy) University of BC
- Market Research Seminar - Burke Institute
- Finance for Senior Executives - Harvard Business School
Table of Contents
1 Market Guides
- 1.1 Strategic Situation Analysis
- 1.2 Guide for Executives and Business Development Staff
- 1.3 Guide for Management Consultants and Investment Advisors
2 Introduction and Market Definition
- 2.1 What is Computed Tomography?
- 2.2 Market Definition
- 2.2.1 Revenue Market Size
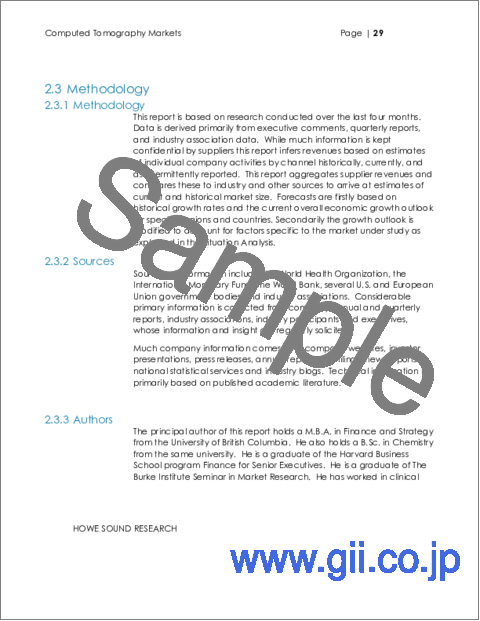
- 2.3 Methodology
- 2.3.1 Methodology
- 2.3.2 Sources
- 2.3.3 Authors
- 2.4 Perspective: Healthcare and the Imaging Industry
- 2.4.1 Global Healthcare Spending
- 2.4.2 Spending on Imaging
- 2.4.3 Important Role of Insurance
3 Market Overview
- 3.1 Players in a Dynamic Market
- 3.1.1 Academic Research Lab
- 3.1.2 Instrumentation Supplier
- 3.1.3 Media Supplier
- 3.1.4 Hospital Radiology
- 3.1.5 Hospital Radiotherapy
- 3.1.6 Imaging Centers
- 3.2 Computed Tomography
- 3.2.1 Sequential CT
- 3.2.2 Spiral CT
- 3.2.3 Electron beam tomography
- 3.2.4 Dual Energy CT
- 3.2.5 CT perfusion imaging
- 3.2.6 PET CT
- 3.2.7 Photon Counting
- 3.3 Medical Application
- 3.3.1 Head
- 3.3.2 Neck
- 3.3.3 Lungs
- 3.3.4 Angiography
- 3.3.5 Cardiac
- 3.3.6 Abdomen and pelvis
- 3.3.7 Axial skeleton and extremities
- 3.3.8 Biomechanical use
- 3.4 Structure of Industry Plays a Part
- 3.4.1 Hospital Market Share
- 3.4.2 Throughput and Capital Cost Issues
- 3.4.2.1 Throughput and Efficiency
- 3.4.2.2 Patient Throughput and Revenue Generation
- 3.4.2.3 Imaging Center Competitiveness
- 3.4.2.4 Capital Cost and Return on Investment
- 3.4.2.5 Balancing Capital Investment and Performance
- 3.4.2.6 Market Segmentation
- 3.4.2.7 Technological Advancements
- 3.4.2.8 Impact on Patient Care
- 3.4.3 Impact of Aritificial Intelligence
- 3.4.4 Imaging Centers on the Move
- 3.4.4.1 Technological Advancements
- 3.4.4.2 Increasing Disease Burden
- 3.4.4.3 Growing Awareness and Preventive Health Initiatives
- 3.4.4.4 Aging Population
- 3.4.4.5 Telemedicine and Teleradiology
- 3.4.4.6 AI Integration
- 3.4.4.7 Oncology and Personalized Medicine
- 3.4.4.8 Point-of-Care Imaging
- 3.4.4.9 Global Healthcare Investment
- 3.4.5 Changing Role of Physicians
- 3.4.5.1 Shift towards Team-Based Care
- 3.4.5.2 Utilization of Technology and Diagnostic Tools
- 3.4.5.3 Emphasis on Data-Driven Diagnosis
- 3.4.5.4 Focus on Preventive Medicine
- 3.4.5.5 Patient-Centered Diagnosis
- 3.4.5.6 Telemedicine and Remote Diagnosis
- 3.5 Technology Battlegrounds
- 3.5.1 Slice Count
- 3.5.2 Manufacturers and AI Integration
- 3.5.3 A Changing Cardiology Market
- 3.5.4 The Mobility Trend
- 3.5.4.1 Role of Mobile CT Scanning Instruments:
- 3.5.5 Spectral Dual Energy Dual Source
- 3.5.5.1 Advantages of Spectral Dual Source
- 3.5.5.2 Applications and Outlook for Spectral Dual Source
- 3.5.5.3 Future Developments
- 3.5.6 Photon Counting the Elephant in the Room
4 Market Trends
- 4.1 Factors Driving Growth
- 4.1.1 Level of Care
- 4.1.2 Cardiology
- 4.1.3 The New Oncology
- 4.1.4 Liability
- 4.1.5 The Aging Effect
- 4.2 Factors Limiting Growth
- 4.2.1 Market Maturity
- 4.2.2 Protocol Resistance
- 4.2.3 Regulation and coverage
5 Recent Developments
- 5.1 Recent Developments - Importance and How to Use This Section
- 5.1.1 Importance of These Developments
- 5.1.2 How to Use This Section
- 5.2 FDA Clears New 128-Slice CT System from Fujifilm
- 5.3 FDA Clears CT-Based AI Software
- 5.4 Photon-Counting CT Shows Promise
- 5.5 FDA Clears AI-Powered CT Segmentation Tool
- 5.6 Preference For CT Angiography Over Invasive Angiography
- 5.7 Photon Counting CT a Better Option
- 5.8 Orimtech Developing new imaging technologies
- 5.9 Photon-counting CT Can Evaluate Lung Function
- 5.10 United Imaging Debuts Three New Scanners
- 5.11 Photon-counting CT Detects Heart Disease
- 5.12 GE HealthCare Wins $30 Million Purchase of CT Powered by Artificial Intelligence
- 5.13 Philips Launches AI-powered CT System for High-volume Screening
- 5.14 AI Can Optimize CT Scan X-ray Radiation Dose
- 5.15 Photon-Counting CT Enables Lower Contrast Media
- 5.16 GE HealthCare to Acquire IMACTIS
- 5.17 NeuroLogica BodyTom 64 Gets FDA Clearance
6 Profiles of Key Players
- 6.1 Agfa Healthcare
- 6.2 Bruker
- 6.3 Canon Medical Systems
- 6.4 Fujifilm
- 6.5 GE Healthcare
- 6.6 Hologic
- 6.7 Mindray
- 6.8 Neurologica
- 6.9 Neusoft Medical Systems
- 6.10 Orimtech
- 6.11 Philips Healthcare
- 6.12 Siemens Healthineers
- 6.13 Shanghai United Imaging
- 6.14 Shimadzu Corporation
7 The Global Market for Computed Tomography
- 7.1 Global Market Overview by Country
- 7.1.1 Table - Global Market by Country
- 7.1.2 Chart-Global Market by Country
- 7.2 Global Market by Application-Overview
- 7.2.1 Table - Global Market by Application
- 7.2.2 Chart - Global Market by Application - Base/Final Year Comparison
- 7.2.3 Chart - Global Market by Application - Base Year
- 7.2.4 Chart - Global Market by Application - Final Year
- 7.2.5 Chart - Global Market by Application - Share by Year
- 7.2.6 Chart - Global Market by Application - Segment Growth
- 7.3 Global Market by Technology-Overview
- 7.3.1 Table - Global Market by Technology
- 7.3.2 Chart - Global Market by Technology - Base/Final Year Comparison
- 7.3.3 Chart - Global Market by Technology - Base Year
- 7.3.4 Chart - Global Market by Technology - Final Year
- 7.3.5 Chart - Global Market by Technology - Share by Year
- 7.3.6 Chart - Global Market by Technology - Segment Growth
- 7.4 Global Market by Place-Overview
- 7.4.1 Table - Global Market by Place
- 7.4.2 Chart - Global Market by Place - Base/Final Year Comparison
- 7.4.3 Chart - Global Market by Place - Base Year
- 7.4.4 Chart - Global Market by Place - Final Year
- 7.4.5 Chart - Global Market by Place - Share by Year
- 7.4.6 Chart - Global Market by Place - Segment Growth
- 7.5 Global Market by Product-Overview
- 7.5.1 Table - Global Market by Product
- 7.5.2 Chart - Global Market by Product - Base/Final Year Comparison
- 7.5.3 Chart - Global Market by Product - Base Year
- 7.5.4 Chart - Global Market by Product - Final Year
- 7.5.5 Chart - Global Market by Product - Share by Year
- 7.5.6 Chart - Global Market by Product - Segment Growth
8 Global Markets - By Application
- 8.1 Oncology
- 8.1.1 Table Oncology - by Country
- 8.1.2 Chart-Oncology Growth
- 8.2 Neurology
- 8.2.1 Table Neurology - by Country
- 8.2.2 Chart-Neurology Growth
- 8.3 Cardiology
- 8.3.1 Table Cardiology - by Country
- 8.3.2 Chart-Cardiology Growth
- 8.4 MuscoSkeletal
- 8.4.1 Table MuscoSkeletal - by Country
- 8.4.2 Chart-MuscoSkeletal Growth
- 8.5 Other Application
- 8.5.1 Table Other Application - by Country
- 8.5.2 Chart-Other Application Growth
9 Global Markets - By Technology
- 9.1 HiSlice
- 9.1.1 Table HiSlice - by Country
- 9.1.2 Chart-HiSlice Growth
- 9.2 MidSlice
- 9.2.1 Table MidSlice - by Country
- 9.2.2 Chart-MidSlice Growth
- 9.3 Cone
- 9.3.1 Table Cone - by Country
- 9.3.2 Chart-Cone Growth
- 9.4 Spectral
- 9.4.1 Table Spectral - by Country
- 9.4.2 Chart-Spectral Growth
- 9.5 Photon/Other
- 9.5.1 Table Photon/Other - by Country
- 9.5.2 Chart-Photon/Other Growth
10 Global Markets - By Place
- 10.1 Hospital
- 10.1.1 Table Hospital - by Country
- 10.1.2 Chart - Hospital Growth
- 10.2 Imaging Center
- 10.2.1 Table Imaging Center - by Country
- 10.2.2 Chart-Imaging Center Growth
- 10.3 Dental Center
- 10.3.1 Table Dental - by Country
- 10.3.2 Chart-Dental Center Growth
- 10.4 Veterinary
- 10.4.1 Table Veterinary - by Country
- 10.4.2 Chart-Veterinary Growth
- 10.5 Office and Other
- 10.5.1 Table Office and Other - by Country
- 10.5.2 Chart-Office and Other Growth
11 Global Markets - by Product
- 11.1 Instruments
- 11.1.1 Table Instruments - by Country
- 11.1.2 Chart-Instruments Growth
- 11.2 Media
- 11.2.1 Table Media - by Country
- 11.2.2 Chart-Media Growth
- 11.3 Software
- 11.3.1 Table Software - by Country
- 11.3.2 Chart-Software Growth
- 11.4 Service
- 11.4.1 Table Service - by Country
- 11.4.2 Chart-Service Growth

