|
|
市場調査レポート
商品コード
1588726
電動キックスクーターの市場規模、シェア、動向分析レポート:バッテリータイプ別、駆動タイプ別、製品タイプ別、最終用途別、地域別、セグメント別予測、2025年~2030年Electric Kick Scooter Market Size, Share & Trends Analysis Report By Battery Type ( Lead-acid Battery, Lithium-ion Battery), By Drive Type, By Product, By End-use (Personal, Commercial), By Region, And Segment Forecasts, 2025 - 2030 |
||||||
|
|||||||
カスタマイズ可能
|
|||||||


| 電動キックスクーターの市場規模、シェア、動向分析レポート:バッテリータイプ別、駆動タイプ別、製品タイプ別、最終用途別、地域別、セグメント別予測、2025年~2030年 |
|
出版日: 2024年10月30日
発行: Grand View Research
ページ情報: 英文 130 Pages
納期: 2~10営業日
|

全表示
- 概要
- 図表
- 目次
電動キックスクーター市場の成長と動向:
Grand View Research, Inc.の調査によると、電動キックスクーターの世界市場規模は122億7,000万米ドルに達し、2025年から2030年にかけてCAGR 11.9%を記録すると予測されています。
市場成長の背景には、世界中で費用対効果の高い電動スクーターのシェアリングサービスの浸透が進んでいることがあります。
同市場は長期的には有望な成長機会を目の当たりにすることが期待されるが、COVID-19の大流行が市場に悪影響を及ぼす可能性が高いです。2020年前半の輸送活動に対する厳格な制限と封鎖は、世界中のe-kickスクーター小売事業活動を麻痺させました。製造やサプライチェーン活動が大きく中断された一方で、メーカーや販売店にとっては特に厳しい状況となった。パンデミック後、既存の車両を電気自動車に置き換える政府の取り組みや、ライドシェアリングサービス市場に参入するe-kickスクーターメーカーの増加が市場を後押ししています。
製品の差別化の必要性と次世代技術のイントロダクションは、e-キックスクーター市場の成長に有利に働くと予想されます。需要を押し上げると予想される主な要因の1つは、大都市における駐車スペースの縮小です。さらに、スクーターは米国、ドイツ、フランス、スペインなどの国々で脚光を浴びています。交通渋滞を避ける必要性の高まりと超小型モビリティ・オプションへの需要の増加が、折りたたみ式電動キックスクーターの製造をベンダーに促しています。これらの折りたたみ式電動キックスクーターは、携帯可能で軽量であり、メンテナンスコストが低いため、消費者に広く好まれています。
温室効果ガス排出量の増加により、eモビリティに期待される気候変動対策への取り組みが始まっています。世界のいくつかの国では、持続可能で環境に優しい交通手段を採用することで自動車の排出量を削減する気候変動対策計画を制定し始めています。さらに、クリーンエネルギーへの投資やCO2排出を抑制するための各国政府による取り組みが、今後数年間でe-キックスクーターの需要を押し上げると予想されています。
北米は、今後数年間で最も急成長する地域となる見込みです。この地域の高い成長は、米国とカナダでの急速な普及率に起因しています。同地域の人々の関心は、短距離の通勤や地元の観光のために技術的に先進的な電動キックスクーターを購入することに移っています。
電動キックスクーター市場レポートハイライト
- リチウムイオンバッテリーセグメントが2024年に92.1%の最大シェアを占める。鉛蓄電池に対するリチウムイオン電池の性能と環境の優位性により、リチウムイオン技術は今後数年間で世界の主流電池技術として位置づけられると予想されます。
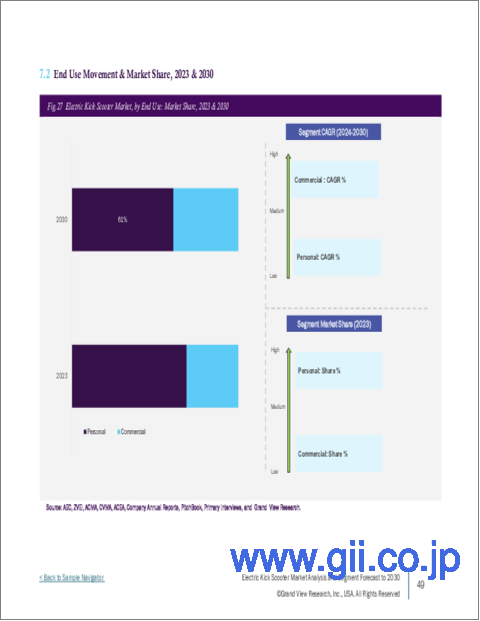
- 2024年にはパーソナル・セグメントが市場を独占します。同セグメントは60%以上の市場シェアを占めると予想されます。
- 欧州の電動キックスクーター市場は、2024年に有利な地域と認識され、全体シェアの58.76%を占めました。
目次
第1章 調査手法と範囲
第2章 エグゼクティブサマリー
第3章 電動キックスクーター市場の変数、動向、範囲
- 市場系統の見通し
- 市場力学
- 市場 促進要因分析
- 市場抑制要因分析
- 業界の課題
- 電動キックスクーター市場分析ツール
- 業界分析- ポーターのファイブフォース分析
- PESTEL分析
第4章 電動キックスクーター市場:バッテリータイプの推定・動向分析
- セグメントダッシュボード
- 電動キックスクーター市場:バッテリータイプの変動分析、2024年と2030年
- 鉛蓄電池
- リチウムイオン電池
- その他
第5章 電動キックスクーター市場:駆動タイプの推定・動向分析
- セグメントダッシュボード
- 電動キックスクーター市場:駆動タイプ別の変動分析、2024年と2030年
- ベルトドライブ
- チェーンドライブ
- ハブモーター
第6章 電動キックスクーター市場:製品推定・動向分析
- セグメントダッシュボード
- 電動キックスクーター市場:製品変動分析、2024年および2030年
- 標準
- 折りたたみ
- 自己バランス
- マキシ
- 三輪車
第7章 電動キックスクーター市場:最終用途の推定・動向分析
- セグメントダッシュボード
- 電動キックスクーター市場:最終用途変動分析、2024年および2030年
- 個人
- 商用
第8章 電動キックスクーター市場:地域推定・動向分析
- 電動キックスクーターの市場シェア、地域別、2024年および2030年
- 北米
- 米国
- カナダ
- メキシコ
- 欧州
- 英国
- ドイツ
- フランス
- アジア太平洋
- 中国
- 日本
- インド
- 韓国
- オーストラリア
- ラテンアメリカ
- ブラジル
- 中東・アフリカ
- アラブ首長国連邦
- サウジアラビア
- 南アフリカ
第9章 競合情勢
- 企業分類
- 企業の市場ポジショニング
- 企業ヒートマップ分析
- 企業プロファイル/上場企業
- Jiangsu Xinri E-Vehicle Co. Ltd.
- Bird Rides, Inc
- iconBIT
- Niu International
- Razor USA LLC
- SEGWAY INC.
- SWAGTRON
- Xiaomi
- Yadea Technology Group Co., Ltd.
List of Tables
- Table 1 Global electric kick scooter market size estimates & forecasts, 2018 - 2030 (USD Million)
- Table 2 Global electric kick scooter market, by region, 2018 - 2030 (USD Million)
- Table 3 Global electric kick scooter market, by battery type, 2018 - 2030 (USD Million)
- Table 4 Global electric kick scooter market, by drive type, 2018 - 2030 (USD Million)
- Table 5 Global electric kick scooter market, by product, 2018 - 2030 (USD Million)
- Table 6 Global electric kick scooter market, by end use, 2018 - 2030 (USD Million)
- Table 7 Lead-acid battery market, by region, 2018 - 2030 (USD Million)
- Table 8 Lithium-ion battery market, by region, 2018 - 2030 (USD Million)
- Table 9 Others market, by region, 2018 - 2030 (USD Million)
- Table 10 Belt drive market, by region, 2018 - 2030 (USD Million)
- Table 11 Chain drive market, by region, 2018 - 2030 (USD Million)
- Table 12 Hub motors market, by region, 2018 - 2030 (USD Million)
- Table 13 Standard market, by region, 2018 - 2030 (USD Million)
- Table 14 Folding market, by region, 2018 - 2030 (USD Million)
- Table 15 Self-balancing market, by region, 2018 - 2030 (USD Million)
- Table 16 Maxi market, by region, 2018 - 2030 (USD Million)
- Table 17 Three wheeled market, by region, 2018 - 2030 (USD Million)
- Table 18 Personal market, by region, 2018 - 2030 (USD Million)
- Table 19 Commercial market, by region, 2018 - 2030 (USD Million)
- Table 20 North America electric kick scooter market, by battery type, 2018 - 2030 (USD Million)
- Table 21 North America electric kick scooter market, by drive type, 2018 - 2030 (USD Million)
- Table 22 North America electric kick scooter market, by product, 2018 - 2030 (USD Million)
- Table 23 North America electric kick scooter market, by end use, 2018 - 2030 (USD Million)
- Table 24 U.S. electric kick scooter market, by battery type, 2018 - 2030 (USD Million)
- Table 25 U.S. electric kick scooter market, by drive type, 2018 - 2030 (USD Million)
- Table 26 U.S. electric kick scooter market, by product, 2018 - 2030 (USD Million)
- Table 27 U.S. electric kick scooter market, by end use, 2018 - 2030 (USD Million)
- Table 28 Canada electric kick scooter market, by battery type, 2018 - 2030 (USD Million)
- Table 29 Canada electric kick scooter market, by drive type, 2018 - 2030 (USD Million)
- Table 30 Canada electric kick scooter market, by product, 2018 - 2030 (USD Million)
- Table 31 Canada electric kick scooter market, by end use, 2018 - 2030 (USD Million)
- Table 32 Mexico electric kick scooter market, by battery type, 2018 - 2030 (USD Million)
- Table 33 Mexico electric kick scooter market, by drive type, 2018 - 2030 (USD Million)
- Table 34 Mexico electric kick scooter market, by product, 2018 - 2030 (USD Million)
- Table 35 Mexico electric kick scooter market, by end use, 2018 - 2030 (USD Million)
- Table 36 Europe electric kick scooter market, by battery type, 2018 - 2030 (USD Million)
- Table 37 Europe electric kick scooter market, by drive type, 2018 - 2030 (USD Million)
- Table 38 Europe electric kick scooter market, by product, 2018 - 2030 (USD Million)
- Table 39 Europe electric kick scooter market, by end use, 2018 - 2030 (USD Million)
- Table 40 U.K. electric kick scooter market, by battery type, 2018 - 2030 (USD Million)
- Table 41 U.K. electric kick scooter market, by drive type, 2018 - 2030 (USD Million)
- Table 42 U.K. electric kick scooter market, by product, 2018 - 2030 (USD Million)
- Table 43 U.K. electric kick scooter market, by end use, 2018 - 2030 (USD Million)
- Table 44 Germany electric kick scooter market, by battery type, 2018 - 2030 (USD Million)
- Table 45 Germany electric kick scooter market, by drive type, 2018 - 2030 (USD Million)
- Table 46 Germany electric kick scooter market, by product, 2018 - 2030 (USD Million)
- Table 47 Germany electric kick scooter market, by end use, 2018 - 2030 (USD Million)
- Table 48 France electric kick scooter market, by battery type, 2018 - 2030 (USD Million)
- Table 49 France electric kick scooter market, by drive type, 2018 - 2030 (USD Million)
- Table 50 France electric kick scooter market, by product, 2018 - 2030 (USD Million)
- Table 51 France electric kick scooter market, by end use, 2018 - 2030 (USD Million)
- Table 52 Asia Pacific electric kick scooter market, by battery type, 2018 - 2030 (USD Million)
- Table 53 Asia Pacific electric kick scooter market, by drive type, 2018 - 2030 (USD Million)
- Table 54 Asia Pacific electric kick scooter market, by product, 2018 - 2030 (USD Million)
- Table 55 Asia Pacific electric kick scooter market, by end use, 2018 - 2030 (USD Million)
- Table 56 China electric kick scooter market, by battery type, 2018 - 2030 (USD Million)
- Table 57 China electric kick scooter market, by drive type, 2018 - 2030 (USD Million)
- Table 58 China electric kick scooter market, by product, 2018 - 2030 (USD Million)
- Table 59 China electric kick scooter market, by end use, 2018 - 2030 (USD Million)
- Table 60 India electric kick scooter market, by battery type, 2018 - 2030 (USD Million)
- Table 61 India electric kick scooter market, by drive type, 2018 - 2030 (USD Million)
- Table 62 India electric kick scooter market, by product, 2018 - 2030 (USD Million)
- Table 63 India electric kick scooter market, by end use, 2018 - 2030 (USD Million)
- Table 64 Japan electric kick scooter market, by battery type, 2018 - 2030 (USD Million)
- Table 65 Japan electric kick scooter market, by drive type, 2018 - 2030 (USD Million)
- Table 66 Japan electric kick scooter market, by product, 2018 - 2030 (USD Million)
- Table 67 Japan electric kick scooter market, by end use, 2018 - 2030 (USD Million)
- Table 68 Australia electric kick scooter market, by battery type, 2018 - 2030 (USD Million)
- Table 69 Australia electric kick scooter market, by drive type, 2018 - 2030 (USD Million)
- Table 70 Australia electric kick scooter market, by product, 2018 - 2030 (USD Million)
- Table 71 Australia electric kick scooter market, by end use, 2018 - 2030 (USD Million)
- Table 72 South Korea electric kick scooter market, by battery type, 2018 - 2030 (USD Million)
- Table 73 South Korea electric kick scooter market, by drive type, 2018 - 2030 (USD Million)
- Table 74 South Korea electric kick scooter market, by product, 2018 - 2030 (USD Million)
- Table 75 South Korea electric kick scooter market, by end use, 2018 - 2030 (USD Million)
- Table 76 Latin America electric kick scooter market, by battery type, 2018 - 2030 (USD Million)
- Table 77 Latin America electric kick scooter market, by drive type, 2018 - 2030 (USD Million)
- Table 78 Latin America electric kick scooter market, by product, 2018 - 2030 (USD Million)
- Table 79 Latin America electric kick scooter market, by end use, 2018 - 2030 (USD Million)
- Table 80 Brazil electric kick scooter market, by battery type, 2018 - 2030 (USD Million)
- Table 81 Brazil electric kick scooter market, by drive type, 2018 - 2030 (USD Million)
- Table 82 Brazil electric kick scooter market, by product, 2018 - 2030 (USD Million)
- Table 83 Brazil electric kick scooter market, by end use, 2018 - 2030 (USD Million)
- Table 84 MEA electric kick scooter market, by battery type, 2018 - 2030 (USD Million)
- Table 85 MEA electric kick scooter market, by drive type, 2018 - 2030 (USD Million)
- Table 86 MEA electric kick scooter market, by product, 2018 - 2030 (USD Million)
- Table 87 MEA electric kick scooter market, by end use, 2018 - 2030 (USD Million)
- Table 88 UAE electric kick scooter market, by battery type, 2018 - 2030 (USD Million)
- Table 89 UAE electric kick scooter market, by drive type, 2018 - 2030 (USD Million)
- Table 90 UAE electric kick scooter market, by product, 2018 - 2030 (USD Million)
- Table 91 UAE electric kick scooter market, by end use, 2018 - 2030 (USD Million)
- Table 92 KSA electric kick scooter market, by battery type, 2018 - 2030 (USD Million)
- Table 93 KSA electric kick scooter market, by drive type, 2018 - 2030 (USD Million)
- Table 94 KSA electric kick scooter market, by product, 2018 - 2030 (USD Million)
- Table 95 KSA electric kick scooter market, by end use, 2018 - 2030 (USD Million)
- Table 96 South Africa electric kick scooter market, by battery type, 2018 - 2030 (USD Million)
- Table 97 South Africa electric kick scooter market, by drive type, 2018 - 2030 (USD Million)
- Table 98 South Africa electric kick scooter market, by product, 2018 - 2030 (USD Million)
- Table 99 South Africa electric kick scooter market, by end use, 2018 - 2030 (USD Million)
List of Figures
- Fig. 1 Electric kick scooter market segmentation
- Fig. 2 Market research process
- Fig. 3 Information procurement
- Fig. 4 Primary research pattern
- Fig. 5 Market research approaches
- Fig. 6 Value chain-based sizing & forecasting
- Fig. 7 Parent market analysis
- Fig. 8 Market formulation & validation
- Fig. 9 Electric kick scooter market snapshot
- Fig. 10 Electric kick scooter market segment snapshot
- Fig. 11 Electric kick scooter market competitive landscape snapshot
- Fig. 12 Market research process
- Fig. 13 Market driver relevance analysis (Current & future impact)
- Fig. 14 Market restraint relevance analysis (Current & future impact)
- Fig. 15 Electric kick scooter market, battery type outlook key takeaways (USD million)
- Fig. 16 Electric kick scooter market battery type movement analysis (USD million), 2024 & 2030
- Fig. 17 Lead-acid battery market revenue estimates and forecasts, 2018 - 2030 (USD million)
- Fig. 18 Lithium-ion battery market revenue estimates and forecasts, 2018 - 2030 (USD million)
- Fig. 19 Others market revenue estimates and forecasts, 2018 - 2030 (USD million)
- Fig. 20 Electric kick scooter market: Drive type outlook key takeaways (USD million)
- Fig. 21 Electric kick scooter market: Drive type movement analysis (USD million), 2024 & 2030
- Fig. 22 Belt drive market revenue estimates and forecasts, 2018 - 2030 (USD million)
- Fig. 23 Chain drive market revenue estimates and forecasts, 2018 - 2030 (USD million)
- Fig. 24 Hub motors market revenue estimates and forecasts, 2018 - 2030 (USD million)
- Fig. 25 Electric kick scooter market: Product outlook key takeaways (USD million)
- Fig. 26 Electric kick scooter market: Product movement analysis (USD million), 2024 & 2030
- Fig. 27 Standard market revenue estimates and forecasts, 2018 - 2030 (USD million)
- Fig. 28 Folding market revenue estimates and forecasts, 2018 - 2030 (USD million)
- Fig. 29 Self-balancing market revenue estimates and forecasts, 2018 - 2030 (USD million)
- Fig. 30 Maxi market revenue estimates and forecasts, 2018 - 2030 (USD million)
- Fig. 31 Three wheeled market revenue estimates and forecasts, 2018 - 2030 (USD million)
- Fig. 32 Electric kick scooter market: End use outlook key takeaways (USD million)
- Fig. 33 Electric kick scooter market: End use movement analysis (USD million), 2024 & 2030
- Fig. 34 Personal market revenue estimates and forecasts, 2018 - 2030 (USD million)
- Fig. 35 Commercial market revenue estimates and forecasts, 2018 - 2030 (USD million)
- Fig. 36 Regional marketplace: Key takeaways
- Fig. 37 Electric kick scooter market: Regional outlook, 2024 & 2030, USD Million
- Fig. 38 North America electric kick scooter market estimates and forecasts, 2018 - 2030 (USD million)
- Fig. 39 U.S. electric kick scooter market estimates and forecasts, 2018 - 2030 (USD million)
- Fig. 40 Canada electric kick scooter market estimates and forecasts, 2018 - 2030 (USD million)
- Fig. 41 Mexico electric kick scooter market estimates and forecasts, 2018 - 2030 (USD million)
- Fig. 42 Europe electric kick scooter market estimates and forecasts, 2018 - 2030 (USD million)
- Fig. 43 U.K. electric kick scooter market estimates and forecasts, 2018 - 2030 (USD million)
- Fig. 44 Germany electric kick scooter market estimates and forecasts, 2018 - 2030 (USD million)
- Fig. 45 France electric kick scooter market estimates and forecasts, 2018 - 2030 (USD million)
- Fig. 46 Asia Pacific electric kick scooter market estimates and forecasts, 2018 - 2030 (USD million)
- Fig. 47 Japan electric kick scooter market estimates and forecasts, 2018 - 2030 (USD million)
- Fig. 48 China electric kick scooter market estimates and forecasts, 2018 - 2030 (USD million)
- Fig. 49 India electric kick scooter market estimates and forecasts, 2018 - 2030 (USD million)
- Fig. 50 Australia electric kick scooter market estimates and forecasts, 2018 - 2030 (USD million)
- Fig. 51 South Korea electric kick scooter market estimates and forecasts, 2018 - 2030 (USD million)
- Fig. 52 Latin America electric kick scooter market estimates and forecasts, 2018 - 2030 (USD million)
- Fig. 53 Brazil electric kick scooter market estimates and forecasts, 2018 - 2030 (USD million)
- Fig. 54 MEA electric kick scooter market estimates and forecasts, 2018 - 2030 (USD million)
- Fig. 55 KSA electric kick scooter market estimates and forecasts, 2018 - 2030 (USD million)
- Fig. 56 UAE electric kick scooter market estimates and forecasts, 2018 - 2030 (USD million)
- Fig. 57 South Africa electric kick scooter market estimates and forecasts, 2018 - 2030 (USD million)
- Fig. 58 Strategy framework
- Fig. 59 Company Categorization
Electric Kick Scooter Market Growth & Trends:
The global electric kick scooter market size is expected to reach USD 12.27 billion and register a CAGR of 11.9% from 2025 to 2030, according to a study conducted by Grand View Research, Inc. The market growth is attributed to the increasing penetration of cost-effective electric scooter sharing services across the globe.
While the market is expected to witness promising growth opportunities in the long run, the COVID-19 pandemic is likely to negatively impact the market. Strict restrictions on transportation activities and lockdowns in the first half of 2020 paralyzed e-kick scooter retail business activities across the globe. While manufacturing and supply chain activities were severely disrupted, the situation was particularly challenging for manufacturers and dealers. Post pandemic, government initiatives to replace existing fleet with an electric vehicle, and more and more e-kick scooter manufacturers entering the ride sharing service market is propelling the market.
The need for product differentiation and the introduction of next-generation technology is anticipated to favor the e-kick scooter market growth. One of the key factors expected to boost the demand is shrinking parking spaces in metro cities. Moreover, scooters have gained prominence in countries such as the U.S., Germany, France, and Spain. The growing need to avoid traffic congestion and increased demand for micro-mobility options have encouraged vendors to manufacture folding electric kick scooters. These foldable electric kick scooters are portable, lightweight, and require low maintenance cost thus they are widely preferred by consumers end.
An increase in greenhouse gas emissions has resulted in initiatives to combat climate change with hopes pinned on e-mobility. Several countries globally have started enacting climate change action plans to reduce vehicular emissions by adopting sustainable and eco-friendly transportation options. Furthermore, investments in clean energy and initiatives taken by governments to curb CO2 emissions are expected to boost the demand for e-kick scooters over the coming years.
North America is expected to be the fastest-growing region over the next few years. The high growth of the region is attributed to the rapid rate of adoption in the U.S. and Canada. The people in the region have shifted their interest towards buying the technologically advanced e kick scooter for short distance commutes and local site seeing.
Electric Kick Scooter Market Report Highlights:
- The lithium-ion battery segment accounted for the largest share of 92.1% in 2024. Performance and environmental advantages of Li-Ion batteries over lead acid batteries are expected to position Li-Ion technology as the global mainstream battery technology in the coming years.
- The personal segment dominated the market in 2024. The segment is expected to hold more than 60% market share.
- The electric kick scooter market in Europe was identified as a lucrative region in 2024 and accounted for 58.76% of the overall share.
Table of Contents
Chapter 1. Methodology and Scope
- 1.1. Market Segmentation and Scope
- 1.2. Research Methodology
- 1.2.1. Information Procurement
- 1.3. Information or Data Analysis
- 1.4. Methodology
- 1.5. Research Scope and Assumptions
- 1.6. Market Formulation & Validation
- 1.7. Country Based Segment Share Calculation
- 1.8. List of Data Sources
Chapter 2. Executive Summary
- 2.1. Market Outlook
- 2.2. Segment Outlook
- 2.3. Competitive Insights
Chapter 3. Electric Kick Scooter Market Variables, Trends, & Scope
- 3.1. Market Lineage Outlook
- 3.2. Market Dynamics
- 3.2.1. Market Driver Analysis
- 3.2.2. Market Restraint Analysis
- 3.2.3. Industry Challenge
- 3.3. Electric Kick Scooter Market Analysis Tools
- 3.3.1. Industry Analysis - Porter's
- 3.3.1.1. Bargaining power of the suppliers
- 3.3.1.2. Bargaining power of the buyers
- 3.3.1.3. Threats of substitution
- 3.3.1.4. Threats from new entrants
- 3.3.1.5. Competitive rivalry
- 3.3.2. PESTEL Analysis
- 3.3.2.1. Political landscape
- 3.3.2.2. Economic landscape
- 3.3.2.3. Social landscape
- 3.3.2.4. Technological landscape
- 3.3.2.5. Environmental landscape
- 3.3.2.6. Legal landscape
- 3.3.1. Industry Analysis - Porter's
Chapter 4. Electric Kick Scooter Market: Battery Type Estimates & Trend Analysis
- 4.1. Segment Dashboard
- 4.2. Electric Kick Scooter Market: Battery Type Movement Analysis, 2024 & 2030 (USD Million)
- 4.3. Lead-acid Battery
- 4.3.1. Lead-acid Battery Market Revenue Estimates and Forecasts, 2018 - 2030 (USD Million)
- 4.4. Lithium-ion Battery
- 4.4.1. Lithium-ion Battery Market Revenue Estimates and Forecasts, 2018 - 2030 (USD Million)
- 4.5. Others
- 4.5.1. Others Market Revenue Estimates and Forecasts, 2018 - 2030 (USD Million)
Chapter 5. Electric Kick Scooter Market: Drive Type Estimates & Trend Analysis
- 5.1. Segment Dashboard
- 5.2. Electric Kick Scooter Market: Drive Type Movement Analysis, 2024 & 2030 (USD Million)
- 5.3. Belt Drive
- 5.3.1. Belt Drive Market Revenue Estimates and Forecasts, 2018 - 2030 (USD Million)
- 5.4. Chain Drive
- 5.4.1. Chain Drive Market Revenue Estimates and Forecasts, 2018 - 2030 (USD Million)
- 5.5. Hub Motors
- 5.5.1. Hub Motors Market Revenue Estimates and Forecasts, 2018 - 2030 (USD Million)
Chapter 6. Electric Kick Scooter Market: Product Estimates & Trend Analysis
- 6.1. Segment Dashboard
- 6.2. Electric Kick Scooter Market: Product Movement Analysis, 2024 & 2030 (USD Million)
- 6.3. Standard
- 6.3.1. Standard Market Revenue Estimates and Forecasts, 2018 - 2030 (USD Million)
- 6.4. Folding
- 6.4.1. Folding Cards Market Revenue Estimates and Forecasts, 2018 - 2030 (USD Million)
- 6.5. Self-balancing
- 6.5.1. Self-balancing Market Revenue Estimates and Forecasts, 2018 - 2030 (USD Million)
- 6.6. Maxi
- 6.6.1. Maxi Market Revenue Estimates and Forecasts, 2018 - 2030 (USD Million)
- 6.7. Three wheeled
- 6.7.1. Three wheeled Market Revenue Estimates and Forecasts, 2018 - 2030 (USD Million)
Chapter 7. Electric Kick Scooter Market: End Use Estimates & Trend Analysis
- 7.1. Segment Dashboard
- 7.2. Electric Kick Scooter Market: End Use Movement Analysis, 2024 & 2030 (USD Million)
- 7.3. Personal
- 7.3.1. Personal Market Revenue Estimates and Forecasts, 2018 - 2030 (USD Million)
- 7.4. Commercial
- 7.4.1. Commercial Market Revenue Estimates and Forecasts, 2018 - 2030 (USD Million)
Chapter 8. Electric Kick Scooter Market: Regional Estimates & Trend Analysis
- 8.1. Electric Kick Scooter Market Share, By Region, 2024 & 2030, USD Million
- 8.2. North America
- 8.2.1. North America Electric Kick Scooter Market Estimates and Forecasts, 2018 - 2030 (USD Million)
- 8.2.2. U.S.
- 8.2.2.1. U.S. Electric Kick Scooter Market Estimates and Forecasts, 2018 - 2030 (USD Million)
- 8.2.3. Canada
- 8.2.3.1. Canada Electric Kick Scooter Market Estimates and Forecasts, 2018 - 2030 (USD Million)
- 8.2.4. Mexico
- 8.2.4.1. Mexico Electric Kick Scooter Market Estimates and Forecasts, 2018 - 2030 (USD Million)
- 8.3. Europe
- 8.3.1. Europe Electric Kick Scooter Market Estimates and Forecasts, 2018 - 2030 (USD Million)
- 8.3.2. U.K.
- 8.3.2.1. U.K. Electric Kick Scooter Market Estimates and Forecasts, 2018 - 2030 (USD Million)
- 8.3.3. Germany
- 8.3.3.1. Germany Electric Kick Scooter Market Estimates and Forecasts, 2018 - 2030 (USD Million)
- 8.3.4. France
- 8.3.4.1. France Electric Kick Scooter Market Estimates and Forecasts, 2018 - 2030 (USD Million)
- 8.4. Asia Pacific
- 8.4.1. Asia Pacific Electric Kick Scooter Market Estimates and Forecasts, 2018 - 2030 (USD Million)
- 8.4.2. China
- 8.4.2.1. China Electric Kick Scooter Market Estimates and Forecasts, 2018 - 2030 (USD Million)
- 8.4.3. Japan
- 8.4.3.1. Japan Electric Kick Scooter Market Estimates and Forecasts, 2018 - 2030 (USD Million)
- 8.4.4. India
- 8.4.4.1. India Electric Kick Scooter Market Estimates and Forecasts, 2018 - 2030 (USD Million)
- 8.4.5. South Korea
- 8.4.5.1. South Korea Electric Kick Scooter Market Estimates and Forecasts, 2018 - 2030 (USD Million)
- 8.4.6. Australia
- 8.4.6.1. Australia Electric Kick Scooter Market Estimates and Forecasts, 2018 - 2030 (USD Million)
- 8.5. Latin America
- 8.5.1. Latin America Electric Kick Scooter Market Estimates and Forecasts, 2018 - 2030 (USD Million)
- 8.5.2. Brazil
- 8.5.2.1. Brazil Electric Kick Scooter Market Estimates and Forecasts, 2018 - 2030 (USD Million)
- 8.6. Middle East and Africa
- 8.6.1. Middle East and Africa Electric Kick Scooter Market Estimates and Forecasts, 2018 - 2030 (USD Million)
- 8.6.2. UAE
- 8.6.2.1. UAE Electric Kick Scooter Market Estimates and Forecasts, 2018 - 2030 (USD Million)
- 8.6.3. KSA
- 8.6.3.1. KSA Electric Kick Scooter Market Estimates and Forecasts, 2018 - 2030 (USD Million)
- 8.6.4. South Africa
- 8.6.4.1. South Africa Electric Kick Scooter Market Estimates and Forecasts, 2018 - 2030 (USD Million)
Chapter 9. Competitive Landscape
- 9.1. Company Categorization
- 9.2. Company Market Positioning
- 9.3. Company Heat Map Analysis
- 9.4. Company Profiles/Listing
- 9.4.1. Jiangsu Xinri E-Vehicle Co. Ltd.
- 9.4.1.1. Participant's Overview
- 9.4.1.2. Financial Performance
- 9.4.1.3. Product Benchmarking
- 9.4.1.4. Strategic Initiatives
- 9.4.2. Bird Rides, Inc
- 9.4.2.1. Participant's Overview
- 9.4.2.2. Financial Performance
- 9.4.2.3. Product Benchmarking
- 9.4.2.4. Strategic Initiatives
- 9.4.3. iconBIT
- 9.4.3.1. Participant's Overview
- 9.4.3.2. Financial Performance
- 9.4.3.3. Product Benchmarking
- 9.4.3.4. Strategic Initiatives
- 9.4.4. Niu International
- 9.4.4.1. Participant's Overview
- 9.4.4.2. Financial Performance
- 9.4.4.3. Product Benchmarking
- 9.4.4.4. Strategic Initiatives
- 9.4.5. Razor USA LLC
- 9.4.5.1. Participant's Overview
- 9.4.5.2. Financial Performance
- 9.4.5.3. Product Benchmarking
- 9.4.5.4. Strategic Initiatives
- 9.4.6. SEGWAY INC.
- 9.4.6.1. Participant's Overview
- 9.4.6.2. Financial Performance
- 9.4.6.3. Product Benchmarking
- 9.4.6.4. Strategic Initiatives
- 9.4.7. SWAGTRON
- 9.4.7.1. Participant's Overview
- 9.4.7.2. Financial Performance
- 9.4.7.3. Product Benchmarking
- 9.4.7.4. Strategic Initiatives
- 9.4.8. Xiaomi
- 9.4.8.1. Participant's Overview
- 9.4.8.2. Financial Performance
- 9.4.8.3. Product Benchmarking
- 9.4.8.4. Strategic Initiatives
- 9.4.9. Yadea Technology Group Co., Ltd.
- 9.4.9.1. Participant's Overview
- 9.4.9.2. Financial Performance
- 9.4.9.3. Product Benchmarking
- 9.4.9.4. Strategic Initiatives
- 9.4.1. Jiangsu Xinri E-Vehicle Co. Ltd.

