|
|
市場調査レポート
商品コード
1632628
In Vivo CROの市場規模、シェア、動向分析レポート:モデルタイプ別、モダリティ別、適応症別、GLPタイプ別、地域別、セグメント予測、2025年~2030年In Vivo CRO Market Size, Share & Trends Analysis Report By Model Type (Rodent Based, Non-Rodent Based), By Modality (Small Molecule, Large Molecule), By Indication, By GLP Type, By Region, And Segment Forecasts, 2025 - 2030 |
||||||
|
|||||||
カスタマイズ可能
|
|||||||

| In Vivo CROの市場規模、シェア、動向分析レポート:モデルタイプ別、モダリティ別、適応症別、GLPタイプ別、地域別、セグメント予測、2025年~2030年 |
|
出版日: 2024年12月23日
発行: Grand View Research
ページ情報: 英文 150 Pages
納期: 2~10営業日
|

全表示
- 概要
- 図表
- 目次
In Vivo CRO市場の成長と動向:
Grand View Research, Inc.の最新レポートによると、世界のIn Vivo CROの市場規模は、2030年までに79億6,000万米ドルに達し、2025年から2030年までのCAGRは8.13%で拡大すると推定されています。
新興国における医薬品市場の成長、数多くのIn Vivo細胞治療に対する旺盛な需要、材料科学の急速な進歩、薬剤とデバイスの組み合わせの複雑さなどが、この地域におけるサービスの需要につながっています。加えて、In Vivo前臨床および臨床研究の増加、規制当局の承認、市場参入企業によるサービスの拡大、さまざまな疾患の負担が市場収益に寄与しています。また、新興経済諸国における前臨床および臨床サービスの低コストでのアウトソーシングの増加は、In Vivo CRO市場の成長を支える主要な要因の1つです。
同様に、新興国への医薬品のオフショアリングが増加していることも、同市場に莫大な需要を生み出しています。先進諸国における予算の精査、価格圧力、償還制度の変更は、インドや中国などの新興諸国における医薬品スポンサーによるコスト抑制策の採用を増加させると予想される主な要因の一部です。新興諸国では、前臨床In Vivoサービスなどの開発サービスを契約サービスプロバイダーにアウトソーシングすることで、品質保証・薬事サービスの需要が高まり、In Vivoアウトソーシングサービスの需要増加に寄与すると予想されます。FDA承認のための厳格なプロセスやEU地域の規制変更は、欧州での承認プロセスを複雑にしていると予想されます。これらは、製薬会社の新興国へのオフショアリングに寄与する主な要因のひとつです。
COVID-19パンデミックは当初、臨床試験業界に悪影響を与えましたが、In Vivo CRO市場も同様でした。COVID-19に対応してバイオ医薬品業界がワクチンと治療法の開発に重点を移した結果、他の疾患の臨床試験を混乱させる可能性という予期せぬ結果を招きました。細胞・遺伝子治療業界で事業を展開する企業が直面する重要な問題のひとつは、必要とされる臨床試験実施施設において、患者に治療薬を適時に提供できないことです。さらに、細胞ベースの治療薬の投与は、パンデミック後にいくつかの課題を突きつけています。病院は、SARS-CoV-2のトランスミッション、特に弱い立場の人への感染を懸念し、細胞治療サービスの提供を躊躇しています。患者は、ロックダウンや渡航禁止のために細胞治療センターを訪れることが出来なくなっています。
さらに、主要参入企業は、世界のフットプリントとサービス/製品ポートフォリオを拡大するために、M&A、パートナーシップ、協定、提携、サービス開始などの戦略に取り組んでいます。例えば、2023年4月、PsychoGenics, Inc.は、表現型創薬を強化するための薬理脳波プラットフォームであるeCubeの発売を発表しました。同様に、Biocytogenは2023年2月、特定の標的をターゲットとする100種類以上の完全ヒト型ナノボディ医薬品を開発する「ナノ100プロジェクト」を発表しました。この試みは、完全ヒト型ナノボディを産生できるマウスモデルであるBiocytogen独自のRenNanoと、先進的なin vitroおよびIn Vivo抗体スクリーニング・プラットフォームを組み合わせたものです。これらの統合技術を活用することで、バイオシトゲンは完全ヒト型ナノボディ医薬品の広範な開発を促進する態勢を整えています。
In Vivo CRO市場のレポートハイライト
- げっ歯類は遺伝的にヒトに類似しているため、一定の需要があります。また、サイズが小さく、ライフサイクルが短く、メンテナンスが容易で、遺伝資源が入手しやすいことから、In Vivo CRO調査において最も普及している動物種です。
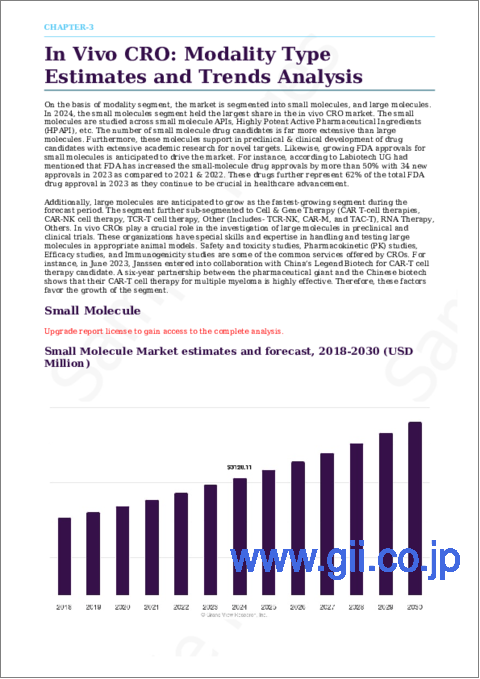
- 低分子セグメントはIn Vivo CRO市場を独占しています。この成長は、医薬品候補の開発における低分子の需要に起因しています。加えて、低分子は少量で高い治療効果を発揮することが、このセグメントの成長を後押ししています。
- がん分野はIn Vivo CROの世界市場を独占し、2024年には29.02%の売上シェアを占めました。成長の主な要因としては、がん負担の増大、新しい遺伝子治療に対する需要の急増、がん免疫療法のための前臨床試験などが挙げられます。米国遺伝子細胞治療学会によると、CAR T細胞療法の約97%はがんを適応症として開発されています。
- 中枢神経系疾患分野は、脳疾患をターゲットとした様々なモデルベースの治験薬の有効性により、最も速い成長が見込まれています。
- GLP毒性学セグメントは、特定のガイドラインに従って実施される標準化試験の増加により、2024年に最大の収益シェアを獲得して市場を独占しました。
- 北米は、2024年のIn Vivo CRO市場において50.0%の最大収益シェアを占めました。同地域の成長は、定評のある市場プレイヤーの存在、様々な疾患による負担の増加、同地域におけるCROに対する需要の高まりに起因しています。その他の成長要因は、研究開発活動、前臨床試験、市場プレイヤーのイノベーションの増加です。
目次
第1章 調査手法と範囲
第2章 エグゼクティブサマリー
第3章 In Vivo CRO市場の変数、動向、範囲
- 市場系統の見通し
- 親市場の見通し
- 関連 / 補助市場見通し
- 市場力学
- 市場促進要因分析
- 市場抑制要因分析
- In Vivo CRO市場分析ツール
- 業界分析 - ポーターのファイブフォース分析
- PESTEL分析
- COVID-19の影響分析
第4章 In Vivo CRO市場:モダリティ推定・動向分析
- In Vivo CRO市場、モダリティ別:セグメントダッシュボード
- In Vivo CRO市場、モダリティ別:変動分析
- モダリティ別、2018年~2030年
- 小分子
- 低分子市場、2018年~2030年
- 巨大分子
- 巨大分子市場、2018年~2030年
- 細胞・遺伝子治療
- RNA療法
- その他
第5章 In Vivo CRO市場:モデルタイプ推定・動向分析
- In Vivo CRO市場、モデルタイプ別:セグメントダッシュボード
- In Vivo CRO市場、モデルタイプ別:変動分析
- モデルタイプ別、2018年~2030年
- 齧歯類ベース
- 齧歯類ベース市場、2018年~2030年
- ラットモデル
- マウスモデル
- その他
- 非げっ歯類ベース
- 非齧歯類ベース市場、2018年~2030年
第6章 In Vivo CRO市場:適応症推定・動向分析
- In Vivo CRO市場、適応症別:セグメントダッシュボード
- In Vivo CRO市場、適応症別:変動分析
- 適応症別、2018年~2030年
- 自己免疫疾患/炎症性疾患
- 自己免疫疾患 / 炎症疾患市場、2018~2030年
- 関節リウマチ
- 多発性硬化症
- 変形性関節症
- 過敏性腸症候群
- その他
- 疼痛管理
- 疼痛管理市場、2018年~2030年
- 慢性疼痛
- 急性疼痛
- 腫瘍学
- 腫瘍学市場、2018年~2030年
- 血液がん
- 固形腫瘍
- その他
- 中枢神経系の症状
- CNS疾患市場、2018年~2030年
- てんかん
- パーキンソン病
- ハンチントン病
- 脳卒中
- 筋ジストロフィー
- アルツハイマー病
- 外傷性脳損傷
- 筋萎縮性側索硬化症(ALS)
- 脊髄性筋萎縮症
- 筋肉の再生
- その他の神経発達障害
- 糖尿病
- 糖尿病市場、2018年~2030年
- 肥満
- 肥満市場、2018年~2030年
- その他
- その他市場、2018年~2030年
第7章 In Vivo CRO市場:GLPタイプ推定・動向分析
- In Vivo CRO市場、GLPタイプ別:セグメントダッシュボード
- In Vivo CRO市場、GLPタイプ別:変動分析
- GLPタイプ別、2018年~2030年
- 非GLP
- 非GLP市場、2018年~2030年
- GLP毒性学
- GLP毒性学ベース市場、2018年~2030年
第8章 In Vivo CRO市場:地域推定・動向分析
- 地域別市場シェア分析、2024年・2030年
- 地域市場ダッシュボード
- 世界地域市場のスナップショット
- 北米
- 米国
- カナダ
- メキシコ
- 欧州
- 英国
- ドイツ
- フランス
- イタリア
- スペイン
- デンマーク
- スウェーデン
- ノルウェー
- アジア太平洋
- 日本
- 中国
- インド
- 韓国
- オーストラリア
- タイ
- ラテンアメリカ
- ブラジル
- アルゼンチン
- 中東・アフリカ
- 南アフリカ
- サウジアラビア
- アラブ首長国連邦
- クウェート
第9章 競合情勢
- 市場参入企業の分類
- 企業市場シェア分析、2023/24年
- 企業プロファイル
- IQVIA Inc
- Crown Bioscience
- Taconic Biosciences, Inc.
- PsychoGenics Inc.
- Evotec
- Janvier Labs
- Biocytogen
- GemPharmatech
- Charles River Laboratories
- Icon Plc
- Labcorp Drug Development
- Parexel International Corporation
- SMO Clinical Research(I)Pvt Ltd
第10章 主要な提言
List of Tables
- Table 1 List of Secondary Sources
- Table 2 List of Abbreviations
- Table 3 Global In Vivo CRO Market, By Region, 2018 - 2030 (USD Million)
- Table 4 Global In Vivo CRO Market, By Model Type, 2018 - 2030 (USD Million)
- Table 5 Global In Vivo CRO Market, By Modality, 2018 - 2030 (USD Million)
- Table 6 Global In Vivo CRO Market, By Indication, 2018 - 2030 (USD Million)
- Table 7 Global In Vivo CRO Market, By GLP Type, 2018 - 2030 (USD Million)
- Table 8 North America In Vivo CRO Market, By Country, 2018 - 2030 (USD Million)
- Table 9 North America In Vivo CRO Market, By Model Type, 2018 - 2030 (USD Million)
- Table 10 North America In Vivo CRO Market, By Modality, 2018 - 2030 (USD Million)
- Table 11 North America In Vivo CRO Market, By Indication, 2018 - 2030 (USD Million)
- Table 12 North America In Vivo CRO Market, By GLP Type, 2018 - 2030 (USD Million)
- Table 13 U.S. In Vivo CRO Market, By Model Type, 2018 - 2030 (USD Million)
- Table 14 U.S. In Vivo CRO Market, By Modality, 2018 - 2030 (USD Million)
- Table 15 U.S. In Vivo CRO Market, By Indication, 2018 - 2030 (USD Million)
- Table 16 U.S. In Vivo CRO Market, By GLP Type, 2018 - 2030 (USD Million)
- Table 17 Canada In Vivo CRO Market, By Model Type, 2018 - 2030 (USD Million)
- Table 18 Canada In Vivo CRO Market, By Modality, 2018 - 2030 (USD Million)
- Table 19 Canada In Vivo CRO Market, By Indication, 2018 - 2030 (USD Million)
- Table 20 Canada In Vivo CRO Market, By GLP Type, 2018 - 2030 (USD Million)
- Table 21 Mexico In Vivo CRO Market, By Model Type, 2018 - 2030 (USD Million)
- Table 22 Mexico In Vivo CRO Market, By Modality, 2018 - 2030 (USD Million)
- Table 23 Mexico In Vivo CRO Market, By Indication, 2018 - 2030 (USD Million)
- Table 24 Mexico In Vivo CRO Market, By GLP Type, 2018 - 2030 (USD Million)
- Table 25 Europe In Vivo CRO Market, By Country, 2018 - 2030 (USD Million)
- Table 26 Europe In Vivo CRO Market, By Model Type, 2018 - 2030 (USD Million)
- Table 27 Europe In Vivo CRO Market, By Modality, 2018 - 2030 (USD Million)
- Table 28 Europe In Vivo CRO Market, By Indication, 2018 - 2030 (USD Million)
- Table 29 Europe In Vivo CRO Market, By GLP Type, 2018 - 2030 (USD Million)
- Table 30 UK In Vivo CRO Market, By Model Type, 2018 - 2030 (USD Million)
- Table 31 UK In Vivo CRO Market, By Modality, 2018 - 2030 (USD Million)
- Table 32 UK In Vivo CRO Market, By Indication, 2018 - 2030 (USD Million)
- Table 33 UK In Vivo CRO Market, By GLP Type, 2018 - 2030 (USD Million)
- Table 34 Germany In Vivo CRO Market, By Model Type, 2018 - 2030 (USD Million)
- Table 35 Germany In Vivo CRO Market, By Modality, 2018 - 2030 (USD Million)
- Table 36 Germany In Vivo CRO Market, By Indication, 2018 - 2030 (USD Million)
- Table 37 Germany In Vivo CRO Market, By GLP Type, 2018 - 2030 (USD Million)
- Table 38 France In Vivo CRO Market, By Model Type, 2018 - 2030 (USD Million)
- Table 39 France In Vivo CRO Market, By Modality, 2018 - 2030 (USD Million)
- Table 40 France In Vivo CRO Market, By Indication, 2018 - 2030 (USD Million)
- Table 41 France In Vivo CRO Market, By GLP Type, 2018 - 2030 (USD Million)
- Table 42 Italy In Vivo CRO Market, By Model Type, 2018 - 2030 (USD Million)
- Table 43 Italy In Vivo CRO Market, By Modality, 2018 - 2030 (USD Million)
- Table 44 Italy In Vivo CRO Market, By Indication, 2018 - 2030 (USD Million)
- Table 45 Italy In Vivo CRO Market, By GLP Type, 2018 - 2030 (USD Million)
- Table 46 Spain In Vivo CRO Market, By Model Type, 2018 - 2030 (USD Million)
- Table 47 Spain In Vivo CRO Market, By Modality, 2018 - 2030 (USD Million)
- Table 48 Spain In Vivo CRO Market, By Indication, 2018 - 2030 (USD Million)
- Table 49 Spain In Vivo CRO Market, By GLP Type, 2018 - 2030 (USD Million)
- Table 50 Denmark In Vivo CRO Market, By Model Type, 2018 - 2030 (USD Million)
- Table 51 Denmark In Vivo CRO Market, By Modality, 2018 - 2030 (USD Million)
- Table 52 Denmark In Vivo CRO Market, By Indication, 2018 - 2030 (USD Million)
- Table 53 Denmark In Vivo CRO Market, By GLP Type, 2018 - 2030 (USD Million)
- Table 54 Sweden In Vivo CRO Market, By Model Type, 2018 - 2030 (USD Million)
- Table 55 Sweden In Vivo CRO Market, By Modality, 2018 - 2030 (USD Million)
- Table 56 Sweden In Vivo CRO Market, By Indication, 2018 - 2030 (USD Million)
- Table 57 Sweden In Vivo CRO Market, By GLP Type, 2018 - 2030 (USD Million)
- Table 58 Norway In Vivo CRO Market, By Model Type, 2018 - 2030 (USD Million)
- Table 59 Norway In Vivo CRO Market, By Modality, 2018 - 2030 (USD Million)
- Table 60 Norway In Vivo CRO Market, By Indication, 2018 - 2030 (USD Million)
- Table 61 Norway In Vivo CRO Market, By GLP Type, 2018 - 2030 (USD Million)
- Table 62 Asia Pacific In Vivo CRO Market, By Country, 2018 - 2030 (USD Million)
- Table 63 Asia Pacific In Vivo CRO Market, By Model Type, 2018 - 2030 (USD Million)
- Table 64 Asia Pacific In Vivo CRO Market, By Modality, 2018 - 2030 (USD Million)
- Table 65 Asia Pacific In Vivo CRO Market, By Indication, 2018 - 2030 (USD Million)
- Table 66 Asia Pacific In Vivo CRO Market, By GLP Type, 2018 - 2030 (USD Million)
- Table 67 Japan In Vivo CRO Market, By Model Type, 2018 - 2030 (USD Million)
- Table 68 Japan In Vivo CRO Market, By Modality, 2018 - 2030 (USD Million)
- Table 69 Japan In Vivo CRO Market, By Indication, 2018 - 2030 (USD Million)
- Table 70 Japan In Vivo CRO Market, By GLP Type, 2018 - 2030 (USD Million)
- Table 71 China In Vivo CRO Market, By Model Type, 2018 - 2030 (USD Million)
- Table 72 China In Vivo CRO Market, By Modality, 2018 - 2030 (USD Million)
- Table 73 China In Vivo CRO Market, By Indication, 2018 - 2030 (USD Million)
- Table 74 China In Vivo CRO Market, By GLP Type, 2018 - 2030 (USD Million)
- Table 75 India In Vivo CRO Market, By Model Type, 2018 - 2030 (USD Million)
- Table 76 India In Vivo CRO Market, By Modality, 2018 - 2030 (USD Million)
- Table 77 India In Vivo CRO Market, By Indication, 2018 - 2030 (USD Million)
- Table 78 India In Vivo CRO Market, By GLP Type, 2018 - 2030 (USD Million)
- Table 79 South Korea In Vivo CRO Market, By Model Type, 2018 - 2030 (USD Million)
- Table 80 South Korea In Vivo CRO Market, By Modality, 2018 - 2030 (USD Million)
- Table 81 South Korea In Vivo CRO Market, By Indication, 2018 - 2030 (USD Million)
- Table 82 South Korea In Vivo CRO Market, By GLP Type, 2018 - 2030 (USD Million)
- Table 83 Australia In Vivo CRO Market, By Model Type, 2018 - 2030 (USD Million)
- Table 84 Australia In Vivo CRO Market, By Modality, 2018 - 2030 (USD Million)
- Table 85 Australia In Vivo CRO Market, By Indication, 2018 - 2030 (USD Million)
- Table 86 Australia In Vivo CRO Market, By GLP Type, 2018 - 2030 (USD Million)
- Table 87 Thailand In Vivo CRO Market, By Model Type, 2018 - 2030 (USD Million)
- Table 88 Thailand In Vivo CRO Market, By Modality, 2018 - 2030 (USD Million)
- Table 89 Thailand In Vivo CRO Market, By Indication, 2018 - 2030 (USD Million)
- Table 90 Thailand In Vivo CRO Market, By GLP Type, 2018 - 2030 (USD Million)
- Table 91 Latin America In Vivo CRO Market, By Country, 2018 - 2030 (USD Million)
- Table 92 Latin America In Vivo CRO Market, By Model Type, 2018 - 2030 (USD Million)
- Table 93 Latin America In Vivo CRO Market, By Modality, 2018 - 2030 (USD Million)
- Table 94 Latin America In Vivo CRO Market, By Indication, 2018 - 2030 (USD Million)
- Table 95 Latin America In Vivo CRO Market, By GLP Type, 2018 - 2030 (USD Million)
- Table 96 Brazil In Vivo CRO Market, By Model Type, 2018 - 2030 (USD Million)
- Table 97 Brazil In Vivo CRO Market, By Modality, 2018 - 2030 (USD Million)
- Table 98 Brazil In Vivo CRO Market, By Indication, 2018 - 2030 (USD Million)
- Table 99 Brazil In Vivo CRO Market, By GLP Type, 2018 - 2030 (USD Million)
- Table 100 Argentina In Vivo CRO Market, By Model Type, 2018 - 2030 (USD Million)
- Table 101 Argentina In Vivo CRO Market, By Modality, 2018 - 2030 (USD Million)
- Table 102 Argentina In Vivo CRO Market, By Indication, 2018 - 2030 (USD Million)
- Table 103 Argentina In Vivo CRO Market, By GLP Type, 2018 - 2030 (USD Million)
- Table 104 Middle East and Africa In Vivo CRO Market, By Country, 2018 - 2030 (USD Million)
- Table 105 Middle East and Africa In Vivo CRO Market, By Model Type, 2018 - 2030 (USD Million)
- Table 106 Middle East and Africa In Vivo CRO Market, By Modality, 2018 - 2030 (USD Million)
- Table 107 Middle East and Africa In Vivo CRO Market, By Indication, 2018 - 2030 (USD Million)
- Table 108 Middle East and Africa In Vivo CRO Market, By GLP Type, 2018 - 2030 (USD Million)
- Table 109 South Africa In Vivo CRO Market, By Model Type, 2018 - 2030 (USD Million)
- Table 110 South Africa In Vivo CRO Market, By Modality, 2018 - 2030 (USD Million)
- Table 111 South Africa In Vivo CRO Market, By Indication, 2018 - 2030 (USD Million)
- Table 112 South Africa In Vivo CRO Market, By GLP Type, 2018 - 2030 (USD Million)
- Table 113 Saudi Arabia In Vivo CRO Market, By Model Type, 2018 - 2030 (USD Million)
- Table 114 Saudi Arabia In Vivo CRO Market, By Modality, 2018 - 2030 (USD Million)
- Table 115 Saudi Arabia In Vivo CRO Market, By Indication, 2018 - 2030 (USD Million)
- Table 116 Saudi Arabia In Vivo CRO Market, By GLP Type, 2018 - 2030 (USD Million)
- Table 117 UAE In Vivo CRO Market, By Model Type, 2018 - 2030 (USD Million)
- Table 118 UAE In Vivo CRO Market, By Modality, 2018 - 2030 (USD Million)
- Table 119 UAE In Vivo CRO Market, By Indication, 2018 - 2030 (USD Million)
- Table 120 UAE In Vivo CRO Market, By GLP Type, 2018 - 2030 (USD Million)
- Table 121 Kuwait In Vivo CRO Market, By Model Type, 2018 - 2030 (USD Million)
- Table 122 Kuwait In Vivo CRO Market, By Modality, 2018 - 2030 (USD Million)
- Table 123 Kuwait In Vivo CRO Market, By Indication, 2018 - 2030 (USD Million)
- Table 124 Kuwait In Vivo CRO Market, By GLP Type, 2018 - 2030 (USD Million)
List of Figures
- Fig. 1 In Vivo CRO Market Segmentation
- Fig. 2 Market research process
- Fig. 3 Information procurement
- Fig. 4 Primary research pattern
- Fig. 5 Data Analysis Models
- Fig. 6 Market Formulation And Validation
- Fig. 7 Data Validating & Publishing
- Fig. 8 Parent Market Analysis
- Fig. 9 Service/Commodity Flow Analysis
- Fig. 10 Value-Chain-Based Sizing & Forecasting
- Fig. 11 QFD Model Sizing & Forecasting
- Fig. 12 Market formulation & validation
- Fig. 13 Market Snapshot
- Fig. 14 Segment Snapshot
- Fig. 15 Competitive landscape snapshot
- Fig. 16 Parent market analysis, 2024 (USD Million)
- Fig. 17 Ancillary market outlook, 2024 (USD Million)
- Fig. 18 In vivo CRO market dynamics
- Fig. 19 FDA expedited approval pathway
- Fig. 20 Porter's Five Forces Analysis
- Fig. 21 SWOT analysis by factor (political, legal, economic, social, environmental, and technological)
- Fig. 22 Companies With Affected Trials, By Size
- Fig. 23 Affected Trials, By Study Phase
- Fig. 24 Clinical trial scenario (As of January 2023/24)
- Fig. 25 In vivo CRO market model type outlook: Segment dashboard
- Fig. 26 In vivo CRO Market, by model type segment: Market Share, 2024 & 2030
- Fig. 27 Rodent-based market, 2018 - 2030 (USD Million)
- Fig. 28 Rat model market, 2018 - 2030 (USD Million)
- Fig. 29 Mice model market, 2018 - 2030 (USD Million)
- Fig. 30 Others market, 2018 - 2030 (USD Million)
- Fig. 31 Non rodent-based market, 2018 - 2030 (USD Million)
- Fig. 32 In vivo CRO market, by indication segment: Market Share, 2024 & 2030
- Fig. 33 Autoimmune/inflammatory conditions market, 2018 - 2030 (USD Million)
- Fig. 34 Rheumatoid arthritis market, 2018 - 2030 (USD Million)
- Fig. 35 Multiple sclerosis market, 2018 - 2030 (USD Million)
- Fig. 36 Osteoarthritis market, 2018 - 2030 (USD Million)
- Fig. 37 Irritable bowel syndrome market, 2018 - 2030 (USD Million)
- Fig. 38 Others market, 2018 - 2030 (USD Million)
- Fig. 39 Pain management market, 2018 - 2030 (USD Million)
- Fig. 40 Chronic pain market, 2018 - 2030 (USD Million)
- Fig. 41 Acute pain market, 2018 - 2030 (USD Million)
- Fig. 42 Oncology market, 2018 - 2030 (USD Million)
- Fig. 43 Blood cancer market, 2018 - 2030 (USD Million)
- Fig. 44 Solid tumor market, 2018 - 2030 (USD Million)
- Fig. 45 Syngeneic model market, 2018 - 2030 (USD Million)
- Fig. 46 Patient derived xenograft market, 2018 - 2030 (USD Million)
- Fig. 47 Xenograft market, 2018 - 2030 (USD Million)
- Fig. 48 Others oncology types market, 2018 - 2030 (USD Million)
- Fig. 49 CNS conditions market, 2018 - 2030 (USD Million)
- Fig. 50 Epilepsy market, 2018 - 2030 (USD Million)
- Fig. 51 The Parkinson's development pipeline by phase
- Fig. 52 Parkinson's disease market, 2018 - 2030 (USD Million)
- Fig. 53 Huntington's disease market, 2018 - 2030 (USD Million)
- Fig. 54 Stroke market, 2018 - 2030 (USD Million)
- Fig. 55 Traumatic brain injury market, 2018 - 2030 (USD Million)
- Fig. 56 Amyotrophic Lateral Sclerosis (ALS) market, 2018 - 2030 (USD Million)
- Fig. 57 Muscle regeneration market, 2018 - 2030 (USD Million)
- Fig. 58 Alzheimer's development pipeline, by phase
- Fig. 59 Alzheimer's development pipeline, by disease severity
- Fig. 60 Alzheimer's disease market, 2018 - 2030 (USD Million)
- Fig. 61 Spinal muscular atrophy market, 2018 - 2030 (USD Million)
- Fig. 62 Muscular dystrophy market, 2018 - 2030 (USD Million)
- Fig. 63 Neurodevelopment disorders market, 2018 - 2030 (USD Million)
- Fig. 64 Diabetes market, 2018 - 2030 (USD Million)
- Fig. 65 Obesity market, 2018 - 2030 (USD Million)
- Fig. 66 Others market, 2018 - 2030 (USD Million)
- Fig. 67 In Vivo CRO Market Modality Type Outlook:Segment dashboard
- Fig. 68 In Vivo CRO Market, By Modality Type Segment: Market Share, 2024 & 2030
- Fig. 69 Large molecule market, 2018 - 2030 (USD Million)
- Fig. 70 Cell and gene therapies market, 2018 - 2030 (USD Million)
- Fig. 71 CAR-T cell therapies market, 2018 - 2030 (USD Million)
- Fig. 72 CAR-NK cell therapies market, 2018 - 2030 (USD Million)
- Fig. 73 TCR-T cell therapy market, 2018 - 2030 (USD Million)
- Fig. 74 Other market, 2018 - 2030 (USD Million)
- Fig. 75 RNA therapy market, 2018 - 2030 (USD Million)
- Fig. 76 Others market, 2018 - 2030 (USD Million)
- Fig. 77 Small molecules market, 2018 - 2030 (USD Million)
- Fig. 78 In Vivo CRO Market GLP Type Outlook: Segment dashboard
- Fig. 79 In Vivo CRO Market, By GLP Type Segment: Market Share, 2024 & 2030
- Fig. 80 GLP Toxicology Market, 2018 - 2030 (USD Million)
- Fig. 81 Non-GLP Market, 2018 - 2030 (USD Million)
- Fig. 82 In vivo CRO market revenue, by region, 2024 & 2030 (USD Million)
- Fig. 83 Regional market share analysis, 2024 & 2030
- Fig. 84 Regional marketplace: key takeaways
- Fig. 85 Regional marketplace: key takeaways
- Fig. 86 North America in vivo CRO market estimates and forecasts, 2018 - 2030 (USD Million)
- Fig. 87 Key country dynamics
- Fig. 88 U.S. in vivo CRO market estimates and forecasts, 2018 - 2030 (USD Million)
- Fig. 89 Key country dynamics
- Fig. 90 Canada in vivo CRO market estimates and forecasts, 2018 - 2030 (USD Million)
- Fig. 91 Key country dynamics
- Fig. 92 Mexico in vivo CRO market estimates and forecasts, 2018 - 2030 (USD Million)
- Fig. 93 Europe in vivo CRO market estimates and forecasts, 2018 - 2030 (USD Million)
- Fig. 94 Key country dynamics
- Fig. 95 Germany in vivo CRO market estimates and forecasts, 2018 - 2030 (USD Million)
- Fig. 96 Key country dynamics
- Fig. 97 UK in vivo CRO market estimates and forecasts, 2018 - 2030 (USD Million)
- Fig. 98 Key country dynamics
- Fig. 99 France in vivo CRO market estimates and forecasts, 2018 - 2030 (USD Million)
- Fig. 100 Key country dynamics
- Fig. 101 Spain in vivo CRO market estimates and forecasts, 2018 - 2030 (USD Million)
- Fig. 102 Key country dynamics
- Fig. 103 Italy in vivo CRO market estimates and forecasts, 2018 - 2030 (USD Million)
- Fig. 104 Key country dynamics
- Fig. 105 Denmark in vivo CRO market estimates and forecasts, 2018 - 2030 (USD Million)
- Fig. 106 Key country dynamics
- Fig. 107 Sweden in vivo CRO market estimates and forecasts, 2018 - 2030 (USD Million)
- Fig. 108 Key country dynamics
- Fig. 109 Italy in vivo CRO market estimates and forecasts, 2018 - 2030 (USD Million)
- Fig. 110 Asia Pacific in vivo CRO market estimates and forecasts, 2018 - 2030 (USD Million)
- Fig. 111 Key Country Dynamics
- Fig. 112 Japan in vivo CRO market estimates and forecasts, 2018 - 2030 (USD Million)
- Fig. 113 Key Country Dynamics
- Fig. 114 China In vivo CRO market estimates and forecasts, 2018 - 2030 (USD Million)
- Fig. 115 Key Country Dynamics
- Fig. 116 India in vivo CRO market estimates and forecasts, 2018 - 2030 (USD Million)
- Fig. 117 Key Country Dynamics
- Fig. 118 Australia in vivo CRO market estimates and forecasts, 2018 - 2030 (USD Million)
- Fig. 119 Key Country Dynamics
- Fig. 120 South Korea in vivo CRO market estimates and forecasts, 2018 - 2030 (USD Million)
- Fig. 121 Key country dynamic
- Fig. 122 Thailand in vivo CRO market estimates and forecasts, 2018 - 2030 (USD Million)
- Fig. 123 Latin America in vivo CRO market estimates and forecasts, 2018 - 2030 (USD Million)
- Fig. 124 Key country dynamics
- Fig. 125 Brazil in vivo CRO market estimates and forecasts, 2018 - 2030 (USD Million)
- Fig. 126 Key country dynamics
- Fig. 127 Argentina in vivo CRO market estimates and forecasts, 2018 - 2030 (USD Million)
- Fig. 128 MEA in vivo CRO market estimates and forecasts, 2018 - 2030 (USD Million)
- Fig. 129 Key country dynamics
- Fig. 130 South Africa in vivo CRO market estimates and forecasts, 2018 - 2030 (USD Million)
- Fig. 131 Key country dynamics
- Fig. 132 Saudi Arabia in vivo CRO market estimates and forecasts, 2018 - 2030 (USD Million)
- Fig. 133 Key country dynamics
- Fig. 134 UAE in vivo CRO market estimates and forecasts, 2018 - 2030 (USD Million)
- Fig. 135 Key country dynamics
- Fig. 136 Kuwait in vivo CRO market estimates and forecasts, 2018 - 2030 (USD Million)
- Fig. 137 Key company categorization
- Fig. 138 Company market position analysis
- Fig. 139 In Vivo CRO Market Share Analysis, 2023
- Fig. 140 Strategic framework
In Vivo CRO Market Growth & Trends:
The global in vivo CRO market size is estimated to reach USD 7.96 billion by 2030, expanding at a CAGR of 8.13% from 2025 to 2030, according to a new report by Grand View Research, Inc. The growth of the pharmaceutical market in emerging countries, along with strong demand for numerous in vivo cell therapies, rapid advancements in material sciences, and complexities of drug-device combinations, has led to the demand for services in the region. Additionally, rising in vivo preclinical and clinical research, regulatory approval, expanding services by market players, and the burden of different diseases contribute to market earnings. Also, increasing outsourcing of preclinical and clinical services across developing economies at a lower cost is one of the major factors supporting the growth of in vivo CRO market.
Likewise, the increase in offshoring drugs to emerging economies has created immense demand for the market. Budget scrutiny in developed countries, pricing pressure, and changes in reimbursement schemes are some of the major factors anticipated to increase the adoption of cost-containment measures by drug sponsors in emerging countries such as India and China. Outsourcing development services such as preclinical in vivo services to contract service providers in emerging countries is expected to boost the demand for quality assurance & regulatory affairs services, thereby contributing to the rising demand for in vivo outsourced services. Stringent processes for FDA approval and regulatory changes in the EU region are expected to make the approval process in Europe complex. They are some of the major factors contributing to the offshoring of drug companies to emerging countries.
The COVID-19 pandemic has initially negatively impacted the clinical trials industry and the in vivo CRO market was no different! The shift in the focus of the biopharmaceutical industry on developing vaccines & therapies in response to COVID-19 has resulted in the unintended consequences of potentially disrupting clinical trials for other diseases. One of the key issues faced by companies operating in the cell and gene therapy industry is the untimely delivery of therapies to patients at required clinical sites. In addition, the administration of cell-based therapeutics poses several post-pandemic challenges. Hospitals have shown hesitation in offering cell therapy services owing to concerns over transmission of SARS-CoV-2, especially to vulnerable individuals. Patients have not been able to visit cell therapy centers either owing to the lockdowns or travel bans.
Furthermore, the key participants are engaged in strategies such as mergers & acquisitions, partnerships, agreements, collaborations, and service launches, among others, to expand their global footprints and service/product portfolio. For instance, in April 2023, PsychoGenics, Inc. announced the launch of eCube, a pharmaco-electroencephalography platform, to enhance phenotypic drug discovery. Similarly, in February 2023, Biocytogen recently introduced "the Nano 100 Project" to develop over 100 fully human nanobody drugs that target specific targets. This endeavor involves combining Biocytogen's proprietary RenNano, a mouse model capable of producing fully human nanobodies, with their advanced in vitro and in vivo antibody screening platforms. By leveraging these integrated technologies, Biocytogen is poised to facilitate the extensive development of fully human nanobody drugs.
In Vivo CRO Market Report Highlights:
- The rodent-based segment held the largest revenue share of 81.95% owing to constant model demand as they are genetically similar to humans. Besides, their small size, short life cycle, ease of maintenance, and availability of genetic resources, make them the most prevalent species in in-vivo CRO research
- The small molecule segment dominated the in vivo CRO market. The growth is attributed to the demand for small molecules in the development of drug candidates. In addition, the strong therapeutic effect of small molecules in a small dose is the key factor aiding segment growth
- The oncology segment dominated the global in vivo CRO market and accounted for a revenue share of 29.02% in 2024, the key factors contributing to the growth include the growing burden of cancer, surging demand for new gene therapy, and preclinical studies for cancer immunotherapy. According to the American Society of Gene Cell Therapy, around 97% of CAR T-cell therapies are developed for cancer indications
- The CNS conditions segment is anticipated to register the fastest growth, owing to the effectiveness of different model-based investigational compounds targeting brain diseases is expected to drive segment growth
- The GLP toxicology segment dominated the market with the largest revenue share in 2024 owing to the increasing number of standardized studies conducted according to specific guidelines
- North America held the largest revenue share of 50.0% in in-vivo CRO market in 2024. The growth in the region can be attributed to the presence of well-established market players, the increasing burden of different diseases, growing demand for CROs in the region. Other factors contributing to the growth are increased research and development activities, preclinical studies, and innovations of market players.
Table of Contents
Chapter 1. Research Methodology and Scope
- 1.1. Market Segmentation & Scope
- 1.2. Segment Definitions
- 1.2.1. Modality
- 1.2.2. Model Type
- 1.2.3. Indication
- 1.2.4. GLP Type
- 1.3. Research Methodology
- 1.4. Information Procurement
- 1.4.1. Purchased Database
- 1.4.2. GVR's Internal Database
- 1.4.3. Secondary Sources
- 1.4.4. Primary Research
- 1.5. Information Or Data Analysis
- 1.5.1. Data Analysis Models
- 1.6. Market Formulation & Validation
- 1.7. Model Details
- 1.7.1. Commodity Flow Analysis
- 1.7.2. Parent Market Analysis
- 1.8. List Of Secondary Sources
- 1.9. List Of Abbreviations
- 1.10. Objectives
Chapter 2. Executive Summary
- 2.1. Market Outlook
- 2.2. Segment Outlook
- 2.3. Competitive Insights
Chapter 3. In Vivo CRO Market Variables, Trends & Scope
- 3.1. Market Lineage Outlook
- 3.1.1. Parent Market Outlook
- 3.1.2. Related/Ancillary Market Outlook
- 3.2. Market Dynamics
- 3.2.1. Market Driver Analysis
- 3.2.1.1. Changing regulatory landscape
- 3.2.1.2. Increase in offshoring medical device manufacturing to emerging countries
- 3.2.1.3. Rising demand for advanced products
- 3.2.1.4. Implementation of international standards by contract manufacturers
- 3.2.1.5. Rising price competition and requirement to reduce cost
- 3.2.1.6. Increasing complexity concerning product design and engineering
- 3.2.2. Market Restraint Analysis
- 3.2.2.1. Compliance Issues While Outsourcing
- 3.2.2.2. Changing Scenarios in Developing Countries
- 3.2.2.3. Regulatory And Legal Compliance
- 3.2.2.4. Contractual Obligation
- 3.2.1. Market Driver Analysis
- 3.3. In Vivo CRO Market Analysis Tools
- 3.3.1. Industry Analysis - Porter's Five Analysis
- 3.3.2. PESTEL Analysis
- 3.3.3. COVID-19 Impact Analysis
Chapter 4. In Vivo CRO Market: Modality Estimates & Trend Analysis
- 4.1. In Vivo CRO Market, By Modality: Segment Dashboard
- 4.2. In Vivo CRO Market, By Modality: Movement Analysis
- 4.3. In Vivo CRO Market Estimates & Forecasts, By Modality, 2018 - 2030
- 4.4. Small Molecule
- 4.4.1. Small Molecule Market, 2018 to 2030 (USD Million)
- 4.5. Large Molecule
- 4.5.1. Large Molecule Market, 2018 to 2030 (USD Million)
- 4.5.2. Cell & Gene Therapy
- 4.5.2.1. Cell & Gene Therapy Market, 2018 to 2030 (USD Million)
- 4.5.2.2. CAR T-cell therapies
- 4.5.2.2.1. CAR T-Cell Therapies Market, 2018 to 2030 (USD Million)
- 4.5.2.3. CAR-NK cell therapy
- 4.5.2.3.1. CAR-NK Cell Therapy Market, 2018 to 2030 (USD Million)
- 4.5.2.4. TCR-T cell therapy
- 4.5.2.4.1. TCR-T Cell Therapy Market, 2018 to 2030 (USD Million)
- 4.5.2.5. Other Cell & Gene Therapy
- 4.5.2.5.1. Other Cell & Gene Therapy Market, 2018 to 2030 (USD Million)
- 4.5.3. RNA Therapy
- 4.5.3.1. RNA Therapy Market, 2018 to 2030 (USD Million)
- 4.5.4. Others
- 4.5.4.1. Others Market, 2018 to 2030 (USD Million)
Chapter 5. In Vivo CRO Market: Model Type Estimates & Trend Analysis
- 5.1. In Vivo CRO Market, By Model Type: Segment Dashboard
- 5.2. In Vivo CRO Market, By Model Type: Movement Analysis
- 5.3. In Vivo CRO Market Estimates & Forecasts, By Model Type, 2018 - 2030
- 5.4. Rodent based
- 5.4.1. Rodent based Market, 2018 to 2030 (USD Million)
- 5.4.2. Rat Models
- 5.4.2.1. Rat Models Market, 2018 to 2030 (USD Million)
- 5.4.3. Mice Models
- 5.4.3.1. Mice Models Market, 2018 to 2030 (USD Million)
- 5.4.4. Others
- 5.4.4.1. Others Market, 2018 to 2030 (USD Million)
- 5.5. Non-Rodent based
- 5.5.1. Non-Rodent based Market, 2018 to 2030 (USD Million)
Chapter 6. In Vivo CRO Market: Indication Estimates & Trend Analysis
- 6.1. In Vivo CRO Market, By Indication: Segment Dashboard
- 6.2. In Vivo CRO Market, By Indication: Movement Analysis
- 6.3. In Vivo CRO Market Estimates & Forecasts, By Indication, 2018 - 2030
- 6.4. Autoimmune/inflammation conditions
- 6.4.1. Autoimmune/inflammation conditions Market, 2018 to 2030 (USD Million)
- 6.4.2. Rheumatoid Arthritis
- 6.4.2.1. Rheumatoid Arthritis Market, 2018 to 2030 (USD Million)
- 6.4.3. Multiple Sclerosis
- 6.4.3.1. Multiple Sclerosis Market, 2018 to 2030 (USD Million)
- 6.4.4. Osteoarthritis
- 6.4.4.1. Osteoarthritis Market, 2018 to 2030 (USD Million)
- 6.4.5. Irritable Bowel Syndrome
- 6.4.5.1. Irritable Bowel Syndrome Market, 2018 to 2030 (USD Million)
- 6.4.6. Others
- 6.4.6.1. Others Market, 2018 to 2030 (USD Million)
- 6.5. Pain management
- 6.5.1. Pain management Market, 2018 to 2030 (USD Million)
- 6.5.2. Chronic pain
- 6.5.2.1. Chronic pain Market, 2018 to 2030 (USD Million)
- 6.5.3. Acute pain
- 6.5.3.1. Acute pain Market, 2018 to 2030 (USD Million)
- 6.6. Oncology
- 6.6.1. Oncology Market, 2018 to 2030 (USD Million)
- 6.6.2. Blood cancer
- 6.6.2.1. Blood Cancer Market, 2018 to 2030 (USD Million)
- 6.6.3. Solid tumor
- 6.6.3.1. Solid Tumor Market, 2018 to 2030 (USD Million)
- 6.6.3.2. Syngeneic model
- 6.6.3.2.1. Syngeneic Model Market, 2018 to 2030 (USD Million)
- 6.6.3.3. Patient derived xenograft
- 6.6.3.3.1. Patient Derived Xenograft Market, 2018 to 2030 (USD Million)
- 6.6.3.4. Xenograft
- 6.6.3.4.1. Xenograft Market, 2018 to 2030 (USD Million)
- 6.6.4. Others
- 6.6.4.1. Others Market, 2018 to 2030 (USD Million)
- 6.7. CNS Conditions
- 6.7.1. CNS Conditions Market, 2018 to 2030 (USD Million)
- 6.7.2. Epilepsy
- 6.7.2.1. Epilepsy Market, 2018 to 2030 (USD Million)
- 6.7.3. Parkinson's disease
- 6.7.3.1. Parkinson's Disease Market, 2018 to 2030 (USD Million)
- 6.7.4. Huntington's disease
- 6.7.4.1. Huntington's Disease Market, 2018 to 2030 (USD Million)
- 6.7.5. Stroke
- 6.7.5.1. Stroke Market, 2018 to 2030 (USD Million)
- 6.7.6. Muscular Dystrophy
- 6.7.6.1. Muscular Dystrophy Market, 2018 to 2030 (USD Million)
- 6.7.7. Alzheimer's Disease
- 6.7.7.1. Alzheimer's Disease Market, 2018 to 2030 (USD Million)
- 6.7.8. Traumatic brain injury
- 6.7.8.1. Traumatic Brain Injury Market, 2018 to 2030 (USD Million)
- 6.7.9. Amyotrophic lateral sclerosis (ALS)
- 6.7.9.1. Amyotrophic Lateral Sclerosis (ALS) Market, 2018 to 2030 (USD Million)
- 6.7.10. Spinal Muscular Atrophy
- 6.7.10.1. Spinal Muscular Atrophy Market, 2018 to 2030 (USD Million)
- 6.7.11. Muscle regeneration
- 6.7.11.1. Muscle Regeneration Market, 2018 to 2030 (USD Million)
- 6.7.12. Other Neurodevelopment Disorders
- 6.7.12.1. Other Neurodevelopment Disorders Market, 2018 to 2030 (USD Million)
- 6.8. Diabetes
- 6.8.1. Diabetes Market, 2018 to 2030 (USD Million)
- 6.9. Obesity
- 6.9.1. Obesity Market, 2018 to 2030 (USD Million)
- 6.10. Others
- 6.10.1. Others Market, 2018 to 2030 (USD Million)
Chapter 7. In Vivo CRO Market: GLP Type Estimates & Trend Analysis
- 7.1. In Vivo CRO Market, By GLP Type: Segment Dashboard
- 7.2. In Vivo CRO Market, By GLP Type: Movement Analysis
- 7.3. In Vivo CRO Market Estimates & Forecasts, By GLP Type, 2018 - 2030
- 7.4. Non GLP
- 7.4.1. Non GLP Market, 2018 to 2030 (USD Million)
- 7.5. GLP Toxicology
- 7.5.1. GLP Toxicology based Market, 2018 to 2030 (USD Million)
Chapter 8. In Vivo CRO Market: Regional Estimates & Trend Analysis
- 8.1. Regional Market Share Analysis, 2024 & 2030
- 8.2. Regional Market Dashboard
- 8.3. Global Regional Market Snapshot
- 8.4. North America
- 8.4.1. North America Market Estimates and Forecasts, 2018 - 2030 (USD Million)
- 8.4.2. U.S
- 8.4.2.1. Key Country Dynamics
- 8.4.2.2. Competitive Scenario
- 8.4.2.3. Regulatory Framework
- 8.4.2.4. U.S. Market Estimates and Forecasts, 2018 - 2030 (USD Million)
- 8.4.3. Canada
- 8.4.3.1. Key Country Dynamics
- 8.4.3.2. Competitive Scenario
- 8.4.3.3. Regulatory Framework
- 8.4.3.4. Canada Market Estimates and Forecasts, 2018 - 2030 (USD Million)
- 8.4.4. Mexico
- 8.4.4.1. Key Country Dynamics
- 8.4.4.2. Competitive Scenario
- 8.4.4.3. Regulatory Framework
- 8.4.4.4. Mexico Market Estimates and Forecasts, 2018 - 2030 (USD Million)
- 8.5. Europe
- 8.5.1. Europe Market Estimates and Forecasts, 2018 - 2030 (USD Million)
- 8.5.2. UK
- 8.5.2.1. Key Country Dynamics
- 8.5.2.2. Competitive Scenario
- 8.5.2.3. Regulatory Framework
- 8.5.2.4. UK Market Estimates and Forecasts, 2018 - 2030 (USD Million)
- 8.5.3. Germany
- 8.5.3.1. Key Country Dynamics
- 8.5.3.2. Competitive Scenario
- 8.5.3.3. Regulatory Framework
- 8.5.3.4. Germany Market Estimates and Forecasts, 2018 - 2030 (USD Million)
- 8.5.4. France
- 8.5.4.1. Key Country Dynamics
- 8.5.4.2. Competitive Scenario
- 8.5.4.3. Regulatory Framework
- 8.5.4.4. France Market Estimates and Forecasts, 2018 - 2030 (USD Million)
- 8.5.5. Italy
- 8.5.5.1. Key Country Dynamics
- 8.5.5.2. Competitive Scenario
- 8.5.5.3. Regulatory Framework
- 8.5.5.4. Italy Market Estimates and Forecasts, 2018 - 2030 (USD Million)
- 8.5.6. Spain
- 8.5.6.1. Key Country Dynamics
- 8.5.6.2. Competitive Scenario
- 8.5.6.3. Regulatory Framework
- 8.5.6.4. Spain Market Estimates and Forecasts, 2018 - 2030 (USD Million)
- 8.5.7. Denmark
- 8.5.7.1. Key Country Dynamics
- 8.5.7.2. Competitive Scenario
- 8.5.7.3. Regulatory Framework
- 8.5.7.4. Denmark Market Estimates and Forecasts, 2018 - 2030 (USD Million)
- 8.5.8. Sweden
- 8.5.8.1. Key Country Dynamics
- 8.5.8.2. Competitive Scenario
- 8.5.8.3. Regulatory Framework
- 8.5.8.4. Sweden Market Estimates and Forecasts, 2018 - 2030 (USD Million)
- 8.5.9. Norway
- 8.5.9.1. Key Country Dynamics
- 8.5.9.2. Competitive Scenario
- 8.5.9.3. Regulatory Framework
- 8.5.9.4. Norway Market Estimates and Forecasts, 2018 - 2030 (USD Million)
- 8.6. Asia Pacific
- 8.6.1. Asia Pacific Market Estimates and Forecasts, 2018 - 2030 (USD Million)
- 8.6.2. Japan
- 8.6.2.1. Key Country Dynamics
- 8.6.2.2. Competitive Scenario
- 8.6.2.3. Regulatory Framework
- 8.6.2.4. Japan Market Estimates and Forecasts, 2018 - 2030 (USD Million)
- 8.6.3. China
- 8.6.3.1. Key Country Dynamics
- 8.6.3.2. Competitive Scenario
- 8.6.3.3. Regulatory Framework
- 8.6.3.4. China Market Estimates and Forecasts, 2018 - 2030 (USD Million)
- 8.6.4. India
- 8.6.4.1. Key Country Dynamics
- 8.6.4.2. Competitive Scenario
- 8.6.4.3. Regulatory Framework
- 8.6.4.4. India Market Estimates and Forecasts, 2018 - 2030 (USD Million)
- 8.6.5. South Korea
- 8.6.5.1. Key Country Dynamics
- 8.6.5.2. Competitive Scenario
- 8.6.5.3. Regulatory Framework
- 8.6.5.4. South Korea Market Estimates and Forecasts, 2018 - 2030 (USD Million)
- 8.6.6. Australia
- 8.6.6.1. Key Country Dynamics
- 8.6.6.2. Competitive Scenario
- 8.6.6.3. Regulatory Framework
- 8.6.6.4. Australia Market Estimates and Forecasts, 2018 - 2030 (USD Million)
- 8.6.7. Thailand
- 8.6.7.1. Key Country Dynamics
- 8.6.7.2. Competitive Scenario
- 8.6.7.3. Regulatory Framework
- 8.6.7.4. Thailand Market Estimates and Forecasts, 2018 - 2030 (USD Million)
- 8.7. Latin America
- 8.7.1. Latin America Market Estimates and Forecasts, 2018 - 2030 (USD Million)
- 8.7.2. Brazil
- 8.7.2.1. Key Country Dynamics
- 8.7.2.2. Competitive Scenario
- 8.7.2.3. Regulatory Framework
- 8.7.2.4. Brazil Market Estimates and Forecasts, 2018 - 2030 (USD Million)
- 8.7.3. Argentina
- 8.7.3.1. Key Country Dynamics
- 8.7.3.2. Competitive Scenario
- 8.7.3.3. Regulatory Framework
- 8.7.3.4. Argentina Market Estimates and Forecasts, 2018 - 2030 (USD Million)
- 8.8. MEA
- 8.8.1. MEA Market Estimates and Forecasts, 2018 - 2030 (USD Million)
- 8.8.2. South Africa
- 8.8.2.1. Key Country Dynamics
- 8.8.2.2. Competitive Scenario
- 8.8.2.3. Regulatory Framework
- 8.8.2.4. South Africa Market Estimates and Forecasts, 2018 - 2030 (USD Million)
- 8.8.3. Saudi Arabia
- 8.8.3.1. Key Country Dynamics
- 8.8.3.2. Competitive Scenario
- 8.8.3.3. Regulatory Framework
- 8.8.3.4. Saudi Arabia Market Estimates and Forecasts, 2018 - 2030 (USD Million)
- 8.8.4. UAE
- 8.8.4.1. Key Country Dynamics
- 8.8.4.2. Competitive Scenario
- 8.8.4.3. Regulatory Framework
- 8.8.4.4. UAE Market Estimates and Forecasts, 2018 - 2030 (USD Million)
- 8.8.5. Kuwait
- 8.8.5.1. Key Country Dynamics
- 8.8.5.2. Competitive Scenario
- 8.8.5.3. Regulatory Framework
- 8.8.5.4. Kuwait Market Estimates and Forecasts, 2018 - 2030 (USD Million)
Chapter 9. Competitive Landscape
- 9.1. Market Participant Categorization
- 9.2. Company Market Share Analysis, 2023/24
- 9.3. Company Profiles
- 9.3.1. IQVIA Inc
- 9.3.1.1. Company Overview
- 9.3.1.2. Financial Performance
- 9.3.1.3. Service Benchmarking
- 9.3.1.4. Strategic Initiatives
- 9.3.2. Crown Bioscience
- 9.3.2.1. Company Overview
- 9.3.2.2. Financial Performance
- 9.3.2.3. Service Benchmarking
- 9.3.2.4. Strategic Initiatives
- 9.3.3. Taconic Biosciences, Inc.
- 9.3.3.1. Company Overview
- 9.3.3.2. Financial Performance
- 9.3.3.3. Service Benchmarking
- 9.3.3.4. Strategic Initiatives
- 9.3.4. PsychoGenics Inc.
- 9.3.4.1. Company Overview
- 9.3.4.2. Financial Performance
- 9.3.4.3. Service Benchmarking
- 9.3.4.4. Strategic Initiatives
- 9.3.5. Evotec
- 9.3.5.1. Company Overview
- 9.3.5.2. Financial Performance
- 9.3.5.3. Service Benchmarking
- 9.3.5.4. Strategic Initiatives
- 9.3.6. Janvier Labs
- 9.3.6.1. Company Overview
- 9.3.6.2. Financial Performance
- 9.3.6.3. Service Benchmarking
- 9.3.6.4. Strategic Initiatives
- 9.3.7. Biocytogen
- 9.3.7.1. Company Overview
- 9.3.7.2. Financial Performance
- 9.3.7.3. Service Benchmarking
- 9.3.7.4. Strategic Initiatives
- 9.3.8. GemPharmatech
- 9.3.8.1. Company Overview
- 9.3.8.2. Financial Performance
- 9.3.8.3. Service Benchmarking
- 9.3.8.4. Strategic Initiatives
- 9.3.9. Charles River Laboratories
- 9.3.9.1. Company Overview
- 9.3.9.2. Financial Performance
- 9.3.9.3. Service Benchmarking
- 9.3.9.4. Strategic Initiatives
- 9.3.10. Icon Plc
- 9.3.10.1. Company Overview
- 9.3.10.2. Financial Performance
- 9.3.10.3. Service Benchmarking
- 9.3.10.4. Strategic Initiatives
- 9.3.11. Labcorp Drug Development
- 9.3.11.1. Company Overview
- 9.3.11.2. Financial Performance
- 9.3.11.3. Service Benchmarking
- 9.3.11.4. Strategic Initiatives
- 9.3.12. Parexel International Corporation
- 9.3.12.1. Company Overview
- 9.3.12.2. Financial Performance
- 9.3.12.3. Service Benchmarking
- 9.3.12.4. Strategic Initiatives
- 9.3.13. SMO Clinical Research (I) Pvt Ltd
- 9.3.13.1. Company Overview
- 9.3.13.2. Financial Performance
- 9.3.13.3. Service Benchmarking
- 9.3.13.4. Strategic Initiatives
- 9.3.1. IQVIA Inc
