|
|
市場調査レポート
商品コード
1678487
眼科薬の世界市場:市場規模・シェア・動向分析 (薬剤クラス別・疾患別・投与方法別・投与経路別・製品種類別・医薬品の種類別・地域別)、セグメント別予測 (2025年~2030年)Ophthalmic Drugs Market Size, Share & Trends Analysis Report By Drug Class (Steroidal drugs, Anti-VEGF Agents), By Disease, By Dosage Form, By Route of Administration, By Product Type, By Drug Type, By Region, And Segment Forecasts, 2025 - 2030 |
||||||

|
|||||||
カスタマイズ可能
|
|||||||


| 眼科薬の世界市場:市場規模・シェア・動向分析 (薬剤クラス別・疾患別・投与方法別・投与経路別・製品種類別・医薬品の種類別・地域別)、セグメント別予測 (2025年~2030年) |
|
出版日: 2025年02月06日
発行: Grand View Research
ページ情報: 英文 150 Pages
納期: 2~10営業日
|

全表示
- 概要
- 図表
- 目次
眼科薬市場の成長と動向:
Grand View Research, Inc.の最新レポートによると、世界の眼科薬の市場規模は2030年までに620億8,000万米ドルに達し、2025年から2030年までのCAGRは8.5%に達する見込みです。
眼科疾患に対する意識の高まりと眼科薬に対する需要の急増が市場成長を促進する要因です。さらに、加齢黄斑変性、白内障、ドライアイ、糖尿病網膜症、緑内障などの眼疾患の有病率の増加が、眼科薬の需要を押し上げると予測されています。
BrightFocus Foundationによると、2021年には300万人以上の米国人が緑内障を患っていると推定され、そのうち270万人以上の患者が最も一般的なタイプの緑内障、すなわち開放隅角緑内障に罹患しています。さらに、米国では330万人が失明や弱視の影響を受けています。緑内障や失明の主な危険因子としては、高年齢、家族歴、角膜の薄さ、眼圧の高さなどが挙げられます。このため、眼科薬に対する幅広い人口基盤が形成され、有利な成長が確実なものとなっています。
さらに、眼科治療およびドラッグデリバリー企業は、新薬開発技術の進歩のための研究開発を促進するための資金援助を受けており、これが市場の成長を促進する可能性が高いです。例えば、2020年6月、Re-Vana Therapeutics社は、Qubis社、ExSight Ventures, LLC社、Clarendon Fund Managers社、Visionary Ventures社、Techstart Ventures LLP社からプレシリーズAで325万米ドルの資金提供を受けた。この資金調達により、リ・ヴァナ・セラピューティクスのEyeLiefとOcuLiefの生分解性技術の開発が促進され、低分子や生物製剤の送達に使用できるようになると期待されています。
さらに、高齢者人口の増加が眼科薬市場成長の主な促進要因となっています。Safe Eyes Americaによると、眼科疾患の最も一般的な危険因子は、高年齢、家族歴、糖尿病、高血圧です。例えば、AMERICA's HEALTH RANKINGS senior report 2021によると、米国には65歳以上の成人が5,400万人以上住んでおり、その人口は総人口の16.5%を占めると推定されています。黄斑変性症調査によると、AMDは60歳以上の米国人の失明原因の第1位です。
眼科用製品に対する継続的な薬事承認が市場の成長を支えていると思われます。例えば、参天製薬株式会社は2022年6月、ドライアイ治療薬ディクアスLX点眼液の日本における製造販売承認を取得したと発表しました。この点眼液は、投与回数を減らし、患者のコンプライアンスを向上させた改良型製剤です。
眼科薬市場:分析概要
- 抗VEGF薬セグメントは、需要の高まりと副作用の少なさにより、2024年に最大のシェアを占めました。
- 網膜障害は、加齢黄斑変性と糖尿病性網膜症の有病率の上昇により、2024年に最大の市場シェアを占めました。
- 局所投与経路は、薬剤を標的部位に送達できる利点や使いやすさなどの要因により、2024年に市場を独占しました。
- 点眼薬の需要の高まり、患者のコンプライアンスの高さ、OTC製品の入手のしやすさなどから、2024年には点眼薬セグメントが最大のシェアを占めると予想されます。
- アジア太平洋地域は、医療インフラの進歩、眼科製品の需要増加、患者数の多さから、予測期間中に最も速い成長を示すと予想されます。
目次
第1章 分析方法・範囲
第2章 エグゼクティブサマリー
第3章 眼科薬市場:変動要因・傾向・範囲
- 市場連関の見通し
- 親市場の見通し
- 関連/付随市場の見通し
- 市場力学
- 市場促進要因の分析
- 市場抑制要因の分析
- 眼科薬市場:分析ツール
- 業界分析:ポーターのファイブフォース分析
- PESTEL分析
第4章 眼科薬市場:薬剤クラス別の推定・動向分析
- セグメントダッシュボード
- 眼科薬市場:薬剤クラス別の変動分析
- 眼科薬市場:市場規模の予測と動向分析、薬剤クラス別 (2018~2030年)
- 抗アレルギー
- 抗VEGF剤
- 抗炎症
- 非ステロイド薬
- ステロイド
- 緑内障予防
- 遺伝子・細胞治療
- その他
第5章 眼科薬市場:疾患別の推定・動向分析
- セグメントダッシュボード
- 眼科薬市場:疾患別の変動分析
- 眼科薬市場:市場規模の予測と動向分析、疾患別 (2018~2030年)
- ドライアイ
- アレルギー
- 緑内障
- 感染
- 網膜疾患
- 投与方法別
- 種類別
- ぶどう膜炎
- その他
第6章 点眼薬市場:投与経路別の推定・動向分析
- セグメントダッシュボード
- 眼科薬市場:投与経路別の変動分析
- 眼科薬市場:市場規模の予測と動向分析、投与経路別 (2018~2030年)
- 局所
- 眼部局所
- 局所
第7章 眼科薬市場:投与方法別の推定・動向分析
- セグメントダッシュボード
- 眼科薬市場:投与方法別の変動分析
- 眼科薬市場:市場規模の予測と動向分析、投与方法別 (2018~2030年)
- ジェル
- 眼科用溶液・懸濁液
- カプセル・錠剤
- 目薬
- 軟膏
第8章 眼科薬市場:製品種類別の推定・動向分析
- セグメントダッシュボード
- 眼科薬市場:製品種類別の変動分析
- 眼科薬市場:市場規模の予測と動向分析、製品種類別 (2018~2030年)
- 市販薬 (OTC)
- 処方薬
第9章 眼科薬市場:医薬品の種類別の推定・動向分析
- セグメントダッシュボード
- 眼科薬市場:医薬品の種類別の変動分析
- 眼科薬市場:市場規模の予測と動向分析、医薬品の種類別 (2018~2030年)
- ブランド医薬品
- ジェネリック医薬品
第10章 眼科薬市場:地域別の推定・動向分析
- 市場シェア分析:地域別 (2023年・2030年)
- 市場ダッシュボード:地域別
- 世界市場のスナップショット:地域別
- 市場規模の予測と動向分析 (2018年~2030年)
- 北米
- 米国
- カナダ
- メキシコ
- 欧州
- 英国
- ドイツ
- フランス
- イタリア
- スペイン
- ノルウェー
- スウェーデン
- デンマーク
- アジア太平洋
- 日本
- 中国
- インド
- オーストラリア
- 韓国
- タイ
- ラテンアメリカ
- ブラジル
- アルゼンチン
- 中東・アフリカ
- 南アフリカ
- サウジアラビア
- アラブ首長国連邦
- クウェート
第11章 競合情勢
- 最近の動向と影響分析:主な市場参入企業別
- 企業/競合の分類
- ベンダー情勢
- 主要販売代理店およびチャネルパートナーのリスト
- Key customers
- Key company market share analysis, 2023
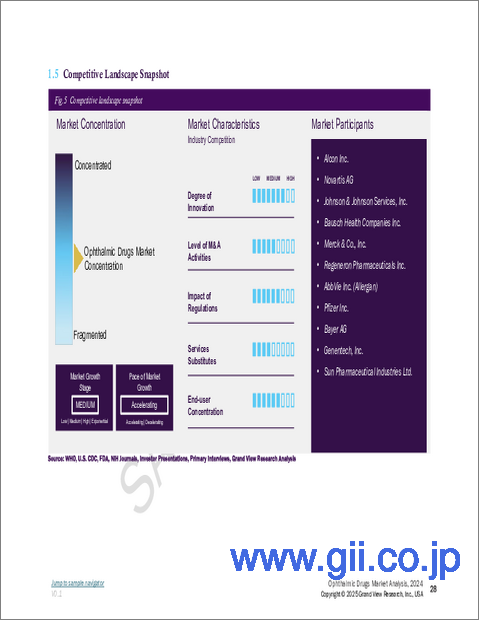
- Alcon
- Novartis AG
- Bausch Health Companies, Inc.
- Merck &Co., Inc.
- Regeneron Pharmaceuticals, Inc.
- Coherus BioSciences, Inc.
- AbbVie, Inc.(Allergan)
- Pfizer, Inc.
- Bayer AG
- Santen Pharmaceutical Co., Ltd.
- Roche(Genentech, Inc.)
- Nicox
List of Tables
- Table 1 List of abbreviations
- Table 2 North America ophthalmic drugs market, by region, 2018 - 2030 (USD Million)
- Table 3 North America ophthalmic drugs market, by drug class, 2018 - 2030 (USD Million)
- Table 4 North America ophthalmic drugs market, by disease, 2018 - 2030 (USD Million)
- Table 5 North America ophthalmic drugs market, by route of administration, 2018 - 2030 (USD Million)
- Table 6 North America ophthalmic drugs market, by dosage type, 2018 - 2030 (USD Million)
- Table 7 North America ophthalmic drugs market, by product type, 2018 - 2030 (USD Million)
- Table 8 North America ophthalmic drugs market, by drug type, 2018 - 2030 (USD Million)
- Table 9 U.S. ophthalmic drugs market, by drug class, 2018 - 2030 (USD Million)
- Table 10 U.S. ophthalmic drugs market, by disease, 2018 - 2030 (USD Million)
- Table 11 U.S. ophthalmic drugs market, by route of administration, 2018 - 2030 (USD Million)
- Table 12 U.S. ophthalmic drugs market, by dosage type, 2018 - 2030 (USD Million)
- Table 13 U.S. ophthalmic drugs market, by product type, 2018 - 2030 (USD Million)
- Table 14 U.S. ophthalmic drugs market, by drug type, 2018 - 2030 (USD Million)
- Table 15 Canada ophthalmic drugs market, by drug class, 2018 - 2030 (USD Million)
- Table 16 Canada ophthalmic drugs market, by disease, 2018 - 2030 (USD Million)
- Table 17 Canada ophthalmic drugs market, by route of administration, 2018 - 2030 (USD Million)
- Table 18 Canada ophthalmic drugs market, by dosage type, 2018 - 2030 (USD Million)
- Table 19 Canada ophthalmic drugs market, by product type, 2018 - 2030 (USD Million)
- Table 20 Canada ophthalmic drugs market, by drug type, 2018 - 2030 (USD Million)
- Table 21 Mexico ophthalmic drugs market, by drug class, 2018 - 2030 (USD Million)
- Table 22 Mexico ophthalmic drugs market, by disease, 2018 - 2030 (USD Million)
- Table 23 Mexico ophthalmic drugs market, by route of administration, 2018 - 2030 (USD Million)
- Table 24 Mexico ophthalmic drugs market, by dosage type, 2018 - 2030 (USD Million)
- Table 25 Mexico ophthalmic drugs market, by product type, 2018 - 2030 (USD Million)
- Table 26 Mexico ophthalmic drugs market, by drug type, 2018 - 2030 (USD Million)
- Table 27 Europe ophthalmic drugs market, by region, 2018 - 2030 (USD Million)
- Table 28 Europe ophthalmic drugs market, by drug class, 2018 - 2030 (USD Million)
- Table 29 Europe ophthalmic drugs market, by disease, 2018 - 2030 (USD Million)
- Table 30 Europe ophthalmic drugs market, by route of administration, 2018 - 2030 (USD Million)
- Table 31 Europe ophthalmic drugs market, by dosage type, 2018 - 2030 (USD Million)
- Table 32 Europe ophthalmic drugs market, by product type, 2018 - 2030 (USD Million)
- Table 33 Europe ophthalmic drugs market, by drug type, 2018 - 2030 (USD Million)
- Table 34 UK ophthalmic drugs market, by drug class, 2018 - 2030 (USD Million)
- Table 35 UK ophthalmic drugs market, by disease, 2018 - 2030 (USD Million)
- Table 36 UK ophthalmic drugs market, by route of administration, 2018 - 2030 (USD Million)
- Table 37 UK ophthalmic drugs market, by dosage type, 2018 - 2030 (USD Million)
- Table 38 UK ophthalmic drugs market, by product type, 2018 - 2030 (USD Million)
- Table 39 UK ophthalmic drugs market, by drug type, 2018 - 2030 (USD Million)
- Table 40 Germany ophthalmic drugs market, by drug class, 2018 - 2030 (USD Million)
- Table 41 Germany ophthalmic drugs market, by disease, 2018 - 2030 (USD Million)
- Table 42 Germany ophthalmic drugs market, by route of administration, 2018 - 2030 (USD Million)
- Table 43 Germany ophthalmic drugs market, by dosage type, 2018 - 2030 (USD Million)
- Table 44 Germany ophthalmic drugs market, by product type, 2018 - 2030 (USD Million)
- Table 45 Germany ophthalmic drugs market, by drug type, 2018 - 2030 (USD Million)
- Table 46 France ophthalmic drugs market, by drug class, 2018 - 2030 (USD Million)
- Table 47 France ophthalmic drugs market, by disease, 2018 - 2030 (USD Million)
- Table 48 France ophthalmic drugs market, by route of administration, 2018 - 2030 (USD Million)
- Table 49 France ophthalmic drugs market, by dosage type, 2018 - 2030 (USD Million)
- Table 50 France ophthalmic drugs market, by product type, 2018 - 2030 (USD Million)
- Table 51 France ophthalmic drugs market, by drug type, 2018 - 2030 (USD Million)
- Table 52 Italy ophthalmic drugs market, by drug class, 2018 - 2030 (USD Million)
- Table 53 Italy ophthalmic drugs market, by disease, 2018 - 2030 (USD Million)
- Table 54 Italy ophthalmic drugs market, by route of administration, 2018 - 2030 (USD Million)
- Table 55 Italy ophthalmic drugs market, by dosage type, 2018 - 2030 (USD Million)
- Table 56 Italy ophthalmic drugs market, by product type, 2018 - 2030 (USD Million)
- Table 57 Italy ophthalmic drugs market, by drug type, 2018 - 2030 (USD Million)
- Table 58 Spain ophthalmic drugs market, by drug class, 2018 - 2030 (USD Million)
- Table 59 Spain ophthalmic drugs market, by disease, 2018 - 2030 (USD Million)
- Table 60 Spain ophthalmic drugs market, by route of administration, 2018 - 2030 (USD Million)
- Table 61 Spain ophthalmic drugs market, by dosage type, 2018 - 2030 (USD Million)
- Table 62 Spain ophthalmic drugs market, by product type, 2018 - 2030 (USD Million)
- Table 63 Spain ophthalmic drugs market, by drug type, 2018 - 2030 (USD Million)
- Table 64 Denmark ophthalmic drugs market, by drug class, 2018 - 2030 (USD Million)
- Table 65 Denmark ophthalmic drugs market, by disease, 2018 - 2030 (USD Million)
- Table 66 Denmark ophthalmic drugs market, by route of administration, 2018 - 2030 (USD Million)
- Table 67 Denmark ophthalmic drugs market, by dosage type, 2018 - 2030 (USD Million)
- Table 68 Denmark ophthalmic drugs market, by product type, 2018 - 2030 (USD Million)
- Table 69 Denmark ophthalmic drugs market, by drug type, 2018 - 2030 (USD Million)
- Table 70 Sweden ophthalmic drugs market, by drug class, 2018 - 2030 (USD Million)
- Table 71 Sweden ophthalmic drugs market, by disease, 2018 - 2030 (USD Million)
- Table 72 Sweden ophthalmic drugs market, by route of administration, 2018 - 2030 (USD Million)
- Table 73 Sweden ophthalmic drugs market, by dosage type, 2018 - 2030 (USD Million)
- Table 74 Sweden ophthalmic drugs market, by product type, 2018 - 2030 (USD Million)
- Table 75 Sweden ophthalmic drugs market, by drug type, 2018 - 2030 (USD Million)
- Table 76 Norway ophthalmic drugs market, by drug class, 2018 - 2030 (USD Million)
- Table 77 Norway ophthalmic drugs market, by disease, 2018 - 2030 (USD Million)
- Table 78 Norway ophthalmic drugs market, by route of administration, 2018 - 2030 (USD Million)
- Table 79 Norway ophthalmic drugs market, by dosage type, 2018 - 2030 (USD Million)
- Table 80 Norway ophthalmic drugs market, by product type, 2018 - 2030 (USD Million)
- Table 81 Norway ophthalmic drugs market, by drug type, 2018 - 2030 (USD Million)
- Table 82 Asia Pacific ophthalmic drugs market, by region, 2018 - 2030 (USD Million)
- Table 83 Asia Pacific ophthalmic drugs market, by drug class, 2018 - 2030 (USD Million)
- Table 84 Asia Pacific ophthalmic drugs market, by disease, 2018 - 2030 (USD Million)
- Table 85 Asia Pacific ophthalmic drugs market, by route of administration, 2018 - 2030 (USD Million)
- Table 86 Asia Pacific ophthalmic drugs market, by dosage type, 2018 - 2030 (USD Million)
- Table 87 Asia Pacific ophthalmic drugs market, by product type, 2018 - 2030 (USD Million)
- Table 88 China ophthalmic drugs market, by drug class, 2018 - 2030 (USD Million)
- Table 89 China ophthalmic drugs market, by disease, 2018 - 2030 (USD Million)
- Table 90 China ophthalmic drugs market, by route of administration, 2018 - 2030 (USD Million)
- Table 91 China ophthalmic drugs market, by dosage type, 2018 - 2030 (USD Million)
- Table 92 China ophthalmic drugs market, by product type, 2018 - 2030 (USD Million)
- Table 93 China ophthalmic drugs market, by drug type, 2018 - 2030 (USD Million)
- Table 94 Japan ophthalmic drugs market, by drug class, 2018 - 2030 (USD Million)
- Table 95 Japan ophthalmic drugs market, by disease, 2018 - 2030 (USD Million)
- Table 96 Japan ophthalmic drugs market, by route of administration, 2018 - 2030 (USD Million)
- Table 97 Japan ophthalmic drugs market, by dosage type, 2018 - 2030 (USD Million)
- Table 98 Japan ophthalmic drugs market, by product type, 2018 - 2030 (USD Million)
- Table 99 Japan ophthalmic drugs market, by drug type, 2018 - 2030 (USD Million)
- Table 100 India ophthalmic drugs market, by drug class, 2018 - 2030 (USD Million)
- Table 101 India ophthalmic drugs market, by disease, 2018 - 2030 (USD Million)
- Table 102 India ophthalmic drugs market, by route of administration, 2018 - 2030 (USD Million)
- Table 103 India ophthalmic drugs market, by dosage type, 2018 - 2030 (USD Million)
- Table 104 India ophthalmic drugs market, by product type, 2018 - 2030 (USD Million)
- Table 105 India ophthalmic drugs market, by drug type, 2018 - 2030 (USD Million)
- Table 106 Australia ophthalmic drugs market, by drug class, 2018 - 2030 (USD Million)
- Table 107 Australia ophthalmic drugs market, by disease, 2018 - 2030 (USD Million)
- Table 108 Australia ophthalmic drugs market, by route of administration, 2018 - 2030 (USD Million)
- Table 109 Australia ophthalmic drugs market, by dosage type, 2018 - 2030 (USD Million)
- Table 110 Australia ophthalmic drugs market, by product type, 2018 - 2030 (USD Million)
- Table 111 Australia ophthalmic drugs market, by drug type, 2018 - 2030 (USD Million)
- Table 112 South Korea ophthalmic drugs market, by drug class, 2018 - 2030 (USD Million)
- Table 113 South Korea ophthalmic drugs market, by disease, 2018 - 2030 (USD Million)
- Table 114 South Korea ophthalmic drugs market, by route of administration, 2018 - 2030 (USD Million)
- Table 115 South Korea ophthalmic drugs market, by dosage type, 2018 - 2030 (USD Million)
- Table 116 South Korea ophthalmic drugs market, by product type, 2018 - 2030 (USD Million)
- Table 117 South Korea ophthalmic drugs market, by drug type, 2018 - 2030 (USD Million)
- Table 118 Thailand ophthalmic drugs market, by drug class, 2018 - 2030 (USD Million)
- Table 119 Thailand ophthalmic drugs market, by disease, 2018 - 2030 (USD Million)
- Table 120 Thailand ophthalmic drugs market, by route of administration, 2018 - 2030 (USD Million)
- Table 121 Thailand ophthalmic drugs market, by dosage type, 2018 - 2030 (USD Million)
- Table 122 Thailand ophthalmic drugs market, by product type, 2018 - 2030 (USD Million)
- Table 123 Thailand ophthalmic drugs market, by drug type, 2018 - 2030 (USD Million)
- Table 124 Latin America ophthalmic drugs market, by region, 2018 - 2030 (USD Million)
- Table 125 Latin America ophthalmic drugs market, by drug class, 2018 - 2030 (USD Million)
- Table 126 Latin America ophthalmic drugs market, by disease, 2018 - 2030 (USD Million)
- Table 127 Latin America ophthalmic drugs market, by route of administration, 2018 - 2030 (USD Million)
- Table 128 Latin America ophthalmic drugs market, by dosage type, 2018 - 2030 (USD Million)
- Table 129 Latin America ophthalmic drugs market, by product type, 2018 - 2030 (USD Million)
- Table 130 Latin America ophthalmic drugs market, by drug type, 2018 - 2030 (USD Million)
- Table 131 Brazil ophthalmic drugs market, by drug class, 2018 - 2030 (USD Million)
- Table 132 Brazil ophthalmic drugs market, by disease, 2018 - 2030 (USD Million)
- Table 133 Brazil ophthalmic drugs market, by route of administration, 2018 - 2030 (USD Million)
- Table 134 Brazil ophthalmic drugs market, by dosage type, 2018 - 2030 (USD Million)
- Table 135 Brazil ophthalmic drugs market, by product type, 2018 - 2030 (USD Million)
- Table 136 Brazil ophthalmic drugs market, by drug type, 2018 - 2030 (USD Million)
- Table 137 Argentina ophthalmic drugs market, by drug class, 2018 - 2030 (USD Million)
- Table 138 Argentina ophthalmic drugs market, by disease, 2018 - 2030 (USD Million)
- Table 139 Argentina ophthalmic drugs market, by route of administration, 2018 - 2030 (USD Million)
- Table 140 Argentina ophthalmic drugs market, by dosage type, 2018 - 2030 (USD Million)
- Table 141 Argentina ophthalmic drugs market, by product type, 2018 - 2030 (USD Million)
- Table 142 Argentina ophthalmic drugs market, by drug type, 2018 - 2030 (USD Million)
- Table 143 MEA ophthalmic drugs market, by region, 2018 - 2030 (USD Million)
- Table 144 MEA ophthalmic drugs market, by drug class, 2018 - 2030 (USD Million)
- Table 145 MEA ophthalmic drugs market, by disease, 2018 - 2030 (USD Million)
- Table 146 MEA ophthalmic drugs market, by route of administration, 2018 - 2030 (USD Million)
- Table 147 MEA ophthalmic drugs market, by dosage type, 2018 - 2030 (USD Million)
- Table 148 MEA ophthalmic drugs market, by product type, 2018 - 2030 (USD Million)
- Table 149 MEA ophthalmic drugs market, by drug type, 2018 - 2030 (USD Million)
- Table 150 South Africa ophthalmic drugs market, by drug class, 2018 - 2030 (USD Million)
- Table 151 South Africa ophthalmic drugs market, by disease, 2018 - 2030 (USD Million)
- Table 152 South Africa ophthalmic drugs market, by route of administration, 2018 - 2030 (USD Million)
- Table 153 South Africa ophthalmic drugs market, by dosage type, 2018 - 2030 (USD Million)
- Table 154 South Africa ophthalmic drugs market, by product type, 2018 - 2030 (USD Million)
- Table 155 South Africa ophthalmic drugs market, by drug type, 2018 - 2030 (USD Million)
- Table 156 Saudi Arabia ophthalmic drugs market, by drug class, 2018 - 2030 (USD Million)
- Table 157 Saudi Arabia ophthalmic drugs market, by disease, 2018 - 2030 (USD Million)
- Table 158 Saudi Arabia ophthalmic drugs market, by route of administration, 2018 - 2030 (USD Million)
- Table 159 Saudi Arabia ophthalmic drugs market, by dosage type, 2018 - 2030 (USD Million)
- Table 160 Saudi Arabia ophthalmic drugs market, by product type, 2018 - 2030 (USD Million)
- Table 161 Saudi Arabia ophthalmic drugs market, by drug type, 2018 - 2030 (USD Million)
- Table 162 UAE ophthalmic drugs market, by drug class, 2018 - 2030 (USD Million)
- Table 163 UAE ophthalmic drugs market, by disease, 2018 - 2030 (USD Million)
- Table 164 UAE ophthalmic drugs market, by route of administration, 2018 - 2030 (USD Million)
- Table 165 UAE ophthalmic drugs market, by dosage type, 2018 - 2030 (USD Million)
- Table 166 UAE ophthalmic drugs market, by product type, 2018 - 2030 (USD Million)
- Table 167 UAE ophthalmic drugs market, by drug type, 2018 - 2030 (USD Million)
- Table 168 Kuwait ophthalmic drugs market, by drug class, 2018 - 2030 (USD Million)
- Table 169 Kuwait ophthalmic drugs market, by disease, 2018 - 2030 (USD Million)
- Table 170 Kuwait ophthalmic drugs market, by route of administration, 2018 - 2030 (USD Million)
- Table 171 Kuwait ophthalmic drugs market, by dosage type, 2018 - 2030 (USD Million)
- Table 172 Kuwait ophthalmic drugs market, by product type, 2018 - 2030 (USD Million)
- Table 173 Kuwait ophthalmic drugs market, by drug type, 2018 - 2030 (USD Million)
List of Figures
- Fig. 1 Market research process
- Fig. 2 Data triangulation techniques
- Fig. 3 Primary research pattern
- Fig. 4 Primary interviews in North America
- Fig. 5 Primary interviews in Europe
- Fig. 6 Primary interviews in APAC
- Fig. 7 Primary interviews in Latin America
- Fig. 8 Primary interviews in MEA
- Fig. 9 Market research approaches
- Fig. 10 Value-chain-based sizing & forecasting
- Fig. 11 QFD modeling for market share assessment
- Fig. 12 Market formulation & validation
- Fig. 13 Ophthalmic drugs market: market outlook
- Fig. 14 Ophthalmic drugs competitive insights
- Fig. 15 Parent market outlook
- Fig. 16 Related/ancillary market outlook
- Fig. 17 Penetration and growth prospect mapping
- Fig. 18 Industry value chain analysis
- Fig. 19 Ophthalmic drugs market driver impact
- Fig. 20 Ophthalmic drugs market restraint impact
- Fig. 21 Ophthalmic drugs market strategic initiatives analysis
- Fig. 22 Ophthalmic drugs market: Drug class movement analysis
- Fig. 23 Ophthalmic drugs market: Drug class outlook and key takeaways
- Fig. 24 Anti-Allergy market estimates and forecasts, 2018 - 2030
- Fig. 25 Anti-VEGF agents market estimates and forecasts, 2018 - 2030
- Fig. 26 Anti-inflammatory market estimates and forecasts, 2018 - 2030
- Fig. 27 Non steroidal drugs market estimates and forecasts, 2018 - 2030
- Fig. 28 Steroidal drugs market estimates and forecasts, 2018 - 2030
- Fig. 29 Anti glaucoma market estimates and forecasts, 2018 - 2030
- Fig. 30 Gene & cell therapy market estimates and forecasts, 2018 - 2030
- Fig. 31 Others market estimates and forecasts, 2018 - 2030
- Fig. 32 Ophthalmic drugs market: Disease movement analysis
- Fig. 33 Ophthalmic drugs market: Disease outlook and key takeaways
- Fig. 34 Dry eye market estimates and forecasts, 2018 - 2030
- Fig. 35 Gels market estimates and forecasts, 2018 - 2030
- Fig. 36 Eye solutions & suspensions market estimates and forecasts, 2018 - 2030
- Fig. 37 Capsules & tablets market estimates and forecasts, 2018 - 2030
- Fig. 38 Eye drops market estimates and forecasts, 2018 - 2030
- Fig. 39 Ointments market estimates and forecasts, 2018 - 2030
- Fig. 40 Allergies market estimates and forecasts, 2018 - 2030
- Fig. 41 Gels market estimates and forecasts, 2018 - 2030
- Fig. 42 Eye solutions & suspensions market estimates and forecasts, 2018 - 2030
- Fig. 43 Capsules & tablets market estimates and forecasts, 2018 - 2030
- Fig. 44 Eye drops market estimates and forecasts, 2018 - 2030
- Fig. 45 Ointments market estimates and forecasts, 2018 - 2030
- Fig. 46 Glaucoma market estimates and forecasts, 2018 - 2030
- Fig. 47 Gels market estimates and forecasts, 2018 - 2030
- Fig. 48 Eye solutions & suspensions market estimates and forecasts, 2018 - 2030
- Fig. 49 Capsules & tablets market estimates and forecasts, 2018 - 2030
- Fig. 50 Eye drops market estimates and forecasts, 2018 - 2030
- Fig. 51 Ointments market estimates and forecasts, 2018 - 2030
- Fig. 52 Infection market estimates and forecasts, 2018 - 2030
- Fig. 53 Gels market estimates and forecasts, 2018 - 2030
- Fig. 54 Eye solutions & suspensions market estimates and forecasts, 2018 - 2030
- Fig. 55 Capsules & tablets market estimates and forecasts, 2018 - 2030
- Fig. 56 Eye drops market estimates and forecasts, 2018 - 2030
- Fig. 57 Ointments market estimates and forecasts, 2018 - 2030
- Fig. 58 Retinal disorders market estimates and forecasts, 2018 - 2030
- Fig. 59 By type market estimates and forecasts, 2018 - 2030
- Fig. 60 Macular degeneration market estimates and forecasts, 2018 - 2030
- Fig. 61 Diabetic retinopathy market estimates and forecasts, 2018 - 2030
- Fig. 62 Others market estimates and forecasts, 2018 - 2030
- Fig. 63 By dosage type market estimates and forecasts, 2018 - 2030
- Fig. 64 Gels market estimates and forecasts, 2018 - 2030
- Fig. 65 Eye solutions & suspensions market estimates and forecasts, 2018 - 2030
- Fig. 66 Capsules & tablets market estimates and forecasts, 2018 - 2030
- Fig. 67 Eye drops market estimates and forecasts, 2018 - 2030
- Fig. 68 Ointments market estimates and forecasts, 2018 - 2030
- Fig. 69 Uveitis market estimates and forecasts, 2018 - 2030
- Fig. 70 Gels market estimates and forecasts, 2018 - 2030
- Fig. 71 Eye solutions & suspensions market estimates and forecasts, 2018 - 2030
- Fig. 72 Capsules & tablets market estimates and forecasts, 2018 - 2030
- Fig. 73 Eye drops market estimates and forecasts, 2018 - 2030
- Fig. 74 Ointments market estimates and forecasts, 2018 - 2030
- Fig. 75 Others market estimates and forecasts, 2018 - 2030
- Fig. 76 Gels market estimates and forecasts, 2018 - 2030
- Fig. 77 Eye solutions & suspensions market estimates and forecasts, 2018 - 2030
- Fig. 78 Capsules & tablets market estimates and forecasts, 2018 - 2030
- Fig. 79 Eye drops market estimates and forecasts, 2018 - 2030
- Fig. 80 Ointments market estimates and forecasts, 2018 - 2030
- Fig. 81 Ophthalmic drugs market: Dosage type movement analysis
- Fig. 82 Ophthalmic drugs market: Dosage type outlook and key takeaways
- Fig. 83 Gels market estimates and forecasts, 2018 - 2030
- Fig. 84 Eye solutions & suspensions market estimates and forecasts, 2018 - 2030
- Fig. 85 Capsules & tablets market estimates and forecasts, 2018 - 2030
- Fig. 86 Eye drops market estimates and forecasts, 2018 - 2030
- Fig. 87 Ointments market estimates and forecasts, 2018 - 2030
- Fig. 88 Ophthalmic drugs market: Route of administration movement analysis
- Fig. 89 Ophthalmic drugs market: Route of administration outlook and key takeaways
- Fig. 90 Topical market estimates and forecasts, 2018 - 2030
- Fig. 91 Local Ocular market estimates and forecasts, 2018 - 2030
- Fig. 92 Subconjunctival market estimates and forecasts, 2018 - 2030
- Fig. 93 Intravitreal market estimates and forecasts, 2018 - 2030
- Fig. 94 Retrobulbar market estimates and forecasts, 2018 - 2030
- Fig. 95 Intracameral market estimates and forecasts, 2018 - 2030
- Fig. 96 Sytemic market estimates and forecasts, 2018 - 2030
- Fig. 97 Ophthalmic drugs market: Product type movement analysis
- Fig. 98 Ophthalmic drugs market: Product type outlook and key takeaways
- Fig. 99 OTC market estimates and forecasts, 2018 - 2030
- Fig. 100 Prescription drugs market estimates and forecasts, 2018 - 2030
- Fig. 101 Ophthalmic drugs market: Drug type movement analysis
- Fig. 102 Ophthalmic drugs market: Drug type outlook and key takeaways
- Fig. 103 Branded drugs market estimates and forecasts, 2018 - 2030
- Fig. 104 Generic drugs market estimates and forecasts, 2018 - 2030
- Fig. 105 Global ophthalmic drugs market: Regional movement analysis
- Fig. 106 Global ophthalmic drugs market: Regional outlook and key takeaways
- Fig. 107 Global ophthalmic drugs market share and leading players
- Fig. 108 North America market share and leading players
- Fig. 109 Europe market share and leading players
- Fig. 110 Asia Pacific market share and leading players
- Fig. 111 Latin America market share and leading players
- Fig. 112 Middle East & Africa market share and leading players
- Fig. 113 North America, by country
- Fig. 114 North America
- Fig. 115 North America market estimates and forecasts, 2018 - 2030
- Fig. 116 U.S. key country dynamics
- Fig. 117 U.S. market estimates and forecasts, 2018 - 2030
- Fig. 118 Canada country dynamics
- Fig. 119 Canada market estimates and forecasts, 2018 - 2030
- Fig. 120 Mexico country dynamics
- Fig. 121 Mexico market estimates and forecasts, 2018 - 2030
- Fig. 122 Europe
- Fig. 123 Europe market estimates and forecasts, 2018 - 2030
- Fig. 124 UK country dynamics
- Fig. 125 UK market estimates and forecasts, 2018 - 2030
- Fig. 126 Germany
- Fig. 127 Germany market estimates and forecasts, 2018 - 2030
- Fig. 128 France country dynamics
- Fig. 129 France market estimates and forecasts, 2018 - 2030
- Fig. 130 Italy country dynamics
- Fig. 131 Italy market estimates and forecasts, 2018 - 2030
- Fig. 132 Spain country dynamics
- Fig. 133 Spain market estimates and forecasts, 2018 - 2030
- Fig. 134 Denmark country dynamics
- Fig. 135 Denmark market estimates and forecasts, 2018 - 2030
- Fig. 136 Sweden country dynamics
- Fig. 137 Sweden market estimates and forecasts, 2018 - 2030
- Fig. 138 Norway country dynamics
- Fig. 139 Norway market estimates and forecasts, 2018 - 2030
- Fig. 140 Asia Pacific
- Fig. 141 Asia Pacific market estimates and forecasts, 2018 - 2030
- Fig. 142 China country dynamics
- Fig. 143 China market estimates and forecasts, 2018 - 2030
- Fig. 144 Japan country dynamics
- Fig. 145 Japan market estimates and forecasts, 2018 - 2030
- Fig. 146 India country dynamics
- Fig. 147 India market estimates and forecasts, 2018 - 2030
- Fig. 148 Thailand country dynamics
- Fig. 149 Thailand market estimates and forecasts, 2018 - 2030
- Fig. 150 South Korea country dynamics
- Fig. 151 South Korea market estimates and forecasts, 2018 - 2030
- Fig. 152 Australia country dynamics
- Fig. 153 Australia market estimates and forecasts, 2018 - 2030
- Fig. 154 Latin America
- Fig. 155 Latin America market estimates and forecasts, 2018 - 2030
- Fig. 156 Brazil country dynamics
- Fig. 157 Brazil market estimates and forecasts, 2018 - 2030
- Fig. 158 Argentina country dynamics
- Fig. 159 Argentina market estimates and forecasts, 2018 - 2030
- Fig. 160 Middle East and Africa
- Fig. 161 Middle East and Africa market estimates and forecasts, 2018 - 2030
- Fig. 162 South Africa country dynamics
- Fig. 163 South Africa market estimates and forecasts, 2018 - 2030
- Fig. 164 Saudi Arabia country dynamics
- Fig. 165 Saudi Arabia market estimates and forecasts, 2018 - 2030
- Fig. 166 UAE country dynamics
- Fig. 167 UAE market estimates and forecasts, 2018 - 2030
- Fig. 168 Kuwait country dynamics
- Fig. 169 Kuwait market estimates and forecasts, 2018 - 2030
- Fig. 170 Market share of key market players - Syndromic multiplex diagnostics market, 2023
- Fig. 171 Company Categorization
Ophthalmic Drugs Market Growth & Trends:
The global ophthalmic drugs market size is expected to reach USD 62.08 billion by 2030, garnering a CAGR of 8.5% from 2025 to 2030, according to a new report by Grand View Research, Inc. The rising awareness about ophthalmic disorders and the surge in demand for ophthalmic drugs are the factors propelling the market growth. Moreover, an increase in the prevalence of eye diseases such as age-related macular degeneration, cataract, dry eye, diabetic retinopathy, glaucoma, and others are anticipated to boost the demand for ophthalmic drugs.
According to BrightFocus Foundation in 2021, it is estimated that over 3 million Americans are living with glaucoma, and, among them over 2.7 million patients were affected by the most common type of glaucoma i.e. open-angle glaucoma. Moreover, 3.3 million people are affected by blindness and low vision in the U.S. Some of the major risk factors for glaucoma and blindness are, higher age, family history, thin cornea, and high eye pressure. This creates a wide population base for ophthalmic drugs, thereby, ensuring lucrative growth.
Furthermore, ocular therapeutic and drug delivery companies are receiving funding to expedite R&D for advancements in technologies to develop novel drugs, which is likely to fuel market growth. For instance, in June 2020, Re-Vana Therapeutics received USD 3.25 million in pre-series A funding from Qubis, ExSight Ventures, LLC, Clarendon Fund Managers, Visionary Ventures, and Techstart Ventures LLP. The funding is expected to boost the development of Re-Vana Therapeutics' EyeLief & OcuLief biodegradable technologies that can be used for a small molecule as well as biologics delivery.
Moreover, the rising geriatric population is the key driver for the ophthalmic drugs market growth. According to Safe Eyes America, the most common risk factors for ophthalmic diseases are high age, family history, diabetes, and high blood pressure. For instance, as per AMERICA's HEALTH RANKINGS senior report 2021 it was estimated that more than 54 million adults of age more than 65 live in the U.S., and that population accounted for 16.5% of the total population. According to Macular Degeneration Research AMD is the leading reason for blindness in U.S. people over the age of 60.
Ongoing regulatory approvals for ophthalmic products are likely to support market growth. For instance, in June 2022 Santen Pharmaceutical Co., Ltd announced that it has got marketing and manufacturing approval for the dry eye disease treatment DIQUAS LX ophthalmic solution in Japan. This solution is the improved formulation that has reduced dosing frequency and improved patient compliance.
Ophthalmic Drugs Market Report Highlights:
- Anti-VEGF agents segment held the largest share in 2024 owing to their rising demand and lesser adverse effects
- Retinal disorders held the largest market share in 2024 owing to the rising prevalence of age-related macular degeneration and diabetic retinopathy
- The topical route of administration dominated the market in 2024 owing to factors such as the benefits of the topical route as it delivers the drug to the targeted site and ease of use
- The eye drops segment is expected to hold the largest share in 2024 owing to rising demand for eye drops, high patient compliance, and availability of OTC products
- Asia Pacific is expected to exhibit the fastest growth over the forecast period due to advancements in healthcare infrastructure, increasing demand for eye products, and a large patient pool
Table of Contents
Chapter 1. Methodology and Scope
- 1.1. Market Segmentation & Scope
- 1.2. Segment Definitions
- 1.2.1. Drug class
- 1.2.2. Disease
- 1.2.3. Route of administration
- 1.2.4. Dosage type
- 1.2.5. Product type
- 1.2.6. Drug type
- 1.2.7. Regional scope
- 1.2.8. Estimates and forecasts timeline.
- 1.3. Research Methodology
- 1.4. Information Procurement
- 1.4.1. Purchased database
- 1.4.2. GVR's internal database
- 1.4.3. Secondary sources
- 1.4.4. Primary research
- 1.4.5. Details of primary research
- 1.5. Information or Data Analysis
- 1.5.1. Data analysis models
- 1.6. Market Formulation & Validation
- 1.7. Model Details
- 1.7.1. Commodity flow analysis (Model 1)
- 1.7.2. Approach 1: Commodity flow approach
- 1.7.3. Volume price analysis (Model 2)
- 1.7.4. Approach 2: Volume price analysis
- 1.8. List of Secondary Sources
- 1.9. List of Primary Sources
- 1.10. Objectives
Chapter 2. Executive Summary
- 2.1. Market Outlook
- 2.2. Segment Outlook
- 2.2.1. Drug class outlook
- 2.2.2. Disease outlook
- 2.2.3. Route of administration outlook
- 2.2.4. Dosage type outlook
- 2.2.5. Product type outlook
- 2.2.6. Drug type outlook
- 2.2.7. Regional outlook
- 2.3. Competitive Insights
Chapter 3. Ophthalmic Drugs Market Variables, Trends & Scope
- 3.1. Market Lineage Outlook
- 3.1.1. Parent market outlook
- 3.1.2. Related/ancillary market outlook.
- 3.2. Market Dynamics
- 3.2.1. Market driver analysis
- 3.2.1.1. Increasing diseases prevalence
- 3.2.1.2. String development pipeline
- 3.2.1.3. Advancements in drug delivery
- 3.2.2. Market restraint analysis
- 3.2.2.1. Patent expiry of blockbuster drugs
- 3.2.1. Market driver analysis
- 3.3. Ophthalmic Drugs Market Analysis Tools
- 3.3.1. Industry Analysis - Porter's
- 3.3.2. PESTEL Analysis
Chapter 4. Ophthalmic Drugs Market: Drug Class Estimates & Trend Analysis
- 4.1. Segment Dashboard
- 4.2. Ophthalmic Drugs Market: Drug Class Movement Analysis
- 4.3. Ophthalmic Drugs Market Size & Trend Analysis, by Drug Class, 2018 to 2030 (USD Million)
- 4.4. Anti-Allergy
- 4.4.1. Anti-Allergy market revenue estimates and forecasts, 2018 - 2030 (USD Million)
- 4.5. Anti-VEGF agents
- 4.5.1. Anti-VEGF agents market revenue estimates and forecasts, 2018 - 2030 (USD Million)
- 4.6. Anti-inflammatory
- 4.6.1. Anti-inflammatory market revenue estimates and forecasts, 2018 - 2030 (USD Million)
- 4.6.2. Non-steroidal Drugs
- 4.6.2.1. Non-steroidal Drugs market revenue estimates and forecasts, 2018 - 2030 (USD Million)
- 4.6.3. Steroids
- 4.6.3.1. Steroids market revenue estimates and forecasts, 2018 - 2030 (USD Million)
- 4.7. Anti-glaucoma
- 4.7.1. Anti-glaucoma market revenue estimates and forecasts, 2018 - 2030 (USD Million)
- 4.8. Gene & Cell Therapy
- 4.8.1. Gene & Cell Therapy market revenue estimates and forecasts, 2018 - 2030 (USD Million)
- 4.9. Others
- 4.9.1. Others market revenue estimates and forecasts, 2018 - 2030 (USD Million)
Chapter 5. Ophthalmic Drugs Market: Disease Estimates & Trend Analysis
- 5.1. Segment Dashboard
- 5.2. Ophthalmic Drugs Market: Disease Movement Analysis
- 5.3. Ophthalmic Drugs Market Size & Trend Analysis, by Disease, 2018 to 2030 (USD Million)
- 5.4. Dry eye
- 5.4.1. Dry eye market revenue estimates and forecasts, 2018 - 2030 (USD Million)
- 5.4.1.1. Gels
- 5.4.1.1.1. Gels market revenue estimates and forecasts, 2018 - 2030 (USD Million)
- 5.4.1.2. Eye solutions & suspensions
- 5.4.1.2.1. Eye solutions & suspensions market revenue estimates and forecasts, 2018 - 2030 (USD Million)
- 5.4.1.3. Capsules & tablets
- 5.4.1.3.1. Capsules & tablets market revenue estimates and forecasts, 2018 - 2030 (USD Million)
- 5.4.1.4. Eye drops
- 5.4.1.4.1. Eye drops market revenue estimates and forecasts, 2018 - 2030 (USD Million)
- 5.4.1.5. Ointments
- 5.4.1.5.1. Ointments market revenue estimates and forecasts, 2018 - 2030 (USD Million)
- 5.4.1.1. Gels
- 5.4.1. Dry eye market revenue estimates and forecasts, 2018 - 2030 (USD Million)
- 5.5. Allergies
- 5.5.1. Allergies market revenue estimates and forecasts, 2018 - 2030 (USD Million)
- 5.5.1.1. Gels
- 5.5.1.1.1. Gels market revenue estimates and forecasts, 2018 - 2030 (USD Million)
- 5.5.1.2. Eye solutions & suspensions
- 5.5.1.2.1. Eye solutions & suspensions market revenue estimates and forecasts, 2018 - 2030 (USD Million)
- 5.5.1.3. Capsules & tablets
- 5.5.1.3.1. Capsules & tablets market revenue estimates and forecasts, 2018 - 2030 (USD Million)
- 5.5.1.4. Eye drops
- 5.5.1.4.1. Eye drops market revenue estimates and forecasts, 2018 - 2030 (USD Million)
- 5.5.1.5. Ointments
- 5.5.1.5.1. Ointments market revenue estimates and forecasts, 2018 - 2030 (USD Million)
- 5.5.1.1. Gels
- 5.5.1. Allergies market revenue estimates and forecasts, 2018 - 2030 (USD Million)
- 5.6. Glaucoma
- 5.6.1. Glaucoma market revenue estimates and forecasts, 2018 - 2030 (USD Million)
- 5.6.1.1. Gels
- 5.6.1.1.1. Gels market revenue estimates and forecasts, 2018 - 2030 (USD Million)
- 5.6.1.2. Eye solutions & suspensions
- 5.6.1.2.1. Eye solutions & suspensions market revenue estimates and forecasts, 2018 - 2030 (USD Million)
- 5.6.1.3. Capsules & tablets
- 5.6.1.3.1. Capsules & tablets market revenue estimates and forecasts, 2018 - 2030 (USD Million)
- 5.6.1.4. Eye drops
- 5.6.1.4.1. Eye drops market revenue estimates and forecasts, 2018 - 2030 (USD Million)
- 5.6.1.5. Ointments
- 5.6.1.5.1. Ointments market revenue estimates and forecasts, 2018 - 2030 (USD Million)
- 5.6.1.1. Gels
- 5.6.1. Glaucoma market revenue estimates and forecasts, 2018 - 2030 (USD Million)
- 5.7. Infection
- 5.7.1. Infection market revenue estimates and forecasts, 2018 - 2030 (USD Million)
- 5.7.1.1. Gels
- 5.7.1.1.1. Gels market revenue estimates and forecasts, 2018 - 2030 (USD Million)
- 5.7.1.2. Eye solutions & suspensions
- 5.7.1.2.1. Eye solutions & suspensions market revenue estimates and forecasts, 2018 - 2030 (USD Million)
- 5.7.1.3. Capsules & tablets
- 5.7.1.3.1. Capsules & tablets market revenue estimates and forecasts, 2018 - 2030 (USD Million)
- 5.7.1.4. Eye drops
- 5.7.1.4.1. Eye drops market revenue estimates and forecasts, 2018 - 2030 (USD Million)
- 5.7.1.5. Ointments
- 5.7.1.5.1. Ointments market revenue estimates and forecasts, 2018 - 2030 (USD Million)
- 5.7.1.1. Gels
- 5.7.1. Infection market revenue estimates and forecasts, 2018 - 2030 (USD Million)
- 5.8. Retinal Disorders
- 5.8.1. Retinal disorders market revenue estimates and forecasts, 2018 - 2030 (USD Million)
- 5.8.2. By Dosage Type
- 5.8.2.1. Gels
- 5.8.2.1.1. Gels market revenue estimates and forecasts, 2018 - 2030 (USD Million)
- 5.8.2.2. Eye solutions & suspensions
- 5.8.2.2.1. Eye solutions & suspensions market revenue estimates and forecasts, 2018 - 2030 (USD Million)
- 5.8.2.3. Capsules & tablets
- 5.8.2.3.1. Capsules & tablets market revenue estimates and forecasts, 2018 - 2030 (USD Million)
- 5.8.2.4. Eye drops
- 5.8.2.4.1. Eye drops market revenue estimates and forecasts, 2018 - 2030 (USD Million)
- 5.8.2.5. Ointments
- 5.8.2.5.1. Ointments market revenue estimates and forecasts, 2018 - 2030 (USD Million)
- 5.8.2.1. Gels
- 5.8.3. By Type
- 5.8.3.1. Macular degeneration
- 5.8.3.1.1. Macular degeneration market revenue estimates and forecasts, 2018 - 2030 (USD Million)
- 5.8.3.2. Diabetic retinopathy
- 5.8.3.2.1. Diabetic retinopathy market revenue estimates and forecasts, 2018 - 2030 (USD Million)
- 5.8.3.3. Others
- 5.8.3.3.1. Others market revenue estimates and forecasts, 2018 - 2030 (USD Million)
- 5.8.3.1. Macular degeneration
- 5.9. Uveitis
- 5.9.1. Uveitis market revenue estimates and forecasts, 2018 - 2030 (USD Million)
- 5.9.1.1. Gels
- 5.9.1.1.1. Gels market revenue estimates and forecasts, 2018 - 2030 (USD Million)
- 5.9.1.2. Eye solutions & suspensions
- 5.9.1.2.1. Eye solutions & suspensions market revenue estimates and forecasts, 2018 - 2030 (USD Million)
- 5.9.1.3. Capsules & tablets
- 5.9.1.3.1. Capsules & tablets market revenue estimates and forecasts, 2018 - 2030 (USD Million)
- 5.9.1.4. Eye drops
- 5.9.1.4.1. Eye drops market revenue estimates and forecasts, 2018 - 2030 (USD Million)
- 5.9.1.5. Ointments
- 5.9.1.5.1. Ointments market revenue estimates and forecasts, 2018 - 2030 (USD Million)
- 5.9.1.1. Gels
- 5.9.1. Uveitis market revenue estimates and forecasts, 2018 - 2030 (USD Million)
- 5.10. Others
- 5.10.1. Others market revenue estimates and forecasts, 2018 - 2030 (USD Million)
- 5.10.1.1. Gels
- 5.10.1.1.1. Gels market revenue estimates and forecasts, 2018 - 2030 (USD Million)
- 5.10.1.2. Eye solutions & suspensions
- 5.10.1.2.1. Eye solutions & suspensions market revenue estimates and forecasts, 2018 - 2030 (USD Million)
- 5.10.1.3. Capsules & tablets
- 5.10.1.3.1. Capsules & tablets market revenue estimates and forecasts, 2018 - 2030 (USD Million)
- 5.10.1.4. Eye drops
- 5.10.1.4.1. Eye drops market revenue estimates and forecasts, 2018 - 2030 (USD Million)
- 5.10.1.5. Ointments
- 5.10.1.5.1. Ointments market revenue estimates and forecasts, 2018 - 2030 (USD Million)
- 5.10.1.1. Gels
- 5.10.1. Others market revenue estimates and forecasts, 2018 - 2030 (USD Million)
Chapter 6. Ophthalmic Drugs Market: Route of Administration Estimates & Trend Analysis
- 6.1. Segment Dashboard
- 6.2. Ophthalmic Drugs Market: Route of Administration Movement Analysis
- 6.3. Ophthalmic Drugs Market Size & Trend Analysis, by Route of Administration, 2018 to 2030 (USD Million)
- 6.4. Topical
- 6.4.1. Topical market revenue estimates and forecasts, 2018 - 2030 (USD Million)
- 6.5. Local Ocular
- 6.5.1. Local ocular market revenue estimates and forecasts, 2018 - 2030 (USD Million)
- 6.5.1.1. Subconjunctival
- 6.5.1.1.1. Subconjunctival market revenue estimates and forecasts, 2018 - 2030 (USD Million)
- 6.5.1.2. Intravitreal
- 6.5.1.2.1. Intravitreal market revenue estimates and forecasts, 2018 - 2030 (USD Million)
- 6.5.1.3. Retrobulbar
- 6.5.1.3.1. Retrobulbar market revenue estimates and forecasts, 2018 - 2030 (USD Million)
- 6.5.1.4. Intracameral
- 6.5.1.4.1. Intracameral market revenue estimates and forecasts, 2018 - 2030 (USD Million)
- 6.5.1.1. Subconjunctival
- 6.5.1. Local ocular market revenue estimates and forecasts, 2018 - 2030 (USD Million)
- 6.6. Sytemic
- 6.6.1. Sytemic market revenue estimates and forecasts, 2018 - 2030 (USD Million)
Chapter 7. Ophthalmic Drugs Market: Dosage Type Estimates & Trend Analysis
- 7.1. Segment Dashboard
- 7.2. Ophthalmic Drugs Market: Dosage Type Movement Analysis
- 7.3. Ophthalmic Drugs Market Size & Trend Analysis, by Dosage Type, 2018 to 2030 (USD Million)
- 7.4. Gels
- 7.4.1. Gels market revenue estimates and forecasts, 2018 - 2030 (USD Million)
- 7.5. Eye solutions & suspensions
- 7.5.1. Eye solutions & suspensions market revenue estimates and forecasts, 2018 - 2030 (USD Million)
- 7.6. Capsules & Tablets
- 7.6.1. Capsules & tablets market revenue estimates and forecasts, 2018 - 2030 (USD Million)
- 7.7. Eye drops
- 7.7.1. Eye drops market revenue estimates and forecasts, 2018 - 2030 (USD Million)
- 7.8. Ointments
- 7.8.1. Ointments market revenue estimates and forecasts, 2018 - 2030 (USD Million)
Chapter 8. Ophthalmic Drugs Market: Product Type Estimates & Trend Analysis
- 8.1. Segment Dashboard
- 8.2. Ophthalmic Drugs Market: Product Type Movement Analysis
- 8.3. Ophthalmic Drugs Market Size & Trend Analysis, by Product Type, 2018 to 2030 (USD Million)
- 8.4. OTC
- 8.4.1. OTC market revenue estimates and forecasts, 2018 - 2030 (USD Million)
- 8.5. Prescription Drugs
- 8.5.1. Prescription drugs market revenue estimates and forecasts, 2018 - 2030 (USD Million)
Chapter 9. Ophthalmic Drugs Market: Drug Type Estimates & Trend Analysis
- 9.1. Segment Dashboard
- 9.2. Ophthalmic Drugs Market: Drug Type Movement Analysis
- 9.3. Ophthalmic Drugs Market Size & Trend Analysis, by Drug Type, 2018 to 2030 (USD Million)
- 9.4. Branded Drugs
- 9.4.1. Branded drugs market revenue estimates and forecasts, 2018 - 2030 (USD Million)
- 9.5. Generic Drugs
- 9.5.1. Generic drugs market revenue estimates and forecasts, 2018 - 2030 (USD Million)
Chapter 10. Ophthalmic Drugs Market: Regional Estimates & Trend Analysis
- 10.1. Regional Market Share Analysis, 2023 & 2030
- 10.2. Regional Market Dashboard
- 10.3. Global Regional Market Snapshot
- 10.4. Market Size, & Forecasts Trend Analysis, 2018 to 2030:
- 10.5. North America
- 10.5.1. U.S.
- 10.5.1.1. Key country dynamics
- 10.5.1.2. Regulatory framework/Reimbursement
- 10.5.1.3. Competitive scenario
- 10.5.1.4. U.S. market estimates and forecasts 2018 to 2030 (USD Million)
- 10.5.2. Canada
- 10.5.2.1. Key country dynamics
- 10.5.2.2. Regulatory framework/Reimbursement
- 10.5.2.3. Competitive scenario
- 10.5.2.4. Canada market estimates and forecasts 2018 to 2030 (USD Million)
- 10.5.3. Mexico
- 10.5.3.1. Key country dynamics
- 10.5.3.2. Regulatory framework/Reimbursement
- 10.5.3.3. Competitive scenario
- 10.5.3.4. Mexico market estimates and forecasts 2018 to 2030 (USD Million)
- 10.5.1. U.S.
- 10.6. Europe
- 10.6.1. UK
- 10.6.1.1. Key country dynamics
- 10.6.1.2. Regulatory framework/Reimbursement
- 10.6.1.3. Competitive scenario
- 10.6.1.4. UK market estimates and forecasts 2018 to 2030 (USD Million)
- 10.6.2. Germany
- 10.6.2.1. Key country dynamics
- 10.6.2.2. Regulatory framework/Reimbursement
- 10.6.2.3. Competitive scenario
- 10.6.2.4. Germany market estimates and forecasts 2018 to 2030 (USD Million)
- 10.6.3. France
- 10.6.3.1. Key country dynamics
- 10.6.3.2. Regulatory framework/Reimbursement
- 10.6.3.3. Competitive scenario
- 10.6.3.4. France market estimates and forecasts 2018 to 2030 (USD Million)
- 10.6.4. Italy
- 10.6.4.1. Key country dynamics
- 10.6.4.2. Regulatory framework/Reimbursement
- 10.6.4.3. Competitive scenario
- 10.6.4.4. Italy market estimates and forecasts 2018 to 2030 (USD Million)
- 10.6.5. Spain
- 10.6.5.1. Key country dynamics
- 10.6.5.2. Regulatory framework/Reimbursement
- 10.6.5.3. Competitive scenario
- 10.6.5.4. Spain market estimates and forecasts 2018 to 2030 (USD Million)
- 10.6.6. Norway
- 10.6.6.1. Key country dynamics
- 10.6.6.2. Regulatory framework/Reimbursement
- 10.6.6.3. Competitive scenario
- 10.6.6.4. Norway market estimates and forecasts 2018 to 2030 (USD Million)
- 10.6.7. Sweden
- 10.6.7.1. Key country dynamics
- 10.6.7.2. Regulatory framework/Reimbursement
- 10.6.7.3. Competitive scenario
- 10.6.7.4. Sweden market estimates and forecasts 2018 to 2030 (USD Million)
- 10.6.8. Denmark
- 10.6.8.1. Key country dynamics
- 10.6.8.2. Regulatory framework/Reimbursement
- 10.6.8.3. Competitive scenario
- 10.6.8.4. Denmark market estimates and forecasts 2018 to 2030 (USD Million)
- 10.6.1. UK
- 10.7. Asia Pacific
- 10.7.1. Japan
- 10.7.1.1. Key country dynamics
- 10.7.1.2. Regulatory framework/Reimbursement
- 10.7.1.3. Competitive scenario
- 10.7.1.4. Japan market estimates and forecasts 2018 to 2030 (USD Million)
- 10.7.2. China
- 10.7.2.1. Key country dynamics
- 10.7.2.2. Regulatory framework/Reimbursement
- 10.7.2.3. Competitive scenario
- 10.7.2.4. China market estimates and forecasts 2018 to 2030 (USD Million)
- 10.7.3. India
- 10.7.3.1. Key country dynamics
- 10.7.3.2. Regulatory framework/Reimbursement
- 10.7.3.3. Competitive scenario
- 10.7.3.4. India market estimates and forecasts 2018 to 2030 (USD Million)
- 10.7.4. Australia
- 10.7.4.1. Key country dynamics
- 10.7.4.2. Regulatory framework/Reimbursement
- 10.7.4.3. Competitive scenario
- 10.7.4.4. Australia market estimates and forecasts 2018 to 2030 (USD Million)
- 10.7.5. South Korea
- 10.7.5.1. Key country dynamics
- 10.7.5.2. Regulatory framework/Reimbursement
- 10.7.5.3. Competitive scenario
- 10.7.5.4. South Korea market estimates and forecasts 2018 to 2030 (USD Million)
- 10.7.6. Thailand
- 10.7.6.1. Key country dynamics
- 10.7.6.2. Regulatory framework/Reimbursement
- 10.7.6.3. Competitive scenario
- 10.7.6.4. Thailand market estimates and forecasts 2018 to 2030 (USD Million)
- 10.7.1. Japan
- 10.8. Latin America
- 10.8.1. Brazil
- 10.8.1.1. Key country dynamics
- 10.8.1.2. Regulatory framework/Reimbursement
- 10.8.1.3. Competitive scenario
- 10.8.1.4. Brazil market estimates and forecasts 2018 to 2030 (USD Million)
- 10.8.2. Argentina
- 10.8.2.1. Key country dynamics
- 10.8.2.2. Regulatory framework/Reimbursement
- 10.8.2.3. Competitive scenario
- 10.8.2.4. Argentina market estimates and forecasts 2018 to 2030 (USD Million)
- 10.8.1. Brazil
- 10.9. MEA
- 10.9.1. South Africa
- 10.9.1.1. Key country dynamics
- 10.9.1.2. Regulatory framework/Reimbursement
- 10.9.1.3. Competitive scenario
- 10.9.1.4. South Africa market estimates and forecasts 2018 to 2030 (USD Million)
- 10.9.2. Saudi Arabia
- 10.9.2.1. Key country dynamics
- 10.9.2.2. Regulatory framework/Reimbursement
- 10.9.2.3. Competitive scenario
- 10.9.2.4. Saudi Arabia market estimates and forecasts 2018 to 2030 (USD Million)
- 10.9.3. UAE
- 10.9.3.1. Key country dynamics
- 10.9.3.2. Regulatory framework/Reimbursement
- 10.9.3.3. Competitive scenario
- 10.9.3.4. UAE market estimates and forecasts 2018 to 2030 (USD Million)
- 10.9.4. Kuwait
- 10.9.4.1. Key country dynamics
- 10.9.4.2. Regulatory framework
- 10.9.4.3. Competitive scenario
- 10.9.4.4. Kuwait market estimates and forecasts 2018 to 2030 (USD Million)
- 10.9.1. South Africa
Chapter 11. Competitive Landscape
- 11.1. Recent Developments & Impact Analysis, By Key Market Participants
- 11.2. Company/Competition Categorization
- 11.3. Vendor Landscape
- 11.3.1. List of key distributors and channel partners
- 11.3.2. Key customers
- 11.3.3. Key company market share analysis, 2023
- 11.3.4. Alcon
- 11.3.4.1. Company overview
- 11.3.4.2. Financial performance
- 11.3.4.3. Services benchmarking
- 11.3.4.4. Strategic initiatives
- 11.3.5. Novartis AG
- 11.3.5.1. Company overview
- 11.3.5.2. Financial performance
- 11.3.5.3. Services benchmarking
- 11.3.5.4. Strategic initiatives
- 11.3.6. Bausch Health Companies, Inc.
- 11.3.6.1. Company overview
- 11.3.6.2. Financial performance
- 11.3.6.3. Services benchmarking
- 11.3.6.4. Strategic initiatives
- 11.3.7. Merck & Co., Inc.
- 11.3.7.1. Company overview
- 11.3.7.2. Financial performance
- 11.3.7.3. Services benchmarking
- 11.3.7.4. Strategic initiatives
- 11.3.8. Regeneron Pharmaceuticals, Inc.
- 11.3.8.1. Company overview
- 11.3.8.2. Financial performance
- 11.3.8.3. Services benchmarking
- 11.3.8.4. Strategic initiatives
- 11.3.9. Coherus BioSciences, Inc.
- 11.3.9.1. Company overview
- 11.3.9.2. Financial performance
- 11.3.9.3. Services benchmarking
- 11.3.9.4. Strategic initiatives
- 11.3.10. AbbVie, Inc. (Allergan)
- 11.3.10.1. Company overview
- 11.3.10.2. Financial performance
- 11.3.10.3. Services benchmarking
- 11.3.10.4. Strategic initiatives
- 11.3.11. Pfizer, Inc.
- 11.3.11.1. Company overview
- 11.3.11.2. Financial performance
- 11.3.11.3. Services benchmarking
- 11.3.11.4. Strategic initiatives
- 11.3.12. Bayer AG
- 11.3.12.1. Company overview
- 11.3.12.2. Financial performance
- 11.3.12.3. Services benchmarking
- 11.3.12.4. Strategic initiatives
- 11.3.13. Santen Pharmaceutical Co., Ltd.
- 11.3.13.1. Company overview
- 11.3.13.2. Financial performance
- 11.3.13.3. Services benchmarking
- 11.3.13.4. Strategic initiatives
- 11.3.14. Roche (Genentech, Inc.)
- 11.3.14.1. Company overview
- 11.3.14.2. Financial performance
- 11.3.14.3. Services benchmarking
- 11.3.14.4. Strategic initiatives
- 11.3.15. Nicox
- 11.3.15.1. Company overview
- 11.3.15.2. Financial performance
- 11.3.15.3. Services benchmarking
- 11.3.15.4. Strategic initiatives
