|
|
市場調査レポート
商品コード
1790404
米国の抗体薬物複合体の市場規模、シェア、動向分析レポート:用途別、技術別、製品別、ターゲット別、セグメント別予測、2025年~2030年U.S. Antibody Drug Conjugates Market Size, Share & Trends Analysis Report By Application (Blood Cancer, Breast Cancer, Urothelial Cancer & Bladder Cancer), By Technology, By Product, By Target, And Segment Forecasts, 2025 - 2030 |
||||||
|
|||||||
カスタマイズ可能
|
|||||||

| 米国の抗体薬物複合体の市場規模、シェア、動向分析レポート:用途別、技術別、製品別、ターゲット別、セグメント別予測、2025年~2030年 |
|
出版日: 2025年07月14日
発行: Grand View Research
ページ情報: 英文 80 Pages
納期: 2~10営業日
|

全表示
- 概要
- 図表
- 目次
米国の抗体薬物複合体市場のサマリー
米国の抗体薬物複合体の市場規模は、2024年に71億5,000万米ドルと評価され、2025年から2030年にかけてCAGR 4.9%で成長し、2030年には106億米ドルに達すると予測されています。この背景には、がん罹患率の増加や、低毒性で効果的な医薬品に対する需要の増加があります。
また、製薬会社やバイオテクノロジー企業は抗体薬物複合体(ADC)の研究開発に多額の投資を行っており、市場成長を後押ししています。米国におけるがん患者数の増加は、ADCのような標的治療薬への需要を大きく促進しています。米国がん協会(American Cancer Society Inc.)によると、2024年には米国で新たに200万人以上のがん患者が発見されました。がん患者数は、高齢化、ライフスタイルの変化、診断能力の向上など様々な要因によって増加しています。ADCは、細胞毒性薬剤をがん細胞に直接送達し、健康な組織へのダメージを軽減する、高度に焦点を絞ったアプローチを提供します。この精度の高さにより、ADCは従来の化学療法よりも、特に課題の多いがんに好まれています。
資金調達の増加により、ADCの開発は、がん領域以外にも幅広い適応症で加速しています。例えば、2025年3月、がん治療を目的としたマルチペイロードADCに特化したバイオテクノロジー企業であるカリオ・セラピューティクスは、Frazier Life Sciencesが主導するシリーズA資金調達で1億8,700万米ドルを確保した後、その立ち上げを宣言しました。カリオはこの資金で、HER2を標的としたデュアルペイロードADCの臨床実証を進める予定です。
抗体製造、リンカー安定性、細胞毒性ペイロードにおける技術革新の高まりは、効果的でより安全なADCの開発につながっています。2024年9月、メルクはメビウスADCリアクターを発売しました。このリアクターは、健康な組織を傷つけずに腫瘍細胞を正確に標的として排除するADCを製造するために設計されたシングルユースリアクターです。
合併・買収(M&A)は緩やかで、著名な製薬会社はがん領域のポートフォリオを改善するため、ADC技術に精通した企業の買収に注力しています。例えば、2024年3月、ジョンソン・エンド・ジョンソン・サービス社はAmbrx Biopharma社を買収しました。同社は次世代ADCを開発・設計するための独自の合成生物学的技術プラットフォームを有しています。これにより、患者の生活を向上させる差別化された固形がん治療が期待されます。
目次
第1章 調査手法と範囲
第2章 エグゼクティブサマリー
第3章 米国の抗体薬物複合体市場の変数、動向、範囲
- 市場系統の見通し
- 親市場の見通し
- 関連市場見通し
- 業界バリューチェーン分析
- 規制の枠組み
- 市場力学
- 市場促進要因分析
- 市場抑制要因分析
- 業界の課題
- 業界の機会
- 業界分析ツール
- ポーターのファイブフォース分析
- マクロ環境分析
第4章 米国の抗体薬物複合体市場:用途推定・動向分析
- セグメントダッシュボード
- 米国の抗体薬物複合体市場:用途変動分析と市場シェア、2024年と2030年
- 血液のがん
- 白血病
- リンパ腫
- 多発性骨髄腫
- 乳がん
- 尿路上皮がんと膀胱がん
- その他のがん
第5章 米国の抗体薬物複合体市場:製品推定・動向分析
- セグメントダッシュボード
- 米国の抗体薬物複合体市場:製品変動分析と市場シェア、2024年と2030年
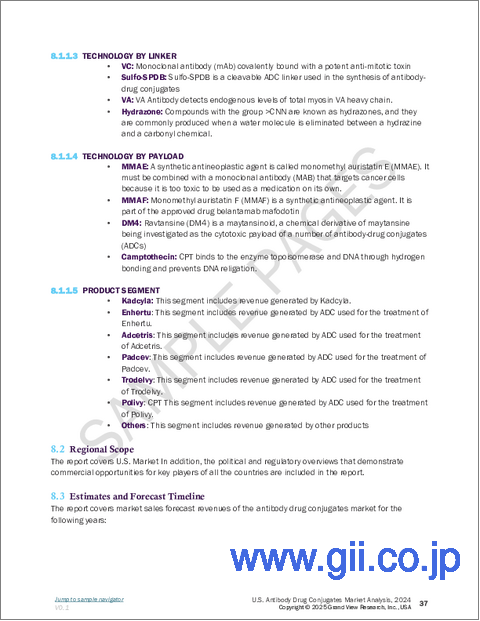
- カドシラ
- エンヘルトゥ
- アドセトリス
- パドチェフ
- トロデルヴィ
- ポリヴィ
- その他
第6章 米国の抗体薬物複合体市場:ターゲット推定・動向分析
- セグメントダッシュボード
- 米国の抗体薬物複合体市場:ターゲット変動分析と市場シェア、2024年と2030年
- HER2
- CD22
- CD30
- その他
第7章 米国の抗体薬物複合体市場:技術推定・動向分析
- セグメントダッシュボード
- 米国の抗体薬物複合体市場:技術変動分析と市場シェア、2024年と2030年
- タイプ
- 切断可能なリンカー
- 切断不可能なリンカー
- リンクレス
- リンカーテクノロジータイプ
- VC
- スルホ-SPDB
- VA
- ヒドラゾン
- その他
- ペイロード技術
- MMAE
- MMAF
- DM4
- カンプトテシン
- その他
第8章 米国の抗体薬物複合体市場-競合情勢
- 主要市場参入企業による最近の動向と影響分析
- 企業分類
- 企業ヒートマップ
- Position Analysis, 2024
- 戦略マッピング
- 拡大
- 合併と買収
- パートナーシップとコラボレーション
- 新製品の発売
- 研究開発
- 企業プロファイル
- Seagen, Inc.
- Takeda Pharmaceutical Company Ltd.
- AstraZeneca
- F. Hoffmann-La Roche Ltd.
- Pfizer, Inc.
- Gilead Sciences, Inc.
- Daiichi Sankyo Company Ltd.
- GlaxoSmithKline Plc
- Astellas Pharma, Inc.
- ADC Therapeutics SA
List of Tables
- Table 1 List of abbreviations
- Table 2 U.S. antibody drug conjugates market 2018 - 2030 (USD Million)
- Table 3 U.S. antibody drug conjugates market estimates and forecasts by application, 2018 - 2030 (USD Million)
- Table 4 U.S. antibody drug conjugates market estimates and forecasts by product, 2018 - 2030 (USD Million)
- Table 5 U.S. antibody drug conjugates market estimates and forecasts by target, 2018 - 2030 (USD Million)
- Table 6 U.S. antibody drug conjugates market estimates and forecasts by technology, 2018 - 2030 (USD Million)
List of Figures
- Fig. 1 Market Research Process
- Fig. 2 Data Triangulation Techniques
- Fig. 3 Primary Research Pattern
- Fig. 4 Market Research Approaches
- Fig. 5 QFD Modeling for Market Share Assessment
- Fig. 6 Information Procurement
- Fig. 7 Market Formulation and Validation
- Fig. 8 Data Validating & Publishing
- Fig. 9 Market Segmentation & Scope
- Fig. 10 U.S. Antibody Drug Conjugates Market Snapshot
- Fig. 11 Segment Snapshot (1/2)
- Fig. 12 Segment Snapshot (1/2)
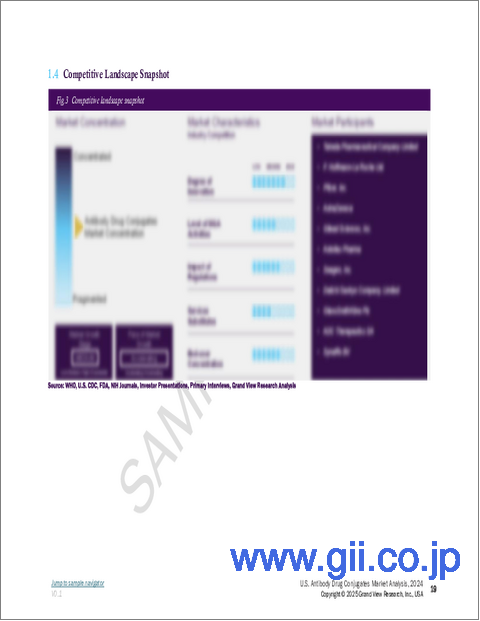
- Fig. 13 Competitive Landscape Snapshot
- Fig. 14 Parent market outlook
- Fig. 15 U.S. Antibody Drug Conjugates Market Value, 2024 (USD Million)
- Fig. 16 U.S. Antibody Drug Conjugates Market - Value Chain Analysis
- Fig. 17 U.S. Antibody Drug Conjugates Market - Market Dynamics
- Fig. 18 U.S. Antibody Drug Conjugates Market - PORTER's Analysis
- Fig. 19 U.S. Antibody Drug Conjugates Market - PESTEL Analysis
- Fig. 20 U.S. Antibody Drug Conjugates Market Estimates & Forecasts, by Application: Key Takeaways
- Fig. 21 U.S. Antibody Drug Conjugates Market Share, by Application, 2024 & 2030
- Fig. 22 U.S. Antibody Drug Conjugates Market Estimates & Forecasts, by Application: Key Takeaways
- Fig. 23 Blood Cancer Market Estimates & Forecasts, 2018 - 2030 (USD Million)
- Fig. 24 Leukemia Market Estimates & Forecasts, 2018 - 2030 (USD Million)
- Fig. 25 Lymphoma Market Estimates & Forecasts, 2018 - 2030 (USD Million)
- Fig. 26 Multiple Myeloma Market Estimates & Forecasts, 2018 - 2030 (USD Million)
- Fig. 27 Breast Cancer Market Estimates & Forecasts, 2018 - 2030 (USD Million)
- Fig. 28 Urothelial Cancer & Bladder Cancer Market Estimates & Forecasts, 2018 - 2030 (USD Million)
- Fig. 29 Other Cancer Market Estimates & Forecasts, 2018 - 2030 (USD Million)
- Fig. 30 U.S. Antibody Drug Conjugates Market Estimates & Forecasts, by Product: Key Takeaways
- Fig. 31 U.S. Antibody Drug Conjugates Market Share, by Product, 2024 & 2030
- Fig. 32 Kadcyla Market Estimates & Forecasts, 2018 - 2030 (USD Million)
- Fig. 33 Enhertu Market Estimates & Forecasts, 2018 - 2030 (USD Million)
- Fig. 34 Adcetris Market Estimates & Forecasts, 2018 - 2030 (USD Million)
- Fig. 35 Padcev Market Estimates & Forecasts, 2018 - 2030 (USD Million)
- Fig. 36 Trodelvy Market Estimates & Forecasts, 2018 - 2030 (USD Million)
- Fig. 37 Polivy Market Estimates & Forecasts, 2018 - 2030 (USD Million)
- Fig. 38 Others Market Estimates & Forecasts, 2018 - 2030 (USD Million)
- Fig. 39 U.S. Antibody Drug Conjugates Market Estimates & Forecasts, by Target: Key Takeaways
- Fig. 40 U.S. Antibody Drug Conjugates Market Share, by Target, 2024 & 2030
- Fig. 41 HER2 Market Estimates & Forecasts, 2018 - 2030 (USD Million)
- Fig. 42 CD22 Market Estimates & Forecasts, 2018 - 2030 (USD Million)
- Fig. 43 CD30 Market Estimates & Forecasts, 2018 - 2030 (USD Million)
- Fig. 44 Others Market Estimates & Forecasts, 2018 - 2030 (USD Million)
- Fig. 45 U.S. Antibody Drug Conjugates Market Estimates & Forecasts, by Technology: Key Takeaways
- Fig. 46 U.S. Antibody Drug Conjugates Market Share, by Technology, 2024 & 2030
- Fig. 47 Type Market Estimates & Forecasts, 2018 - 2030 (USD Million)
- Fig. 48 Cleavable Linker Market Estimates & Forecasts, 2018 - 2030 (USD Million)
- Fig. 49 Non-cleavable Linker Market Estimates & Forecasts, 2018 - 2030 (USD Million)
- Fig. 50 Linkerless Market Estimates & Forecasts, 2018 - 2030 (USD Million)
- Fig. 51 Linker Technology Type Market Estimates & Forecasts, 2018 - 2030 (USD Million)
- Fig. 52 VC Market Estimates & Forecasts, 2018 - 2030 (USD Million)
- Fig. 53 Sulfo-SPDB Market Estimates & Forecasts, 2018 - 2030 (USD Million)
- Fig. 54 VA Market Estimates & Forecasts, 2018 - 2030 (USD Million)
- Fig. 55 Hydrazone Market Estimates & Forecasts, 2018 - 2030 (USD Million)
- Fig. 56 Others Market Estimates & Forecasts, 2018 - 2030 (USD Million)
- Fig. 57 Payload Technology Market Estimates & Forecasts, 2018 - 2030 (USD Million)
- Fig. 58 MMAE Market Estimates & Forecasts, 2018 - 2030 (USD Million)
- Fig. 59 MMAF Market Estimates & Forecasts, 2018 - 2030 (USD Million)
- Fig. 60 DM4 Market Estimates & Forecasts, 2018 - 2030 (USD Million)
- Fig. 61 Camptothecin Market Estimates & Forecasts, 2018 - 2030 (USD Million)
- Fig. 62 Others Market Estimates & Forecasts, 2018 - 2030 (USD Million)
- Fig. 63 Key Company Categorization
- Fig. 64 Company Market Positioning
- Fig. 65 Strategy Mapping
U.S. Antibody Drug Conjugates Market Summary
The U.S. antibody drug conjugates market size was valued at USD 7.15 billion in 2024 and is projected to reach USD 10.60 billion by 2030, growing at a CAGR of 4.9% from 2025 to 2030. This can be attributed to the increasing incidence of cancer cases and increased demand for low-toxicity & effective drugs.
Also, pharmaceutical and biotech companies are investing heavily in researching and developing antibody drug conjugates (ADCs), propelling market growth. The growing number of cancer cases in the U.S. significantly fuels demand for targeted therapies like ADCs. According to the American Cancer Society Inc., in 2024, over 2 million new cancer cases were detected in the U.S. The number of cancer cases is rising due to various factors such as aging populations, lifestyle changes, and improved diagnostic capabilities. ADCs offer a highly focused approach that delivers cytotoxic drugs straight to cancer cells, reducing damage to healthy tissues. This accuracy makes ADCs preferred to traditional chemotherapy, especially for challenging cancers.
The rising funding is accelerating the development of ADCs across a wider range of indications beyond oncology. For instance, in March 2025, Callio Therapeutics, a biotechnology firm dedicated to multi-payload ADCs aimed at cancer treatment, declared its launch after securing USD 187 million in Series A funding led by Frazier Life Sciences. Callio intends to use the funds to progress clinical proof-of-concept for its HER2-targeted dual-payload ADC.
The rising technological innovations in antibody manufacturing, linker stability, and cytotoxic payloads have led to the development of effective and safer ADCs. In September 2024, Merck launched the Mobius ADC Reactor, a single-use reactor designed to manufacture ADCs that precisely target and eliminate tumor cells while leaving healthy tissue unharmed.
Mergers and acquisitions (M&A) are moderate, with prominent pharmaceutical companies focusing on acquiring companies with expertise in ADC technologies to improve their oncology portfolios. For instance, in March 2024, Johnson & Johnson Services, Inc. acquired Ambrx Biopharma, Inc. It has a proprietary synthetic biology technology platform to develop and design next-generation ADC. This is expected to deliver differentiated solid tumor treatment to improve the lives of patients'.
U.S. Antibody Drug Conjugates Market Report Segmentation
This report forecasts revenue growth at country level and provides an analysis of the latest industry trends in each of the sub-segments from 2018 to 2030. For this study, Grand View Research has segmented the U.S. antibody drug conjugates market report based on application, product, target, and technology:
- Application (Revenue, USD Million, 2018 - 2030)
- Blood Cancer
- Leukemia
- Lymphoma
- Multiple Myeloma
- Breast Cancer
- Urothelial Cancer & Bladder Cancer
- Other Cancer
- Product Outlook (Revenue, USD Million, 2018 - 2030)
- Kadcyla
- Enhertu
- Adcetris
- Padcev
- Trodelvy
- Polivy
- Others
- Target Outlook (Revenue, USD Million, 2018 - 2030)
- HER2
- CD22
- CD30
- Others
- Technology Outlook (Revenue, USD Million, 2018 - 2030)
- Type
- Cleavable Linker
- Non-cleavable Linker
- Linkerless
- Linker Technology Type
- VC
- Sulfo-SPDB
- VA
- Hydrazone
- Others
- Payload Technology
- MMAE
- MMAF
- DM4
- Camptothecin
- Others
Table of Contents
Chapter 1. Methodology and Scope
- 1.1. Market Segmentation & Scope
- 1.2. Market Definition
- 1.3. Information Procurement
- 1.3.1. Purchased Database
- 1.3.2. GVR's Internal Database
- 1.3.3. Secondary Sources & Third-Party Perspectives
- 1.3.4. Primary Research
- 1.4. Information Analysis
- 1.4.1. Data Analysis Models
- 1.5. Market Formulation & Data Visualization
- 1.6. Data Validation & Publishing
Chapter 2. Executive Summary
- 2.1. Market Snapshot
- 2.2. Segment Snapshot
- 2.3. Competitive Landscape Snapshot
Chapter 3. U.S. Antibody Drug Conjugates Market Variables, Trends & Scope
- 3.1. Market Lineage Outlook
- 3.1.1. Parent Market Outlook
- 3.1.2. Related Market Outlook
- 3.2. Industry Value Chain Analysis
- 3.3. Regulatory Framework
- 3.4. Market Dynamics
- 3.4.1. Market Driver Analysis
- 3.4.2. Market Restraint Analysis
- 3.4.3. Industry Challenges
- 3.4.4. Industry Opportunities
- 3.5. Industry Analysis Tools
- 3.5.1. Porter's Five Forces Analysis
- 3.5.2. Macro-environmental Analysis
Chapter 4. U.S. Antibody Drug Conjugates Market: Application Estimates & Trend Analysis
- 4.1. Segment Dashboard
- 4.2. U.S. Antibody Drug Conjugates Market: Application Movement Analysis & Market Share, 2024 & 2030
- 4.3. Blood Cancer
- 4.3.1. Blood Cancer Market Revenue Estimates and Forecasts, 2018 - 2030 (USD Million)
- 4.3.2. Leukemia
- 4.3.2.1. Leukemia Market Revenue Estimates and Forecasts, 2018 - 2030 (USD Million)
- 4.3.3. Lymphoma
- 4.3.3.1. Lymphoma Market Revenue Estimates and Forecasts, 2018 - 2030 (USD Million)
- 4.3.4. Multiple Myeloma
- 4.3.4.1. Multiple Myeloma Market Revenue Estimates and Forecasts, 2018 - 2030 (USD Million)
- 4.4. Breast Cancer
- 4.4.1. Breast Cancer Market Revenue Estimates and Forecasts, 2018 - 2030 (USD Million)
- 4.5. Urothelial Cancer & Bladder Cancer
- 4.5.1. Urothelial Cancer & Bladder Cancer Market Revenue Estimates and Forecasts, 2018 - 2030 (USD Million)
- 4.6. Other Cancer
- 4.6.1. Urothelial Cancer & Bladder Cancer Market Revenue Estimates and Forecasts, 2018 - 2030 (USD Million)
Chapter 5. U.S. Antibody Drug Conjugates Market: Product Estimates & Trend Analysis
- 5.1. Segment Dashboard
- 5.2. U.S. Antibody Drug Conjugates Market: Product Movement Analysis & Market Share, 2024 & 2030
- 5.3. Kadcyla
- 5.3.1. Kadcyla Market Revenue Estimates and Forecasts, 2018 - 2030 (USD Million)
- 5.4. Enhertu
- 5.4.1. Enhertu Market Revenue Estimates and Forecasts, 2018 - 2030 (USD Million)
- 5.5. Adcetris
- 5.5.1. Adcetris Market Revenue Estimates and Forecasts, 2018 - 2030 (USD Million)
- 5.6. Padcev
- 5.6.1. Padcev Market Revenue Estimates and Forecasts, 2018 - 2030 (USD Million)
- 5.7. Trodelvy
- 5.7.1. Trodelvy Market Revenue Estimates and Forecasts, 2018 - 2030 (USD Million)
- 5.8. Polivy
- 5.8.1. Polivy Market Revenue Estimates and Forecasts, 2018 - 2030 (USD Million)
- 5.9. Others
- 5.9.1. Others Market Revenue Estimates and Forecasts, 2018 - 2030 (USD Million)
Chapter 6. U.S. Antibody Drug Conjugates Market: Target Estimates & Trend Analysis
- 6.1. Segment Dashboard
- 6.2. U.S. Antibody Drug Conjugates Market: Target Movement Analysis & Market Share, 2024 & 2030
- 6.3. HER2
- 6.3.1. HER2 Market Revenue Estimates and Forecasts, 2018 - 2030 (USD Million)
- 6.4. CD22
- 6.4.1. CD22 Market Revenue Estimates and Forecasts, 2018 - 2030 (USD Million)
- 6.5. CD30
- 6.5.1. CD30 Market Revenue Estimates and Forecasts, 2018 - 2030 (USD Million)
- 6.6. Others
- 6.6.1. Others Market Revenue Estimates and Forecasts, 2018 - 2030 (USD Million)
Chapter 7. U.S. Antibody Drug Conjugates Market: Technology Estimates & Trend Analysis
- 7.1. Segment Dashboard
- 7.2. U.S. Antibody Drug Conjugates Market: Technology Movement Analysis & Market Share, 2024 & 2030
- 7.3. Type
- 7.3.1. Type Market Revenue Estimates and Forecasts, 2018 - 2030 (USD Million)
- 7.3.2. Cleavable Linker
- 7.3.2.1. Cleavable Linker Market Revenue Estimates and Forecasts, 2018 - 2030 (USD Million)
- 7.3.3. Non-cleavable Linker
- 7.3.3.1. Non-cleavable Linker Market Revenue Estimates and Forecasts, 2018 - 2030 (USD Million)
- 7.3.4. Linkerless
- 7.3.4.1. Linkerless Market Revenue Estimates and Forecasts, 2018 - 2030 (USD Million)
- 7.4. Linker Technology Type
- 7.4.1. Linker Technology Type Market Revenue Estimates and Forecasts, 2018 - 2030 (USD Million)
- 7.4.2. VC
- 7.4.2.1. VC Market Revenue Estimates and Forecasts, 2018 - 2030 (USD Million)
- 7.4.3. Sulfo-SPDB
- 7.4.3.1. Sulfo-SPDB Market Revenue Estimates and Forecasts, 2018 - 2030 (USD Million)
- 7.4.4. VA
- 7.4.4.1. VA Market Revenue Estimates and Forecasts, 2018 - 2030 (USD Million)
- 7.4.5. Hydrazone
- 7.4.5.1. Hydrazone Market Revenue Estimates and Forecasts, 2018 - 2030 (USD Million)
- 7.4.6. Others
- 7.4.6.1. Others Market Revenue Estimates and Forecasts, 2018 - 2030 (USD Million)
- 7.5. Payload Technology
- 7.5.1. Payload Technology Market Revenue Estimates and Forecasts, 2018 - 2030 (USD Million)
- 7.5.2. MMAE
- 7.5.2.1. MMAE Market Revenue Estimates and Forecasts, 2018 - 2030 (USD Million)
- 7.5.3. MMAF
- 7.5.3.1. MMAF Market Revenue Estimates and Forecasts, 2018 - 2030 (USD Million)
- 7.5.4. DM4
- 7.5.4.1. DM4 Market Revenue Estimates and Forecasts, 2018 - 2030 (USD Million)
- 7.5.5. Camptothecin
- 7.5.5.1. Camptothecin Market Revenue Estimates and Forecasts, 2018 - 2030 (USD Million)
- 7.5.6. Others
- 7.5.6.1. Others Market Revenue Estimates and Forecasts, 2018 - 2030 (USD Million)
Chapter 8. U.S. Antibody Drug Conjugates Market - Competitive Landscape
- 8.1. Recent Developments & Impact Analysis, By Key Market Participants
- 8.2. Company Categorization
- 8.3. Company Heat Map
- 8.4. Position Analysis, 2024
- 8.5. Strategy Mapping
- 8.5.1. Expansion
- 8.5.2. Mergers & Acquisition
- 8.5.3. Partnerships & Collaborations
- 8.5.4. New Product Launches
- 8.5.5. Research and Development
- 8.6. Company Profiles
- 8.6.1. Seagen, Inc.
- 8.6.1.1. Participant's overview
- 8.6.1.2. Financial performance
- 8.6.1.3. Product benchmarking
- 8.6.1.4. Recent developments
- 8.6.2. Takeda Pharmaceutical Company Ltd.
- 8.6.2.1. Participant's overview
- 8.6.2.2. Financial performance
- 8.6.2.3. Product benchmarking
- 8.6.2.4. Recent developments
- 8.6.3. AstraZeneca
- 8.6.3.1. Participant's overview
- 8.6.3.2. Financial performance
- 8.6.3.3. Product benchmarking
- 8.6.3.4. Recent developments
- 8.6.4. F. Hoffmann-La Roche Ltd.
- 8.6.4.1. Participant's overview
- 8.6.4.2. Financial performance
- 8.6.4.3. Product benchmarking
- 8.6.4.4. Recent developments
- 8.6.5. Pfizer, Inc.
- 8.6.5.1. Participant's overview
- 8.6.5.2. Financial performance
- 8.6.5.3. Product benchmarking
- 8.6.5.4. Recent developments
- 8.6.6. Gilead Sciences, Inc.
- 8.6.6.1. Participant's overview
- 8.6.6.2. Financial performance
- 8.6.6.3. Product benchmarking
- 8.6.6.4. Recent developments
- 8.6.7. Daiichi Sankyo Company Ltd.
- 8.6.7.1. Participant's overview
- 8.6.7.2. Financial performance
- 8.6.7.3. Product benchmarking
- 8.6.7.4. Recent developments
- 8.6.8. GlaxoSmithKline Plc
- 8.6.8.1. Participant's overview
- 8.6.8.2. Financial performance
- 8.6.8.3. Product benchmarking
- 8.6.8.4. Recent developments
- 8.6.9. Astellas Pharma, Inc.
- 8.6.9.1. Participant's overview
- 8.6.9.2. Financial performance
- 8.6.9.3. Product benchmarking
- 8.6.9.4. Recent developments
- 8.6.10. ADC Therapeutics SA
- 8.6.10.1. Participant's overview
- 8.6.10.2. Financial performance
- 8.6.10.3. Product benchmarking
- 8.6.10.4. Recent developments
- 8.6.1. Seagen, Inc.
