|
|
市場調査レポート
商品コード
1772341
ビールの北米市場規模、シェア、動向分析レポート:製品別、包装別、生産別、流通チャネル別、国別、セグメント別予測、2025年~2030年North America Beer Market Size, Share & Trends Analysis Report By Product (Ale, Lager, Stout, Others), By Packaging, By Production, By Distribution Channel (On-Trade, Off-Trade), By Country, And Segment Forecasts, 2025 - 2030 |
||||||
|
|||||||
カスタマイズ可能
|
|||||||

| ビールの北米市場規模、シェア、動向分析レポート:製品別、包装別、生産別、流通チャネル別、国別、セグメント別予測、2025年~2030年 |
|
出版日: 2025年06月09日
発行: Grand View Research
ページ情報: 英文 120 Pages
納期: 2~10営業日
|

全表示
- 概要
- 図表
- 目次
北米のビール市場規模と動向:
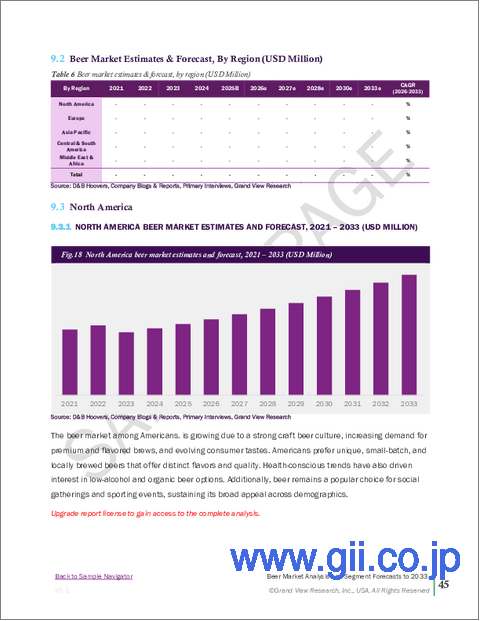
北米のビール市場規模は2024年に1,778億3,000万米ドルと推定され、2025年から2030年にかけてCAGR 6.9%で成長すると予測されます。
この市場は、消費者の嗜好の進化、人口動態の変化、製品提供の革新が相まって成長を遂げています。主な要因のひとつは、クラフトビールやプレミアムビールへの需要の高まりです。消費者、特に若年層は、個性的な風味、地元で醸造された選択肢、より個性的な飲用体験を提供する職人技を駆使した製品を求めています。このため、地ビール醸造所やクラフトビールフェスティバルの人気が急上昇し、地域の需要に拍車をかけています。
健康志向の動向も市場に影響を与えており、低カロリー、低アルコール、ノンアルコールビールへの嗜好が高まっています。こうした選択肢により、消費者は健康目標を損なうことなく、ビール消費の社交的側面を楽しむことができます。さらに、ビールブランドはハードセルツァーやフレーバー麦芽飲料に進出し、以前はスピリッツやワインに傾倒していた人々を含む、より幅広い層の関心を集めています。
若い世代、特にZ世代とミレニアル世代が、このシフトの最前線にいます。Z世代の約65%は2025年に飲酒量を減らす予定で、39%は完全にアルコール抜きのライフスタイルを採用する意向です。この層はまた、ノンアルコールの代替品を探求する傾向が強く、35%がソーシャルメディアを通じて新しい選択肢を発見し、28%がインフルエンサーや有名人が推薦する製品を試しています。
ミレニアル世代とZ世代はアルコール消費者のかなりの割合を占めており、このパターンは予測期間中も続くと予想されます。教育機関であるペンシルベニア州立エクステンションが発表したデータによると、ミレニアル世代とZ世代の飲酒者は、リラックスしたり、話題を集めたり、楽しい時間を過ごすために様々なアルコールを消費しています。さらに同記事によると、2021年5月までの52週間で、ミレニアル世代の90%がアルコールを購入しています。ミレニアル世代は、生ビールを含むアルコール市場全体の成長に影響を与えていると考えられます。
この動向には、健康やウェルネスの目標、経済的な配慮、ライフスタイルの変化への欲求など、いくつかの要因があります。アメリカ人の半数以上は、飲酒量を減らす理由として節約を挙げており、5人に1人は、アルコールはもはや買えない贅沢品だと考えています。さらに、Z世代の58%は精神的な健康を改善するためにアルコール摂取量を減らすことを目的としており、ベビーブーマー世代の約半数は減量目標が動機となっています。
目次
第1章 調査手法と範囲
第2章 エグゼクティブサマリー
第3章 北米のビール市場の変数、動向、範囲
- 市場系統の見通し
- 世界のビール市場規模と成長率の概要(2018年~2030年)
- 浸透と成長の見込みマッピング
- 業界バリューチェーン分析
- 原材料動向の見通し
- 製造業と技術の動向
- 利益率分析
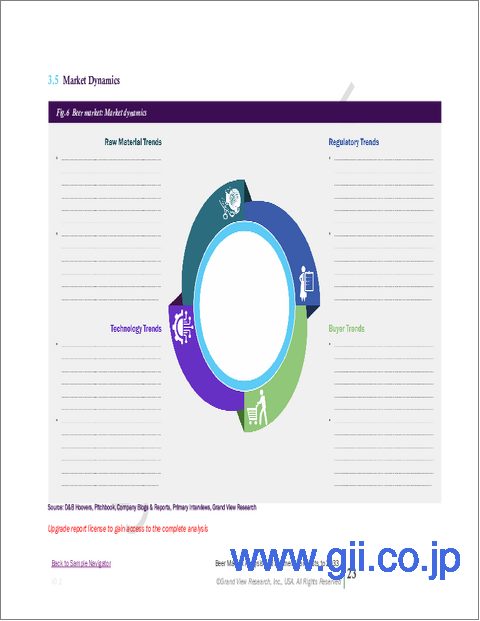
- 市場力学
- 市場促進要因分析
- 市場抑制要因分析
- 市場機会
- 市場の課題
- 業界分析- ポーターのファイブフォース分析
- 市場参入戦略
第4章 北米のビール市場:消費者行動分析
- 人口統計分析
- 消費者の動向と嗜好
- 購買行動に影響を与える要因
- 消費者向けサービス導入動向
- 主な観察と発見
第5章 北米のビール市場:製品別の推定・動向分析
- 北米のビール市場、製品別:主なポイント
- 製品別の変動分析と市場シェア、2024年・2030年
- 製品別、2018年~2030年
- エール
- ラガー
- スタウト
- その他
第6章 北米のビール市場:包装別の推定・動向分析
- 北米のビール市場、包装別:主なポイント
- 包装別の変動分析と市場シェア、2024年・2030年
- 包装別、2018年~2030年
- ボトル
- 缶
- その他
第7章 北米のビール市場:生産別の推定・動向分析
- 北米のビール市場、生産別:主なポイント
- 生産別の変動分析と市場シェア、2024年・2030年
- 生産別、2018年~2030年
- マクロブルワリー
- マイクロブルワリー
- クラフトブルワリー
第8章 北米のビール市場:流通チャネル別の推定・動向分析
- 北米のビール市場、流通チャネル別:主なポイント
- 流通チャネル別の変動分析と市場シェア、2024年・2030年
- 流通チャネル別、2018年~2030年
- オントレード
- オフトレード
第9章 北米のビール市場:国別の推定・動向分析
- 北米のビール市場:国別の展望
- 国別の変動分析と市場シェア、2024年・2030年
- 国別、2018年~2030年
- 米国
- カナダ
- メキシコ
第10章 競合分析
- 主要市場参入企業による最近の動向と影響分析
- 企業分類
- 参入企業の概要
- 財務実績
- 収益
- 売上原価
- 粗利益率(%)
- EBIT/EBITDA
- 地域別収益内訳
- 事業セグメント別収益内訳(年次報告書による)
- Product Portfolios
- 企業市場シェア分析、2024年(%)
- 企業ヒートマップ分析
- 戦略マッピング
- 企業プロファイル
- AB InBev
- Heineken NV
- Carlsberg Breweries A/S
- Molson Coors Beverage Company
- Asahi Group Holdings, Ltd.
- Diageo
- China Resources North America Beer(Holdings)Company Limited
- Boston North America Beer Co.
- Kirin Holdings Company, Limited.
- Beijing Yanjing North America Beer Group Corporation
List of Tables
- Table 1 North America beer market - Key market driver analysis
- Table 2 North America beer market - Key market restraint analysis
- Table 3 North America beer market estimates and forecast, by product (USD Million)
- Table 4 North America beer market estimates and forecast, by packaging (USD Million)
- Table 5 North America beer market estimates and forecast, by production (USD Million)
- Table 6 North America beer market estimates and forecast, by distribution channel (USD Million)
- Table 7 North America beer market revenue estimates and forecast, by country, 2018 - 2030 (USD Million)
- Table 8 U.S. macroeconomic outlook
- Table 9 U.S. beer market estimates and forecast, 2018 - 2030 (USD Million)
- Table 10 U.S. beer market revenue estimates and forecast, by product, 2018 - 2030 (USD Million)
- Table 11 U.S. beer market estimates and forecast, by packaging (USD Million)
- Table 12 U.S. beer market revenue estimates and forecast by production, 2018 - 2030 (USD Million)
- Table 13 U.S. beer market revenue estimates and forecast, by distribution channel, 2018 - 2030 (USD Million)
- Table 14 Canada macro-economic outlay
- Table 15 Canada beer market estimates and forecast, 2018 - 2030 (USD Million)
- Table 16 Canada beer market revenue estimates and forecast, by product, 2018 - 2030 (USD Million)
- Table 17 Canada beer market estimates and forecast, by packaging (USD Million)
- Table 18 Canada beer market revenue estimates and forecast by production, 2018 - 2030 (USD Million)
- Table 19 Canada beer market revenue estimates and forecast, by distribution channel, 2018 - 2030 (USD Million)
- Table 20 Mexico macro-economic outlay
- Table 21 Mexico beer market estimates and forecast, 2018 - 2030 (USD Million)
- Table 22 Mexico beer market revenue estimates and forecast, by product, 2018 - 2030 (USD Million)
- Table 23 Mexico beer market estimates and forecast, by packaging (USD Million)
- Table 24 Mexico beer market revenue estimates and forecast by production, 2018 - 2030 (USD Million)
- Table 25 Mexico beer market revenue estimates and forecast, by distribution channel, 2018 - 2030 (USD Million)
List of Figures
- Fig. 1 North America beer market segmentation
- Fig. 2 Information procurement
- Fig. 3 Primary research pattern
- Fig. 4 Primary research approaches
- Fig. 5 Primary research process
- Fig. 6 Market snapshot
- Fig. 7 Product snapshot
- Fig. 8 Packaging snapshot
- Fig. 9 Production Snapshot
- Fig. 10 Distribution channel snapshot
- Fig. 11 Country snapshot
- Fig. 12 Competitive landscape snapshot
- Fig. 13 North America beer market size, 2018 to 2030 (USD Million)
- Fig. 14 North America beer market: Penetration & growth prospect mapping
- Fig. 15 North America beer market: Value chain analysis
- Fig. 16 North America beer market: Profit margin analysis
- Fig. 17 North America beer market: Market dynamics
- Fig. 18 North America beer market: Porter's five forces analysis
- Fig. 19 Factors influencing buying decisions for beer
- Fig. 20 North America beer market, by product: Key Takeaways
- Fig. 21 North America beer market: Product movement analysis, 2024 & 2030 (%)
- Fig. 22 Ale beer market estimates and forecast, 2018 - 2030 (USD Million)
- Fig. 23 Larger beer market estimates and forecast, 2018 - 2030 (USD Million)
- Fig. 24 Strout beer market estimates and forecast, 2018 - 2030 (USD Million)
- Fig. 25 Other beer market estimates and forecast, 2018 - 2030 (USD Million)
- Fig. 26 North America beer market, by packaging: Key Takeaways
- Fig. 27 North America beer market: Packaging movement analysis, 2024 & 2030 (%)
- Fig. 28 Bottled beer market estimates and forecast, 2018 - 2030 (USD Million)
- Fig. 29 Canned beer market estimates and forecast, 2018 - 2030 (USD Million)
- Fig. 30 Other packaged beer market estimates and forecast, 2018 - 2030 (USD Million)
- Fig. 31 North America beer market, by production: Key Takeaways
- Fig. 32 North America beer market: Production movement analysis, 2024 & 2030 (%)
- Fig. 33 Macro brewery market estimates and forecast, 2018 - 2030 (USD Million)
- Fig. 34 Microbrewery market estimates and forecast, 2018 - 2030 (USD Million)
- Fig. 35 Craft brewery market estimates and forecast, 2018 - 2030 (USD Million)
- Fig. 36 North America beer market, by distribution channel: Key Takeaways
- Fig. 37 North America beer market: Distribution channel movement analysis, 2024 & 2030 (%)
- Fig. 38 North America beer market estimates and forecasts through on-trade, 2018 - 2030 (USD Million)
- Fig. 39 North America beer market estimates and forecasts through off-trade, 2018 - 2030 (USD Million)
- Fig. 40 North America beer market: Country outlook, 2024 & 2030 (USD Million)
- Fig. 41 Country marketplace: Key takeaways
- Fig. 42 U.S. beer market estimates and forecast, 2018 - 2030 (USD Million)
- Fig. 43 Canada beer market estimates and forecast, 2018 - 2030 (USD Million)
- Fig. 44 Mexico beer market estimates and forecast, 2018 - 2030 (USD Million)
- Fig. 45 Company market share analysis, 2024
- Fig. 46 Strategic framework of the beer market
North America Beer Market Size & Trends:
The North America beer market size was estimated at USD 177.83 billion in 2024 and is expected to grow at a CAGR of 6.9% from 2025 to 2030. The market is experiencing growth due to a combination of evolving consumer preferences, demographic shifts, and innovation in product offerings. One of the primary drivers is the increasing demand for craft and premium beers. Consumers, especially younger adults, are seeking unique flavors, locally brewed options, and artisanal products that provide a more personalized drinking experience. This has led to a surge in the popularity of microbreweries and craft beer festivals, which are fueling regional demand.
Health-conscious trends have also influenced the market, with a growing preference for low-calorie, low-alcohol, and non-alcoholic beers. These options allow consumers to enjoy the social aspects of beer consumption without compromising on wellness goals. Moreover, beer brands are expanding into hard seltzers and flavored malt beverages, capturing interest from a broader audience, including those who previously leaned toward spirits or wine.
Younger generations, particularly Gen Z and millennials, are at the forefront of this shift. Approximately 65% of Gen Zers plan to drink less in 2025, and 39% intend to adopt a completely alcohol-free lifestyle for the year. This demographic is also more inclined to explore nonalcoholic alternatives, with 35% discovering new options through social media and 28% trying products endorsed by influencers or celebrities.
Millennials and Gen Z comprise a significant percentage of alcohol consumers, and this pattern is anticipated to continue over the forecast period. According to data published by the Penn State Extension, an educational organization, Millennials and Gen Z drinkers consume various alcohols for relaxing, getting a buzz, and having a good time. Moreover, according to the same article, in the 52 weeks ending in May 2021, 90% of Millennials bought alcohol. Millennials have likely influenced the growth of the overall alcohol market, including draught beer.
Several factors contribute to this trend, including health and wellness goals, financial considerations, and a desire for lifestyle changes. Over half of Americans cite saving money as a reason for drinking less, and one in five view alcohol as a luxury they can no longer afford. Additionally, 58% of Gen Zers aim to reduce alcohol intake to improve mental health, while nearly half of baby boomers are motivated by weight loss goals.
North America Beer Market Report Segmentation
This report forecasts revenue growth at the regional and country level and provides an analysis of the latest industry trends and opportunities in each of the sub-segments from 2018 to 2030. For the purpose of this study, Grand View Research has segmented the North America beer market report on the basis of product, packaging, production, distribution channel, and country:
- Product Outlook (Revenue, USD Million, 2018 - 2030)
- Ale
- Lager
- Stout
- Others
- Packaging Outlook (Revenue, USD Million, 2018 - 2030)
- Bottles
- Cans
- Others
- Production Outlook (Revenue, USD Million, 2018 - 2030)
- Macro Brewery
- Micro Brewery
- Craft Brewery
- Distribution Channel Outlook (Revenue, USD Million, 2018 - 2030)
- On-Trade
- Off-Trade
- Country Outlook (Revenue, USD Million, 2018 - 2030)
- U.S.
- Canada
- Mexico
Table of Contents
Chapter 1. Methodology and Scope
- 1.1. Market Segmentation & Scope
- 1.2. Market Definition
- 1.3. Information Procurement
- 1.3.1. Purchased Database
- 1.3.2. GVR's Internal Database
- 1.3.3. Secondary Sources & Third-Party Perspectives
- 1.3.4. Primary Research
- 1.4. Information Analysis
- 1.4.1. Data Analysis Models
- 1.5. Market Formulation & Data Visualization
- 1.6. Data Validation & Publishing
Chapter 2. Executive Summary
- 2.1. Market Outlook
- 2.2. Product Outlook
- 2.3. Packaging Outlook
- 2.4. Production Outlook
- 2.5. Distribution Channel Outlook
- 2.6. Competitive Landscape Outlook
Chapter 3. North America Beer Market Variables, Trends & Scope
- 3.1. Market Lineage Outlook
- 3.1.1. Global Beer Market Size & Growth Rate Overview, 2018 - 2030 (USD Million)
- 3.2. Penetration & Growth Prospect Mapping
- 3.3. Industry Value Chain Analysis
- 3.3.1. Raw Material Trends Outlooks
- 3.3.2. Manufacturing and Technology Trends
- 3.3.3. Profit Margin Analysis
- 3.4. Market Dynamics
- 3.4.1. Market Driver Analysis
- 3.4.2. Market Restraint Analysis
- 3.4.3. Market Opportunities
- 3.4.4. Market Challenges
- 3.5. Industry Analysis - Porter's Five Forces Analysis
- 3.6. Market Entry Strategies
Chapter 4. North America Beer Market: Consumer Behavior Analysis
- 4.1. Demographic Analysis
- 4.2. Consumer Trends & Preferences
- 4.3. Factors Influencing Buying Behavior
- 4.4. Consumer Service Adoption Trends
- 4.5. Key Observations & Findings
Chapter 5. North America Beer Market: Product Estimates & Trend Analysis
- 5.1. North America Beer Market, by Product: Key Takeaways
- 5.2. Product Movement Analysis & Market Share, 2024 & 2030
- 5.3. Market Estimates & Forecasts, by Product, 2018 - 2030 (USD Million)
- 5.3.1. Ale
- 5.3.1.1. Market estimates and forecast, 2018 - 2030 (USD Million)
- 5.3.2. Lager
- 5.3.2.1. Market estimates and forecast, 2018 - 2030 (USD Million)
- 5.3.3. Strout
- 5.3.3.1. Market estimates and forecast, 2018 - 2030 (USD Million)
- 5.3.4. Others
- 5.3.4.1. Market estimates and forecast, 2018 - 2030 (USD Million)
- 5.3.1. Ale
Chapter 6. North America Beer Market: Packaging Estimates & Trend Analysis
- 6.1. North America Beer Market, by Packaging: Key Takeaways
- 6.2. Packaging Movement Analysis & Market Share, 2024 & 2030
- 6.3. Market Estimates & Forecasts, by Packaging, 2018 - 2030 (USD Million)
- 6.3.1. Bottles
- 6.3.1.1. Market estimates and forecast, 2018 - 2030 (USD Million)
- 6.3.2. Cans
- 6.3.2.1. Market estimates and forecast, 2018 - 2030 (USD Million)
- 6.3.3. Others
- 6.3.3.1. Market estimates and forecast, 2018 - 2030 (USD Million)
- 6.3.1. Bottles
Chapter 7. North America Beer Market: Production Estimates & Trend Analysis
- 7.1. North America Beer Market, by Production: Key Takeaways
- 7.2. Production Movement Analysis & Market Share, 2024 & 2030
- 7.3. Market Estimates & Forecasts, by Production, 2018 - 2030 (USD Million)
- 7.3.1. Macro Brewery
- 7.3.1.1. Market estimates and forecast, 2018 - 2030 (USD Million)
- 7.3.2. Micro Brewery
- 7.3.2.1. Market estimates and forecast, 2018 - 2030 (USD Million)
- 7.3.3. Craft Brewery
- 7.3.3.1. Market estimates and forecast, 2018 - 2030 (USD Million)
- 7.3.1. Macro Brewery
Chapter 8. North America Beer Market: Distribution Channel Estimates & Trend Analysis
- 8.1. North America Beer Market, by Distribution Channel: Key Takeaways
- 8.2. Distribution Channel Movement Analysis & Market Share, 2024 & 2030
- 8.3. Market Estimates & Forecasts, by Distribution Channel, 2018 - 2030 (USD Million)
- 8.3.1. On-Trade
- 8.3.1.1. Market estimates and forecast, 2018 - 2030 (USD Million)
- 8.3.2. Off-Trade
- 8.3.2.1. Market estimates and forecast, 2018 - 2030 (USD Million)
- 8.3.1. On-Trade
Chapter 9. North America Beer Market: Country Estimates & Trend Analysis
- 9.1. North America Beer Market: Country Outlook
- 9.2. Country Movement Analysis & Market Share, 2024 & 2030
- 9.3. Market Estimates & Forecasts, by Country, 2018 - 2030 (USD Million)
- 9.3.1. U.S.
- 9.3.1.1. Key country dynamics
- 9.3.1.2. Market estimates and forecast, 2018 - 2030 (USD Million)
- 9.3.2. Canada
- 9.3.2.1. Key country dynamics
- 9.3.2.2. Market estimates and forecast, 2018 - 2030 (USD Million)
- 9.3.3. Mexico
- 9.3.3.1. Key country dynamics
- 9.3.3.2. Market estimates and forecast, 2018 - 2030 (USD Million)
- 9.3.1. U.S.
Chapter 10. Competitive Analysis
- 10.1. Recent Developments & Impact Analysis by Key Market Participants
- 10.2. Company Categorization
- 10.3. Participant's Overview
- 10.4. Financial Performance
- 10.4.1. Revenue
- 10.4.2. COGS
- 10.4.3. Gross Profit Margin (%)
- 10.4.4. EBIT/EBITDA
- 10.4.5. Regional Revenue Breakdown
- 10.4.6. Business Segment Revenue Breakdown (as per annual report)
- 10.5. Product Portfolios
- 10.6. Company Market Share Analysis, 2024 (%)
- 10.7. Company Heat Map Analysis
- 10.8. Strategy Mapping
- 10.9. Company Profiles
- 10.9.1. AB InBev
- 10.9.1.1. Company Overview
- 10.9.1.2. Financial Performance
- 10.9.1.3. Product Portfolios
- 10.9.1.4. Strategic Initiatives
- 10.9.2. Heineken N.V.
- 10.9.2.1. Company Overview
- 10.9.2.2. Financial Performance
- 10.9.2.3. Product Portfolios
- 10.9.2.4. Strategic Initiatives
- 10.9.3. Carlsberg Breweries A/S
- 10.9.3.1. Company Overview
- 10.9.3.2. Financial Performance
- 10.9.3.3. Product Portfolios
- 10.9.3.4. Strategic Initiatives
- 10.9.4. Molson Coors Beverage Company
- 10.9.4.1. Company Overview
- 10.9.4.2. Financial Performance
- 10.9.4.3. Product Portfolios
- 10.9.4.4. Strategic Initiatives
- 10.9.5. Asahi Group Holdings, Ltd.
- 10.9.5.1. Company Overview
- 10.9.5.2. Financial Performance
- 10.9.5.3. Product Portfolios
- 10.9.5.4. Strategic Initiatives
- 10.9.6. Diageo
- 10.9.6.1. Company Overview
- 10.9.6.2. Financial Performance
- 10.9.6.3. Product Portfolios
- 10.9.6.4. Strategic Initiatives
- 10.9.7. China Resources North America Beer (Holdings) Company Limited
- 10.9.7.1. Company Overview
- 10.9.7.2. Financial Performance
- 10.9.7.3. Product Portfolios
- 10.9.7.4. Strategic Initiatives
- 10.9.8. Boston North America Beer Co.
- 10.9.8.1. Company Overview
- 10.9.8.2. Financial Performance
- 10.9.8.3. Product Portfolios
- 10.9.8.4. Strategic Initiatives
- 10.9.9. Kirin Holdings Company, Limited.
- 10.9.9.1. Company Overview
- 10.9.9.2. Financial Performance
- 10.9.9.3. Product Portfolios
- 10.9.9.4. Strategic Initiatives
- 10.9.10. Beijing Yanjing North America Beer Group Corporation
- 10.9.10.1. Company Overview
- 10.9.10.2. Financial Performance
- 10.9.10.3. Product Portfolios
- 10.9.10.4. Strategic Initiatives
- 10.9.1. AB InBev
