|
|
市場調査レポート
商品コード
1771533
地球観測の世界市場:市場規模・シェア・動向分析 (プラットフォーム別・軌道の種類別・技術別・用途別・地域別)、セグメント別予測 (2025年~2030年)Earth Observation Market Size, Share & Trends Analysis Report By Platform, By Orbit Type (Low Earth Orbit, Medium Earth Orbit, Geostationary Orbit), By Technology, By Application, By Region, And Segment Forecasts, 2025 - 2030 |
||||||
|
|||||||
カスタマイズ可能
|
|||||||


| 地球観測の世界市場:市場規模・シェア・動向分析 (プラットフォーム別・軌道の種類別・技術別・用途別・地域別)、セグメント別予測 (2025年~2030年) |
|
出版日: 2025年06月04日
発行: Grand View Research
ページ情報: 英文 140 Pages
納期: 2~10営業日
|

全表示
- 概要
- 図表
- 目次
地球観測市場のサマリー
世界の地球観測の市場規模は、2024年に51億180万米ドルと評価され、2025年から2030年にかけてCAGR 6.2%で成長し、2030年には72億3,840万米ドルに達すると予測されています。市場成長の主因は、衛星画像やリモートセンシング技術の利用拡大など様々な要因です。
気候変動に対する懸念の高まりは、森林減少、氷解、大気の状態を正確に監視する必要性を増幅させ、地球観測産業に依存しています。スマートシティやインフラ・プロジェクトの拡大により、衛星データの計画・運用ワークフローへの統合が加速しています。宇宙の商業化の進展と打ち上げコストの低下により、衛星データへのアクセスが容易になり、市場の拡大に大きく寄与しています。
リアルタイムの地理空間データに対する需要の増加は、地球観測産業の成長に大きく影響しています。政府、防衛機関、商業部門は、環境変化、都市開発、インフラ計画を監視するため、衛星ベースの地球観測により依存しています。高解像度の画像や地理空間情報をリアルタイムで収集できるため、利害関係者は災害管理のために十分な情報に基づいた意思決定を行うことができます。このような実用的なインテリジェンスに対するニーズの高まりが、地球観測技術への投資に拍車をかけています。
AIと機械学習の進歩も地球観測産業を前進させています。これらの技術の統合により、より効率的なデータ処理、パターン認識、予測分析が可能になります。衛星データは、より迅速かつ正確に意味のある洞察に変換され、作物の健康モニタリングや気候変動モデリングアプリケーションを可能にしています。データ解釈を自動化することで運用コストが削減され、利用可能な範囲が広がるため、地球観測ソリューションはより幅広いユーザーにとって実行可能なものとなります。
さらに、宇宙の商業化と衛星打ち上げコストの削減は、地球観測産業を再構築しています。小型衛星コンステレーションと再使用可能なロケットの出現により、新規参入者の参入障壁は劇的に低下しました。非公開会社が独自の地球観測衛星を打ち上げ、データの利用可能性を拡大し、精密農業、環境モニタリング、スマート都市計画などの分野で新たなサービスを提供するケースが増えています。この動向は今後も市場の成長を加速させると予想されます。
さらに、環境問題への関心の高まりと世界の気候変動への取り組みが、地球観測技術に貴重な機会をもたらしています。政府や国際機関は、温室効果ガス排出量の追跡、森林減少の監視、天然資源の管理に衛星データを活用しています。持続可能性の目標を達成することが重視され、環境保護やコンプライアンス追跡を支援する地球観測プログラムへの投資が促されています。このような世界の気候変動への耐性の推進は、今後数年間も市場拡大の主要な原動力になると予想されます。
目次
第1章 分析方法・範囲
第2章 エグゼクティブサマリー
第3章 地球観測市場:変動要因・傾向・範囲
- 市場連関の見通し
- 親市場の見通し
- 関連/付随市場の見通し
- 市場力学
- 市場促進要因の分析
- 市場抑制要因の分析
- 業界の課題
- 地球観測市場:分析ツール
- 業界分析:ポーターのファイブフォース分析
- PESTEL分析
第4章 地球観測市場:プラットフォーム別の推定・動向分析
- セグメントダッシュボード
- 地球観測市場:変動分析、プラットフォーム別(2024年・2030年)
- 衛星ベースEO
- UAV/ドローンベースEO
- 地上ベースEO
- 航空機搭載EO
第5章 地球観測市場:軌道の種類別の推定・動向分析
- セグメントダッシュボード
- 地球観測市場:変動分析、軌道の種類別(2024年・2030年)
- 低軌道(LEO)
- 中軌道(MEO)
- 静止軌道(GEO)
第6章 地球観測市場:技術別の推定・動向分析
- セグメントダッシュボード
- 地球観測市場:変動分析、技術別(2024年・2030年)
- 光学イメージング
- レーダー画像(合成開口レーダー)
- 熱画像
- LiDAR技術
第7章 地球観測市場:用途別の推定・動向分析
- セグメントダッシュボード
- 地球観測市場:変動分析、用途別(2024年・2030年)
- 環境モニタリング
- 災害管理
- 農林
- 都市計画・インフラ
- 海上監視
- エネルギー・電力部門
- 気候変動研究
第8章 地域別の推定・動向分析
- 地球観測市場:地域別(2024年・2030年)
- 北米
- 北米の地球観測市場の推定と予測(2018年~2030年)
- 米国
- カナダ
- メキシコ
- 欧州
- 欧州の地球観測市場の推計・予測(2018年~2030年)
- 英国
- ドイツ
- フランス
- アジア太平洋
- アジア太平洋の地球観測市場の推定・予測(2018年~2030年)
- 中国
- 日本
- インド
- 韓国
- オーストラリア
- ラテンアメリカ
- ラテンアメリカの地球観測市場の推定・予測(2018年~2030年)
- ブラジル
- 中東・アフリカ
- 中東・アフリカの地球観測市場の推定・予測(2018年~2030年)
- アラブ首長国連邦
- サウジアラビア
- 南アフリカ
第9章 競合情勢
- 企業分類
- 企業の市場ポジショニング
- 企業ヒートマップ分析
- 企業プロファイル/上場企業
- AIRBUS
- Maxar Technologies
- Planet Labs PBC.
- Lockheed Martin Corporation.
- L3Harris Technologies, Inc.
- Northrop Grumman.
- ICEYE
- Thales
- SARsat Arabia
- ImageSat International NV
List of Tables
- Table 1 Earth Observation Market Size Estimates & Forecasts 2018 - 2030 (USD Million)
- Table 2 Earth Observation Market, By Platform 2018 - 2030 (USD Million)
- Table 3 Earth Observation Market, By Orbit Type 2018 - 2030 (USD Million)
- Table 4 Earth Observation Market, By Technology 2018 - 2030 (USD Million)
- Table 5 Earth Observation Market, By Application 2018 - 2030 (USD Million)
- Table 6 Satellite-Based EO Market Estimates & Forecasts, 2018 - 2030 (USD Million)
- Table 7 UAV/Drone-Based EO Market Estimates & Forecasts, 2018 - 2030 (USD Million)
- Table 8 Ground-Based EO Market Estimates & Forecasts, 2018 - 2030 (USD Million)
- Table 9 Airborne EO Market Estimates & Forecasts, 2018 - 2030 (USD Million)
- Table 10 Low Earth Orbit (LEO) Market Estimates & Forecasts, 2018 - 2030 (USD Million)
- Table 11 Medium Earth Orbit (MEO) Market Estimates & Forecasts, 2018 - 2030 (USD Million)
- Table 12 Geostationary Orbit (GEO) Market Estimates & Forecasts, 2018 - 2030 (USD Million)
- Table 13 Optical Imaging Market Estimates & Forecasts, 2018 - 2030 (USD Million)
- Table 14 Radar Imaging (Synthetic Aperture Radar) Market Estimates & Forecasts, 2018 - 2030 (USD Million)
- Table 15 Thermal Imaging Market Estimates & Forecasts, 2018 - 2030 (USD Million)
- Table 16 LiDAR Technology Market Estimates & Forecasts, 2018 - 2030 (USD Million)
- Table 17 Environmental Monitoring Market Estimates & Forecasts, 2018 - 2030 (USD Million)
- Table 18 Disaster Management Market Estimates & Forecasts, 2018 - 2030 (USD Million)
- Table 19 Agriculture and Forestry Market Estimates & Forecasts, 2018 - 2030 (USD Million)
- Table 20 Urban Planning and Infrastructure Market Estimates & Forecasts, 2018 - 2030 (USD Million)
- Table 21 Maritime Surveillance Market Estimates & Forecasts, 2018 - 2030 (USD Million)
- Table 22 Energy and Power Sector Market Estimates & Forecasts, 2018 - 2030 (USD Million)
- Table 23 Climate Change Research Market Estimates & Forecasts, 2018 - 2030 (USD Million)
- Table 24 North America Earth Observation Market, By Platform 2018 - 2030 (USD Million)
- Table 25 North America Earth Observation Market, By Orbit Type 2018 - 2030 (USD Million)
- Table 26 North America Earth Observation Market, By Technology 2018 - 2030 (USD Million)
- Table 27 North America Earth Observation Market, By Application 2018 - 2030 (USD Million)
- Table 28 U.S. Earth Observation Market, By Platform 2018 - 2030 (USD Million)
- Table 29 U.S. Earth Observation Market, By Orbit Type 2018 - 2030 (USD Million)
- Table 30 U.S. Earth Observation Market, By Technology 2018 - 2030 (USD Million)
- Table 31 U.S. Earth Observation Market, By Application 2018 - 2030 (USD Million)
- Table 32 Canada Earth Observation Market, By Platform 2018 - 2030 (USD Million)
- Table 33 Canada Earth Observation Market, By Orbit Type 2018 - 2030 (USD Million)
- Table 34 Canada Earth Observation Market, By Technology 2018 - 2030 (USD Million)
- Table 35 Canada Earth Observation Market, By Application 2018 - 2030 (USD Million)
- Table 36 Mexico Earth Observation Market, By Platform 2018 - 2030 (USD Million)
- Table 37 Mexico Earth Observation Market, By Orbit Type 2018 - 2030 (USD Million)
- Table 38 Mexico Earth Observation Market, By Technology 2018 - 2030 (USD Million)
- Table 39 Mexico Earth Observation Market, By Application 2018 - 2030 (USD Million)
- Table 40 Europe Earth Observation Market, By Platform 2018 - 2030 (USD Million)
- Table 41 Europe Earth Observation Market, By Orbit Type 2018 - 2030 (USD Million)
- Table 42 Europe Earth Observation Market, By Technology 2018 - 2030 (USD Million)
- Table 43 Europe Earth Observation Market, By Application 2018 - 2030 (USD Million)
- Table 44 UK Earth Observation Market, By Platform 2018 - 2030 (USD Million)
- Table 45 UK Earth Observation Market, By Orbit Type 2018 - 2030 (USD Million)
- Table 46 UK Earth Observation Market, By Technology 2018 - 2030 (USD Million)
- Table 47 UK Earth Observation Market, By Application 2018 - 2030 (USD Million)
- Table 48 Germany Earth Observation Market, By Platform 2018 - 2030 (USD Million)
- Table 49 Germany Earth Observation Market, By Orbit Type 2018 - 2030 (USD Million)
- Table 50 Germany Earth Observation Market, By Technology 2018 - 2030 (USD Million)
- Table 51 Germany Earth Observation Market, By Application 2018 - 2030 (USD Million)
- Table 52 France Earth Observation Market, By Platform 2018 - 2030 (USD Million)
- Table 53 France Earth Observation Market, By Orbit Type 2018 - 2030 (USD Million)
- Table 54 France Earth Observation Market, By Technology 2018 - 2030 (USD Million)
- Table 55 France Earth Observation Market, By Application 2018 - 2030 (USD Million)
- Table 56 Asia Pacific Earth Observation Market, By Platform 2018 - 2030 (USD Million)
- Table 57 Asia Pacific Earth Observation Market, By Orbit Type 2018 - 2030 (USD Million)
- Table 58 Asia Pacific Earth Observation Market, By Technology 2018 - 2030 (USD Million)
- Table 59 Asia Pacific Earth Observation Market, By Application 2018 - 2030 (USD Million)
- Table 60 China Earth Observation Market, By Platform 2018 - 2030 (USD Million)
- Table 61 China Earth Observation Market, By Orbit Type 2018 - 2030 (USD Million)
- Table 62 China Earth Observation Market, By Technology 2018 - 2030 (USD Million)
- Table 63 China Earth Observation Market, By Application 2018 - 2030 (USD Million)
- Table 64 Japan Earth Observation Market, By Platform 2018 - 2030 (USD Million)
- Table 65 Japan Earth Observation Market, By Orbit Type 2018 - 2030 (USD Million)
- Table 66 Japan Earth Observation Market, By Technology 2018 - 2030 (USD Million)
- Table 67 Japan Earth Observation Market, By Application 2018 - 2030 (USD Million)
- Table 68 India Earth Observation Market, By Platform 2018 - 2030 (USD Million)
- Table 69 India Earth Observation Market, By Orbit Type 2018 - 2030 (USD Million)
- Table 70 India Earth Observation Market, By Technology 2018 - 2030 (USD Million)
- Table 71 India Earth Observation Market, By Application 2018 - 2030 (USD Million)
- Table 72 South Korea Earth Observation Market, By Platform 2018 - 2030 (USD Million)
- Table 73 South Korea Earth Observation Market, By Orbit Type 2018 - 2030 (USD Million)
- Table 74 South Korea Earth Observation Market, By Technology 2018 - 2030 (USD Million)
- Table 75 South Korea Earth Observation Market, By Application 2018 - 2030 (USD Million)
- Table 76 Australia Earth Observation Market, By Platform 2018 - 2030 (USD Million)
- Table 77 Australia Earth Observation Market, By Orbit Type 2018 - 2030 (USD Million)
- Table 78 Australia Earth Observation Market, By Technology 2018 - 2030 (USD Million)
- Table 79 Australia Earth Observation Market, By Application 2018 - 2030 (USD Million)
- Table 80 Latin America Earth Observation Market, By Platform 2018 - 2030 (USD Million)
- Table 81 Latin America Earth Observation Market, By Orbit Type 2018 - 2030 (USD Million)
- Table 82 Latin America Earth Observation Market, By Technology 2018 - 2030 (USD Million)
- Table 83 Latin America Earth Observation Market, By Application 2018 - 2030 (USD Million)
- Table 84 Brazil Earth Observation Market, By Platform 2018 - 2030 (USD Million)
- Table 85 Brazil Earth Observation Market, By Orbit Type 2018 - 2030 (USD Million)
- Table 86 Brazil Earth Observation Market, By Technology 2018 - 2030 (USD Million)
- Table 87 Brazil Earth Observation Market, By Application 2018 - 2030 (USD Million)
- Table 88 Middle East & Africa Earth Observation Market, By Platform 2018 - 2030 (USD Million)
- Table 89 Middle East & Africa Earth Observation Market, By Orbit Type 2018 - 2030 (USD Million)
- Table 90 Middle East & Africa Earth Observation Market, By Technology 2018 - 2030 (USD Million)
- Table 91 Middle East & Africa Earth Observation Market, By Application 2018 - 2030 (USD Million)
- Table 92 UAE Earth Observation Market, By Platform 2018 - 2030 (USD Million)
- Table 93 UAE Earth Observation Market, By Orbit Type 2018 - 2030 (USD Million)
- Table 94 UAE Earth Observation Market, By Technology 2018 - 2030 (USD Million)
- Table 95 UAE Earth Observation Market, By Application 2018 - 2030 (USD Million)
- Table 96 Saudi Arabia Earth Observation Market, By Platform 2018 - 2030 (USD Million)
- Table 97 Saudi Arabia Earth Observation Market, By Orbit Type 2018 - 2030 (USD Million)
- Table 98 Saudi Arabia Earth Observation Market, By Technology 2018 - 2030 (USD Million)
- Table 99 Saudi Arabia Earth Observation Market, By Application 2018 - 2030 (USD Million)
- Table 100 South Africa Earth Observation Market, By Platform 2018 - 2030 (USD Million)
- Table 101 South Africa Earth Observation Market, By Orbit Type, 2018 - 2030 (USD Million)
- Table 102 South Africa Earth Observation Market, By Technology 2018 - 2030 (USD Million)
- Table 103 South Africa Earth Observation Market, By Application 2018 - 2030 (USD Million)
List of Figures
- Fig. 1 Earth observation market segmentation
- Fig. 2 Information procurement
- Fig. 3 Data analysis models
- Fig. 4 Market formulation and validation
- Fig. 5 Data validating & publishing
- Fig. 6 Earth observation market snapshot
- Fig. 7 Earth observation market segment snapshot
- Fig. 8 Earth observation market competitive landscape snapshot
- Fig. 9 Market research process
- Fig. 10 Market driver relevance analysis (current & future impact)
- Fig. 11 Market restraint relevance analysis (current & future impact)
- Fig. 12 Earth observation market, by platform, key takeaways
- Fig. 13 Earth observation market, by platforms, market share, 2024 & 2030
- Fig. 14 Satellite-based EO market estimates & forecasts, 2018 - 2030 (USD Million)
- Fig. 15 UAV/Drone-based EO market estimates & forecasts, 2018 - 2030 (USD Million)
- Fig. 16 Ground-based EO market estimates & forecasts, 2018 - 2030 (USD Million)
- Fig. 17 Airborne EO market estimates & forecasts, 2018 - 2030 (USD Million)
- Fig. 18 Earth observation market, by orbit type, key takeaways
- Fig. 19 Earth observation market, by orbit type, market share, 2024 & 2030
- Fig. 20 Low Earth orbit (LEO) market estimates & forecasts, 2018 - 2030 (USD Million)
- Fig. 21 Medium Earth orbit (MEO) market estimates & forecasts, 2018 - 2030 (USD Million)
- Fig. 22 Geostationary orbit (GEO) market estimates & forecasts, 2018 - 2030 (USD Million)
- Fig. 23 Earth Observation market, by technology, key takeaways
- Fig. 24 Earth Observation market, by technology, market share, 2024 & 2030
- Fig. 25 Optical imaging market estimates & forecasts, 2018 - 2030 (USD Million)
- Fig. 26 Radar imaging (synthetic aperture radar) market estimates & forecasts, 2018 - 2030 (USD Million)
- Fig. 27 Thermal imaging market estimates & forecasts, 2018 - 2030 (USD Million)
- Fig. 28 LiDAR technology market estimates & forecasts, 2018 - 2030 (USD Million)
- Fig. 29 Earth Observation market, by application, key takeaways
- Fig. 30 Earth Observation market, by application, market share, 2024 & 2030
- Fig. 31 Environmental monitoring market estimates & forecasts, 2018 - 2030 (USD Million)
- Fig. 32 Disaster management market estimates & forecasts, 2018 - 2030 (USD Million)
- Fig. 33 Agriculture and forestry market estimates & forecasts, 2018 - 2030 (USD Million)
- Fig. 34 Urban planning and infrastructure market estimates & forecasts, 2018 - 2030 (USD Million)
- Fig. 35 Maritime surveillance market estimates & forecasts, 2018 - 2030 (USD Million)
- Fig. 36 Energy and power sector market estimates & forecasts, 2018 - 2030 (USD Million)
- Fig. 37 Climate change research market estimates & forecasts, 2018 - 2030 (USD Million)
- Fig. 38 Regional marketplace: key takeaways
- Fig. 39 North America Earth observation market estimates & forecast, 2018 - 2030 (USD Million)
- Fig. 40 U.S. Earth observation market estimates & forecast, 2018 - 2030 (USD Million)
- Fig. 41 Canada Earth observation market estimates & forecast, 2018 - 2030 (USD Million)
- Fig. 42 Mexico Earth observation market estimates & forecast, 2018 - 2030 (USD Million)
- Fig. 43 Europe Earth observation market estimates & forecast, 2018 - 2030 (USD Million)
- Fig. 44 UK Earth observation market estimates & forecast, 2018 - 2030 (USD Million)
- Fig. 45 Germany Earth observation market estimates & forecast, 2018 - 2030 (USD Million)
- Fig. 46 France Earth observation market estimates & forecast, 2018 - 2030 (USD Million)
- Fig. 47 Asia Pacific Earth observation market estimates & forecast, 2018 - 2030 (USD Million)
- Fig. 48 Japan Earth observation market estimates & forecast, 2018 - 2030 (USD Million)
- Fig. 49 China Earth observation market estimates & forecast, 2018 - 2030 (USD Million)
- Fig. 50 South Korea Earth observation market estimates & forecast, 2018 - 2030 (USD Million)
- Fig. 51 India Earth observation market estimates & forecast, 2018 - 2030 (USD Million)
- Fig. 52 Australia Earth observation market estimates & forecast, 2018 - 2030 (USD Million)
- Fig. 53 Latin America Earth observation market estimates & forecast, 2018 - 2030 (USD Million)
- Fig. 54 Brazil Earth observation market estimates & forecast, 2018 - 2030 (USD Million)
- Fig. 55 Middle East & Africa Earth observation market estimates & forecast, 2018 - 2030 (USD Million)
- Fig. 56 UAE Earth observation market estimates & forecast, 2018 - 2030 (USD Million)
- Fig. 57 Saudi Arabia Earth observation market estimates & forecast, 2018 - 2030 (USD Million)
- Fig. 58 South Africa Earth observation market estimates & forecast, 2018 - 2030 (USD Million)
- Fig. 59 Key company categorization
- Fig. 60 Strategy framework
Earth Observation Market Summary
The global earth observation market size was valued at USD 5,101.8 million in 2024 and is projected to reach USD 7,238.4 million by 2030, growing at a CAGR of 6.2% from 2025 to 2030. The market growth is primarily driven by various factors such as the increasing use of satellite imagery and remote sensing technologies.
The rise of climate change concerns has amplified the need to accurately monitor deforestation, ice melt, and atmospheric conditions, relying on the Earth observation industry. The expansion of smart cities and infrastructure projects is accelerating the integration of satellite data into planning and operational workflows. The growing commercialization of space and lower launch costs make satellite data more accessible, significantly contributing to the expansion of the market.
The increasing demand for real-time geospatial data is significantly influencing the growth of the Earth observation industry. Governments, defense agencies, and commercial sectors rely more on satellite-based Earth observation to monitor environmental changes, urban development, and infrastructure planning. The ability to gather high-resolution imagery and geospatial intelligence in real time enables stakeholders to make informed decisions for disaster management. This growing need for actionable intelligence is fueling investments in Earth observation technologies.
AI and machine learning advancements are also propelling the Earth observation industry forward. The integration of these technologies allows for more efficient data processing, pattern recognition, and predictive analytics. Satellite data is being transformed into meaningful insights with greater speed and accuracy, enabling crop health monitoring and climate change modeling applications. Automating data interpretation reduces operational costs and broadens accessibility, making Earth observation solutions viable for a wider range of users.
Furthermore, the commercialization of space and the reduction in satellite launch costs are reshaping the Earth observation industry. The emergence of small satellite constellations and reusable launch vehicles has drastically lowered the entry barrier for new players. Private companies are increasingly launching their own Earth observation satellites, expanding the availability of data and creating new service offerings in areas such as precision agriculture, environmental monitoring, and smart city planning. This trend is expected to continue to accelerate the market's growth.
Moreover, increasing environmental concerns and global climate commitments are presenting valuable opportunities for Earth observation technologies. Governments and international organizations are leveraging satellite data to track greenhouse gas emissions, monitor deforestation, and manage natural resources. The emphasis on achieving sustainability goals is prompting investments in Earth observation programs that support environmental protection and compliance tracking. This global push for climate resilience is anticipated to remain a major driver of market expansion in the coming years.
Global Earth Observation Market Report Segmentation
This report forecasts revenue growth at the global, regional, and country levels and provides an analysis of the latest technological trends in each of the sub-segments from 2018 to 2030. For this study, Grand View Research has segmented the Earth observation market report based on platform, orbit type, technology, application, and region:
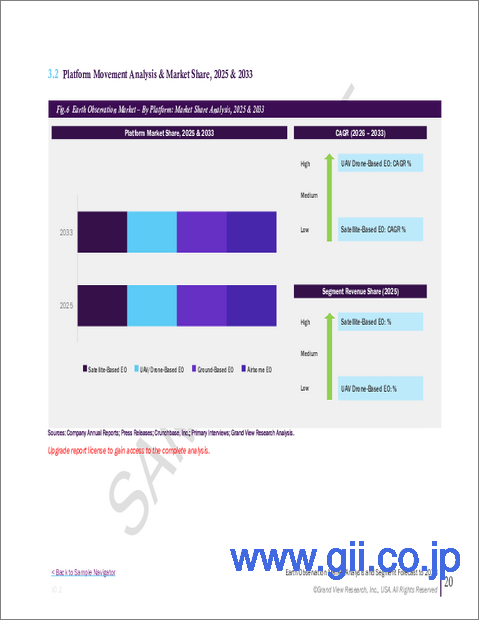
- Platform Outlook (Revenue, USD Million, 2018 - 2030)
- Satellite-Based EO
- UAV/Drone-Based EO
- Ground-Based EO
- Airborne EO
- Orbit Type Outlook (Revenue, USD Million, 2018 - 2030)
- Low Earth Orbit (LEO)
- Medium Earth Orbit (MEO)
- Geostationary Orbit (GEO)
- Technology Outlook (Revenue, USD Million, 2018 - 2030)
- Optical Imaging
- Radar Imaging (Synthetic Aperture Radar)
- Thermal Imaging
- LiDAR Technology
- Application Outlook (Revenue, USD Million, 2018 - 2030)
- Environmental Monitoring
- Disaster Management
- Agriculture and Forestry
- Urban Planning and Infrastructure
- Maritime Surveillance
- Energy and Power Sector
- Climate Change Research
- Regional Outlook (Revenue, USD Million, 2018 - 2030)
- North America
- U.S.
- Canada
- Mexico
- Europe
- UK
- Germany
- France
- Asia Pacific
- China
- Japan
- India
- South Korea
- Australia
- Latin America
- Brazil
- Middle East & Africa
- UAE
- Saudi Arabia
- South Africa
Table of Contents
Chapter 1. Methodology and Scope
- 1.1. Market Segmentation and Scope
- 1.2. Market Definitions
- 1.2.1. Information analysis
- 1.2.2. Market formulation & data visualization
- 1.2.3. Data validation & publishing
- 1.3. Research Scope and Assumptions
- 1.3.1. List of Data Sources
Chapter 2. Executive Summary
- 2.1. Market Outlook
- 2.2. Segment Outlook
- 2.3. Competitive Insights
Chapter 3. Earth Observation Market Variables, Trends, & Scope
- 3.1. Market Lineage Outlook
- 3.2. Market Dynamics
- 3.2.1. Market Driver Analysis
- 3.2.2. Market Restraint Analysis
- 3.2.3. Deployment Challenge
- 3.3. Earth Observation Market Analysis Tools
- 3.3.1. Deployment Analysis - Porter's
- 3.3.1.1. Bargaining power of the suppliers
- 3.3.1.2. Bargaining power of the buyers
- 3.3.1.3. Threats of substitution
- 3.3.1.4. Threats from new entrants
- 3.3.1.5. Competitive rivalry
- 3.3.2. PESTEL Analysis
- 3.3.2.1. Political landscape
- 3.3.2.2. Economic landscape
- 3.3.2.3. Social landscape
- 3.3.2.4. Technological landscape
- 3.3.2.5. Environmental landscape
- 3.3.2.6. Legal landscape
- 3.3.1. Deployment Analysis - Porter's
Chapter 4. Earth Observation Market: Platform Estimates & Trend Analysis
- 4.1. Segment Dashboard
- 4.2. Earth Observation Market: Platform Movement Analysis, 2024 & 2030 (USD Million)
- 4.3. Satellite-Based EO
- 4.3.1. Satellite-Based EO Market Revenue Estimates and Forecasts, 2018 - 2030 (USD Million)
- 4.4. UAV/Drone-Based EO
- 4.4.1. UAV/Drone-Based EO Market Revenue Estimates and Forecasts, 2018 - 2030 (USD Million)
- 4.5. Ground-Based EO
- 4.5.1. Ground-Based EO Market Revenue Estimates and Forecasts, 2018 - 2030 (USD Million)
- 4.6. Airborne EO
- 4.6.1. Airborne EO Market Revenue Estimates and Forecasts, 2018 - 2030 (USD Million)
Chapter 5. Earth Observation Market: Orbit Type Estimates & Trend Analysis
- 5.1. Segment Dashboard
- 5.2. Earth Observation Market: Orbit Type Movement Analysis, 2024 & 2030 (USD Million)
- 5.3. Low Earth Orbit (LEO)
- 5.3.1. Low Earth Orbit (LEO) Market Revenue Estimates and Forecasts, 2018 - 2030 (USD Million)
- 5.4. Medium Earth Orbit (MEO)
- 5.4.1. Medium Earth Orbit (MEO) Market Revenue Estimates and Forecasts, 2018 - 2030 (USD Million)
- 5.5. Geostationary Orbit (GEO)
- 5.5.1. Geostationary Orbit (GEO) Market Revenue Estimates and Forecasts, 2018 - 2030 (USD Million)
Chapter 6. Earth Observation Market: Technology Estimates & Trend Analysis
- 6.1. Segment Dashboard
- 6.2. Earth Observation Market: Technology Movement Analysis, 2024 & 2030 (USD Million)
- 6.3. Optical Imaging
- 6.3.1. Optical Imaging Market Revenue Estimates and Forecasts, 2018 - 2030 (USD Million)
- 6.4. Radar Imaging (Synthetic Aperture Radar)
- 6.4.1. Radar Imaging (Synthetic Aperture Radar) Market Revenue Estimates and Forecasts, 2018 - 2030 (USD Million)
- 6.5. Thermal Imaging
- 6.5.1. Thermal Imaging Market Revenue Estimates and Forecasts, 2018 - 2030 (USD Million)
- 6.6. LiDAR Technology
- 6.6.1. LiDAR Technology Market Revenue Estimates and Forecasts, 2018 - 2030 (USD Million)
Chapter 7. Earth Observation Market: Application Estimates & Trend Analysis
- 7.1. Segment Dashboard
- 7.2. Earth Observation Market: Application Movement Analysis, 2024 & 2030 (USD Million)
- 7.3. Environmental Monitoring
- 7.3.1. Environmental Monitoring Market Revenue Estimates and Forecasts, 2018 - 2030 (USD Million)
- 7.4. Disaster Management
- 7.4.1. Disaster Management Market Revenue Estimates and Forecasts, 2018 - 2030 (USD Million)
- 7.5. Agriculture and Forestry
- 7.5.1. Agriculture and Forestry Market Revenue Estimates and Forecasts, 2018 - 2030 (USD Million)
- 7.6. Urban Planning and Infrastructure
- 7.6.1. Urban Planning and Infrastructure Market Revenue Estimates and Forecasts, 2018 - 2030 (USD Million)
- 7.7. Maritime Surveillance
- 7.7.1. Maritime Surveillance Market Revenue Estimates and Forecasts, 2018 - 2030 (USD Million)
- 7.8. Energy and Power Sector
- 7.8.1. Energy and Power Sector Market Revenue Estimates and Forecasts, 2018 - 2030 (USD Million)
- 7.9. Climate Change Research
- 7.9.1. Climate Change Research Market Revenue Estimates and Forecasts, 2018 - 2030 (USD Million)
Chapter 8. Regional Estimates & Trend Analysis
- 8.1. Earth Observation Market by Region, 2024 & 2030
- 8.2. North America
- 8.2.1. North America Earth Observation Market Estimates & Forecasts, 2018 - 2030, (USD Million)
- 8.2.2. U.S.
- 8.2.2.1. Earth Observation Market Estimates and Forecasts, 2018 - 2030 (USD Million)
- 8.2.3. Canada
- 8.2.3.1. Canada Earth Observation Market Estimates and Forecasts, 2018 - 2030 (USD Million)
- 8.2.4. Mexico
- 8.2.4.1. Mexico Earth Observation Market Estimates and Forecasts, 2018 - 2030 (USD Million)
- 8.3. Europe
- 8.3.1. Europe Earth Observation Market Estimates and Forecasts, 2018 - 2030 (USD Million)
- 8.3.2. UK
- 8.3.2.1. UK Earth Observation Market Estimates and Forecasts, 2018 - 2030 (USD Million)
- 8.3.3. Germany
- 8.3.3.1. Germany Earth Observation Market Estimates and Forecasts, 2018 - 2030 (USD Million)
- 8.3.4. France
- 8.3.4.1. France Earth Observation Market Estimates and Forecasts, 2018 - 2030 (USD Million)
- 8.4. Asia Pacific
- 8.4.1. Asia Pacific Earth Observation Market Estimates and Forecasts, 2018 - 2030 (USD Million)
- 8.4.2. China
- 8.4.2.1. China Earth Observation Market Estimates and Forecasts, 2018 - 2030 (USD Million)
- 8.4.3. Japan
- 8.4.3.1. Japan Earth Observation Market Estimates and Forecasts, 2018 - 2030 (USD Million)
- 8.4.4. India
- 8.4.4.1. India Earth Observation Market Estimates and Forecasts, 2018 - 2030 (USD Million)
- 8.4.5. South Korea
- 8.4.5.1. South Korea Earth Observation Market Estimates and Forecasts, 2018 - 2030 (USD Million)
- 8.4.6. Australia
- 8.4.6.1. Australia Earth Observation Market Estimates and Forecasts, 2018 - 2030 (USD Million)
- 8.5. Latin America
- 8.5.1. Latin America Earth Observation Market Estimates and Forecasts, 2018 - 2030 (USD Million)
- 8.5.2. Brazil
- 8.5.2.1. Brazil Earth Observation Market Estimates and Forecasts, 2018 - 2030 (USD Million)
- 8.6. Middle East and Africa
- 8.6.1. Middle East and Africa Earth Observation Market Estimates and Forecasts, 2018 - 2030 (USD Million)
- 8.6.2. UAE
- 8.6.2.1. UAE Earth Observation Market Estimates and Forecasts, 2018 - 2030 (USD Million)
- 8.6.3. Saudi Arabia
- 8.6.3.1. Saudi Arabia Earth Observation Market Estimates and Forecasts, 2018 - 2030 (USD Million)
- 8.6.4. South Africa
- 8.6.4.1. South Africa Earth Observation Market Estimates and Forecasts, 2018 - 2030 (USD Million)
Chapter 9. Competitive Landscape
- 9.1. Company Categorization
- 9.2. Company Market Positioning
- 9.3. Company Heat Map Analysis
- 9.4. Company Profiles/Listing
- 9.4.1. AIRBUS
- 9.4.1.1. Participant's Overview
- 9.4.1.2. Financial Performance
- 9.4.1.3. Service Benchmarking
- 9.4.1.4. Strategic Initiatives
- 9.4.2. Maxar Technologies
- 9.4.2.1. Participant's Overview
- 9.4.2.2. Financial Performance
- 9.4.2.3. Service Benchmarking
- 9.4.2.4. Strategic Initiatives
- 9.4.3. Planet Labs PBC.
- 9.4.3.1. Participant's Overview
- 9.4.3.2. Financial Performance
- 9.4.3.3. Service Benchmarking
- 9.4.3.4. Strategic Initiatives
- 9.4.4. Lockheed Martin Corporation.
- 9.4.4.1. Participant's Overview
- 9.4.4.2. Financial Performance
- 9.4.4.3. Service Benchmarking
- 9.4.4.4. Strategic Initiatives
- 9.4.5. L3Harris Technologies, Inc.
- 9.4.5.1. Participant's Overview
- 9.4.5.2. Financial Performance
- 9.4.5.3. Service Benchmarking
- 9.4.5.4. Strategic Initiatives
- 9.4.6. Northrop Grumman.
- 9.4.6.1. Participant's Overview
- 9.4.6.2. Financial Performance
- 9.4.6.3. Service Benchmarking
- 9.4.6.4. Strategic Initiatives
- 9.4.7. ICEYE
- 9.4.7.1. Participant's Overview
- 9.4.7.2. Financial Performance
- 9.4.7.3. Service Benchmarking
- 9.4.7.4. Strategic Initiatives
- 9.4.8. Thales
- 9.4.8.1. Participant's Overview
- 9.4.8.2. Financial Performance
- 9.4.8.3. Service Benchmarking
- 9.4.8.4. Strategic Initiatives
- 9.4.9. SARsat Arabia
- 9.4.9.1. Participant's Overview
- 9.4.9.2. Financial Performance
- 9.4.9.3. Service Benchmarking
- 9.4.9.4. Strategic Initiatives
- 9.4.10. ImageSat International NV
- 9.4.10.1. Participant's Overview
- 9.4.10.2. Financial Performance
- 9.4.10.3. Service Benchmarking
- 9.4.10.4. Strategic Initiatives
- 9.4.1. AIRBUS
