|
|
市場調査レポート
商品コード
1750643
産業オートメーションサービスの世界市場規模、シェア、動向分析レポート:サービスタイプ別、製品タイプ別、最終用途別、地域別、セグメント別予測(2025年~2030年)Industrial Automation Services Market Size, Share & Trends Analysis Report By Service Type, By Product Type By End-use, By Region, And Segment Forecasts, 2025 - 2030 |
||||||

|
|||||||
カスタマイズ可能
|
|||||||

| 産業オートメーションサービスの世界市場規模、シェア、動向分析レポート:サービスタイプ別、製品タイプ別、最終用途別、地域別、セグメント別予測(2025年~2030年) |
|
出版日: 2025年05月09日
発行: Grand View Research
ページ情報: 英文 150 Pages
納期: 2~10営業日
|

全表示
- 概要
- 図表
- 目次
産業オートメーションサービス市場の動向:
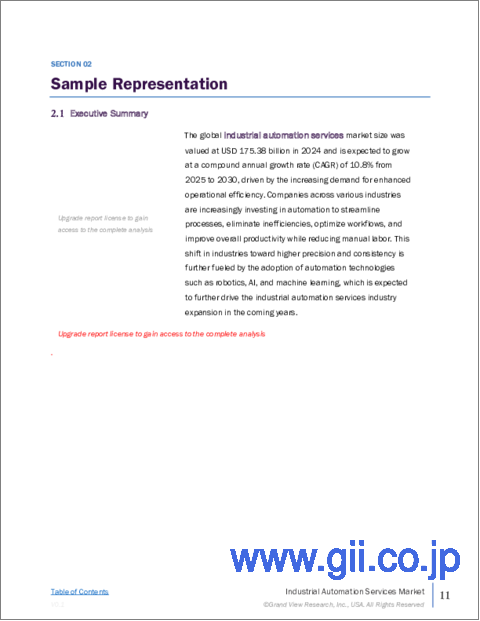
世界の産業オートメーションサービスの市場規模は、2024年に1,753億8,000万米ドルと推定され、2025年~2030年にCAGR10.8%で成長すると予測されています。
成長の主因は、業務効率の向上に対する需要の高まりです。さまざまな業界の企業が、プロセスの合理化、非効率性の排除、ワークフローの最適化、手作業の削減を図りながら全体的な生産性を向上させるために、自動化への投資をますます増やしています。より高い精度と一貫性を求める産業界のこのシフトは、ロボット工学、AI、機械学習などの自動化技術の採用によってさらに促進され、今後数年間で産業オートメーションサービス業界の拡大をさらに促進すると予想されます。
インダストリー4.0へのシフトは、産業オートメーションサービス業界における主要な推進力です。この革命は、ITと運用技術の統合を特徴とし、リアルタイムのモニタリング、意思決定の改善、高効率の生産システムを可能にします。メーカーがスマート・ファクトリー・ソリューションを採用するにつれ、完全に接続されたインテリジェント・システムへの移行を支援するオートメーションサービスへの需要が高まっています。スマート製造に向けたこの動向は、産業オートメーションサービス産業の成長を加速し続けています。
さらに、産業オートメーションシステムへの人工知能(AI)と機械学習の統合が、もう1つの大きな動向として浮上しています。AIは、膨大なデータを分析してインテリジェントな意思決定を自律的に行うことでプロセスの最適化を支援し、機械学習はリアルタイムのフィードバックと過去のデータに基づいて継続的にシステムを改善することを可能にします。これらの技術は、品質管理、予知保全、プロセス最適化などのタスクに応用されています。AIと機械学習が進歩し続けるにつれて、オートメーションへの統合がより大きな影響力を持つようになり、よりスマートで効率的な生産環境が実現され、それによって市場の成長がさらに促進されると予想されます。
予知保全は、産業オートメーションサービス業界の動向として急速に浸透しています。センサーやIoTデバイスを活用することで、企業は機械の健康状態をリアルタイムで監視し、機器のメンテナンスが必要になる時期を予測できるため、計画外のダウンタイムを防ぐことができます。この動向は、高度なデータ分析によって可能になり、潜在的な故障を事前に予測することで、修理費用を節約し、機器の寿命を延ばすことができます。産業界がメンテナンス関連の混乱とコストの削減を目指す中、予知保全はますますオートメーション戦略の重要な要素になりつつあり、産業オートメーションサービス業界の成長に重要な役割を果たしています。
制御システムの仮想化は、産業オートメーションにおける成長動向であり、従来のハードウェアベースの制御システムが、仮想化プラットフォーム上で動作するソフトウェアベースのソリューションに置き換えられています。これにより、産業オートメーションプロセスをより柔軟に、スケーラブルに、コスト効率よく管理できるようになります。仮想化により、製造業者は大規模な物理インフラを必要とせずに、オートメーションプロセスのシミュレーション、監視、制御を一元化された場所から行うことができます。より効率的なリソース管理と、変化する需要への迅速な適応の必要性が高まる中、仮想化は最新の産業オートメーションサービス業界にとって不可欠な要素となっており、今後数年間で、産業オートメーションサービス市場のさらなる活性化が見込まれています。
目次
第1章 調査手法と範囲
第2章 エグゼクティブサマリー
第3章 産業オートメーションサービス市場の変数、動向、範囲
- 市場系統の見通し
- 市場力学
- 市場促進要因分析
- 市場抑制要因分析
- 導入の課題
- 産業オートメーションサービス市場の分析ツール
- 展開分析:ポーターの分析
- PESTEL分析
第4章 産業オートメーションサービス市場:サービスタイプの推定・動向分析
- セグメントダッシュボード
- 産業オートメーションサービス市場:サービスタイプの変動分析、2018年~2030年
- プロジェクトエンジニアリングと設置
- メンテナンスとサポート
- コンサルティングサービス
- 運用サービス
第5章 産業オートメーションサービス市場:製品タイプの推定・動向分析
- セグメントダッシュボード
- 産業オートメーションサービス市場:製品タイプ変動分析、2018年~2030年
- DCS
- PLC
- SCADA
- その他
第6章 産業オートメーションサービス市場:最終用途の推定・動向分析
- セグメントダッシュボード
- 産業オートメーションサービス市場:最終用途の変動分析、2018年~2030年
- 航空宇宙・防衛
- 自動車
- 化学薬品
- エネルギー・公益事業
- 飲食品
- ヘルスケア
- 製造
- 鉱業・金属
- 石油・ガス
- 輸送
- その他
第7章 産業オートメーションサービス市場:地域の推定・動向分析
- 産業オートメーションサービス市場:地域別、2024年・2030年
- 北米
- 米国
- カナダ
- メキシコ
- 欧州
- 英国
- ドイツ
- フランス
- アジア太平洋
- 中国
- 日本
- インド
- 韓国
- オーストラリア
- ラテンアメリカ
- ブラジル
- 中東およびアフリカ
- サウジアラビア
- 南アフリカ
- アラブ首長国連邦
第8章 競合情勢
- 企業分類
- 企業の市場ポジショニング
- 企業ヒートマップ分析
- 企業プロファイル/上場企業
- Siemens AG
- Rockwell Automation, Inc.
- Schneider Electric
- Honeywell International Inc.
- ABB Ltd.
- Mitsubishi Electric Corporation
- Emerson Electric Co.
- Yokogawa Electric Corporation
- Fuji Electric Co., Ltd.
- Omron Corporation
List of Tables
- Table 1 Industrial Automation Services Market Size Estimates & Forecasts, 2018 - 2030 (USD Billion)
- Table 2 Industrial Automation Services Market, By Service Type, 2018 - 2030 (USD Billion)
- Table 3 Industrial Automation Services Market, By Product Type, 2018 - 2030 (USD Billion)
- Table 4 Industrial Automation Services Market, By End Use, 2018 - 2030 (USD Billion)
- Table 5 Project Engineering and Installation Market Estimates & Forecast, 2018 - 2030 (USD Billion)
- Table 6 Maintenance & Support Market Estimates & Forecast, 2018 - 2030 (USD Billion)
- Table 7 Consulting Services Market Estimates & Forecast, 2018 - 2030 (USD Billion)
- Table 8 Operational Services Market Estimates & Forecast, 2018 - 2030 (USD Billion)
- Table 9 DCS Market Estimates & Forecast, 2018 - 2030 (USD Billion)
- Table 10 PLC Market Estimates & Forecast, 2018 - 2030 (USD Billion)
- Table 11 SCADA Market Estimates & Forecast, 2018 - 2030 (USD Billion)
- Table 12 Others Market Estimates & Forecast, 2018 - 2030 (USD Billion)
- Table 13 Aerospace & Defense Market Estimates & Forecast, 2018 - 2030 (USD Billion)
- Table 14 Automotive Market Estimates & Forecast, 2018 - 2030 (USD Billion)
- Table 15 Chemical Market Estimates & Forecast, 2018 - 2030 (USD Billion)
- Table 16 Energy & Utilities Market Estimates & Forecast, 2018 - 2030 (USD Billion)
- Table 17 Food & Beverage Market Estimates & Forecast, 2018 - 2030 (USD Billion)
- Table 18 Healthcare Market Estimates & Forecast, 2018 - 2030 (USD Billion)
- Table 19 Manufacturing Market Estimates & Forecast, 2018 - 2030 (USD Billion)
- Table 20 Mining & Metal Market Estimates & Forecast, 2018 - 2030 (USD Billion)
- Table 21 Oil & Gas Market Estimates & Forecast, 2018 - 2030 (USD Billion)
- Table 22 Transportation Market Estimates & Forecast, 2018 - 2030 (USD Billion)
- Table 23 Others Market Estimates & Forecast, 2018 - 2030 (USD Billion)
- Table 24 North America Industrial Automation Services Market, By Service Type, 2018 - 2030 (USD Billion)
- Table 25 North America Industrial Automation Services Market, By Product Type, 2018 - 2030 (USD Billion)
- Table 26 North America Industrial Automation Services Market, By End Use, 2018 - 2030 (USD Billion)
- Table 27 U.S. Industrial Automation Services Market, By Service Type, 2018 - 2030 (USD Billion)
- Table 28 U.S. Industrial Automation Services Market, By Service Type, 2018 - 2030 (USD Billion)
- Table 29 U.S. Industrial Automation Services Market, By End Use, 2018 - 2030 (USD Billion)
- Table 30 Canada Industrial Automation Services Market, By Service Type, 2018 - 2030 (USD Billion)
- Table 31 Canada Industrial Automation Services Market, By Product Type, 2018 - 2030 (USD Billion)
- Table 32 Canada Industrial Automation Services Market, By End Use, 2018 - 2030 (USD Billion)
- Table 33 Mexico Industrial Automation Services Market, By Service Type, 2018 - 2030 (USD Billion)
- Table 34 Mexico Industrial Automation Services Market, By Product Type, 2018 - 2030 (USD Billion)
- Table 35 Mexico Industrial Automation Services Market, By End Use, 2018 - 2030 (USD Billion)
- Table 36 Europe Industrial Automation Services Market, By Service Type, 2018 - 2030 (USD Billion)
- Table 37 Europe Industrial Automation Services Market, By Product Type, 2018 - 2030 (USD Billion)
- Table 38 Europe Industrial Automation Services Market, By End Use, 2018 - 2030 (USD Billion)
- Table 39 UK Industrial Automation Services Market, By Service Type, 2018 - 2030 (USD Billion)
- Table 40 UK Industrial Automation Services Market, By Product Type, 2018 - 2030 (USD Billion)
- Table 41 UK Industrial Automation Services Market, By End Use, 2018 - 2030 (USD Billion)
- Table 42 Germany Industrial Automation Services Market, By Service Type, 2018 - 2030 (USD Billion)
- Table 43 Germany Industrial Automation Services Market, By Product Type, 2018 - 2030 (USD Billion)
- Table 44 Germany Industrial Automation Services Market, By End Use, 2018 - 2030 (USD Billion)
- Table 45 France Industrial Automation Services Market, By Service Type, 2018 - 2030 (USD Billion)
- Table 46 France Industrial Automation Services Market, By Product Type, 2018 - 2030 (USD Billion)
- Table 47 France Industrial Automation Services Market, By End Use, 2018 - 2030 (USD Billion)
- Table 48 Asia Pacific Industrial Automation Services Market, By Service Type, 2018 - 2030 (USD Billion)
- Table 49 Asia Pacific Industrial Automation Services Market, By Product Type, 2018 - 2030 (USD Billion)
- Table 50 Asia Pacific Industrial Automation Services Market, By End Use, 2018 - 2030 (USD Billion)
- Table 51 China Industrial Automation Services Market, By Service Type, 2018 - 2030 (USD Billion)
- Table 52 China Industrial Automation Services Market, By Product Type, 2018 - 2030 (USD Billion)
- Table 53 China Industrial Automation Services Market, By End Use, 2018 - 2030 (USD Billion)
- Table 54 Japan Industrial Automation Services Market, By Service Type, 2018 - 2030 (USD Billion)
- Table 55 Japan Industrial Automation Services Market, By Product Type, 2018 - 2030 (USD Billion)
- Table 56 Japan Industrial Automation Services Market, By End Use, 2018 - 2030 (USD Billion)
- Table 57 India Industrial Automation Services Market, By Service Type, 2018 - 2030 (USD Billion)
- Table 58 India Industrial Automation Services Market, By Product Type, 2018 - 2030 (USD Billion)
- Table 59 India Industrial Automation Services Market, By End Use, 2018 - 2030 (USD Billion)
- Table 60 South Korea Industrial Automation Services Market, By Service Type, 2018 - 2030 (USD Billion)
- Table 61 South Korea Industrial Automation Services Market, By Product Type, 2018 - 2030 (USD Billion)
- Table 62 South Korea Industrial Automation Services Market, By End Use, 2018 - 2030 (USD Billion)
- Table 63 Australia Industrial Automation Services Market, By Service Type, 2018 - 2030 (USD Billion)
- Table 64 Australia Industrial Automation Services Market, By Product Type, 2018 - 2030 (USD Billion)
- Table 65 Australia Industrial Automation Services Market, By End Use, 2018 - 2030 (USD Billion)
- Table 66 Latin America Industrial Automation Services Market, By Service Type, 2018 - 2030 (USD Billion)
- Table 67 Latin America Industrial Automation Services Market, By Product Type, 2018 - 2030 (USD Billion)
- Table 68 Latin America Industrial Automation Services Market, By End Use, 2018 - 2030 (USD Billion)
- Table 69 Brazil Industrial Automation Services Market, By Service Type, 2018 - 2030 (USD Billion)
- Table 70 Brazil Industrial Automation Services Market, By Product Type, 2018 - 2030 (USD Billion)
- Table 71 Brazil Industrial Automation Services Market, By End Use, 2018 - 2030 (USD Billion)
- Table 72 Middle East & Africa Industrial Automation Services Market, By Service Type, 2018 - 2030 (USD Billion)
- Table 73 Middle East & Africa Industrial Automation Services Market, By Product Type, 2018 - 2030 (USD Billion)
- Table 74 Middle East & Africa Industrial Automation Services Market, By End Use, 2018 - 2030 (USD Billion)
- Table 75 Saudi Arabia Industrial Automation Services Market, By Service Type, 2018 - 2030 (USD Billion)
- Table 76 Saudi Arabia Industrial Automation Services Market, By Product Type, 2018 - 2030 (USD Billion)
- Table 77 Saudi Arabia Industrial Automation Services Market, By End Use, 2018 - 2030 (USD Billion)
- Table 78 UAE Industrial Automation Services Market, By Service Type, 2018 - 2030 (USD Billion)
- Table 79 UAE Industrial Automation Services Market, By Product Type, 2018 - 2030 (USD Billion)
- Table 80 UAE Industrial Automation Services Market, By End Use, 2018 - 2030 (USD Billion)
- Table 81 South Africa Industrial Automation Services Market, By Service Type, 2018 - 2030 (USD Billion)
- Table 82 South Africa Industrial Automation Services Market, By Product Type, 2018 - 2030 (USD Billion)
- Table 83 South Africa Industrial Automation Services Market, By End Use, 2018 - 2030 (USD Billion)
List of Figures
- Fig. 1 Industrial automation services market segmentation
- Fig. 2 Information procurement
- Fig. 3 Data analysis models
- Fig. 4 Market formulation and validation
- Fig. 5 Data validating & publishing
- Fig. 6 Industrial automation services market snapshot
- Fig. 7 Industrial automation services market segment snapshot
- Fig. 8 Industrial automation services market competitive landscape snapshot
- Fig. 9 Market research process
- Fig. 10 Market driver relevance analysis (current & future impact)
- Fig. 11 Market restraint relevance analysis (current & future impact)
- Fig. 12 Industrial automation services market, by service type, key takeaways
- Fig. 13 Industrial automation services market, by service type, market share, 2024 & 2030
- Fig. 14 Project engineering and installation market estimates & forecast, 2018 - 2030 (USD Billion)
- Fig. 15 Maintenance & support market estimates & forecast, 2018 - 2030 (USD Billion)
- Fig. 16 Consulting services market estimates & forecast, 2018 - 2030 (USD Billion)
- Fig. 17 Operational services market estimates & forecast, 2018 - 2030 (USD Billion)
- Fig. 18 Industrial automation services market, by product type, key takeaways
- Fig. 19 Industrial automation services market, by product type, market share, 2024 & 2030
- Fig. 20 DCS market estimates & forecast, 2018 - 2030 (USD Billion)
- Fig. 21 PLC market estimates & forecast, 2018 - 2030 (USD Billion)
- Fig. 22 SCADA market estimates & forecast, 2018 - 2030 (USD Billion)
- Fig. 23 Others market estimates & forecast, 2018 - 2030 (USD Billion)
- Fig. 24 Industrial automation services market, by end use, key takeaways
- Fig. 25 Industrial automation services market, by end use, market share, 2024 & 2030
- Fig. 26 Aerospace & defense market estimates & forecast, 2018 - 2030 (USD Billion)
- Fig. 27 Automotive market estimates & forecast, 2018 - 2030 (USD Billion)
- Fig. 28 Chemical market estimates & forecast, 2018 - 2030 (USD Billion)
- Fig. 29 Energy & utilities market estimates & forecast, 2018 - 2030 (USD Billion)
- Fig. 30 Food & beverage market estimates & forecast, 2018 - 2030 (USD Billion)
- Fig. 31 Healthcare market estimates & forecast, 2018 - 2030 (USD Billion)
- Fig. 32 Manufacturing market estimates & forecast, 2018 - 2030 (USD Billion)
- Fig. 33 Mining & metal market estimates & forecast, 2018 - 2030 (USD Billion)
- Fig. 34 Oil & gas market estimates & forecast, 2018 - 2030 (USD Billion)
- Fig. 35 Transportation market estimates & forecast, 2018 - 2030 (USD Billion)
- Fig. 36 Others market estimates & forecast, 2018 - 2030 (USD Billion)
- Fig. 37 Regional marketplace: key takeaways
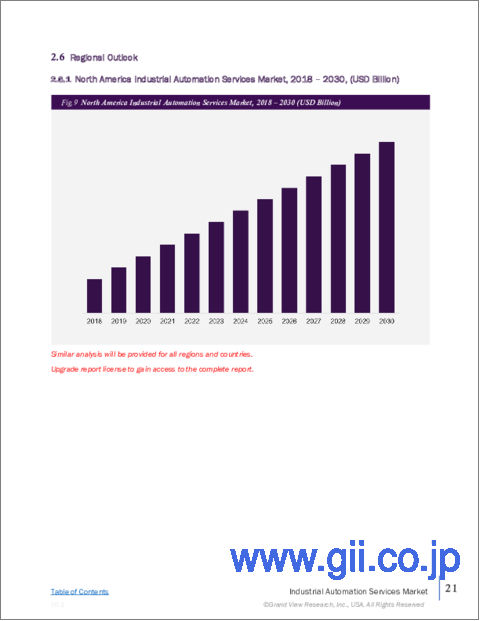
- Fig. 38 North America industrial automation services market estimates & forecast, 2018 - 2030 (USD Billion)
- Fig. 39 U.S. industrial automation services market estimates & forecast, 2018 - 2030 (USD Billion)
- Fig. 40 Canada industrial automation services market estimates & forecast, 2018 - 2030 (USD Billion)
- Fig. 41 Mexico industrial automation services market estimates & forecast, 2018 - 2030 (USD Billion)
- Fig. 42 Europe industrial automation services market estimates & forecast, 2018 - 2030 (USD Billion)
- Fig. 43 UK industrial automation services market estimates & forecast, 2018 - 2030 (USD Billion)
- Fig. 44 Germany industrial automation services market estimates & forecast, 2018 - 2030 (USD Billion)
- Fig. 45 France industrial automation services market estimates & forecast, 2018 - 2030 (USD Billion)
- Fig. 46 Asia Pacific industrial automation services market estimates & forecast, 2018 - 2030 (USD Billion)
- Fig. 47 Japan industrial automation services market estimates & forecast, 2018 - 2030 (USD Billion)
- Fig. 48 China industrial automation services market estimates & forecast, 2018 - 2030 (USD Billion)
- Fig. 49 South Korea industrial automation services market estimates & forecast, 2018 - 2030 (USD Billion)
- Fig. 50 India industrial automation services market estimates & forecast, 2018 - 2030 (USD Billion)
- Fig. 51 Australia industrial automation services market estimates & forecast, 2018 - 2030 (USD Billion)
- Fig. 52 Latin America industrial automation services market estimates & forecast, 2018 - 2030 (USD Billion)
- Fig. 53 Brazil industrial automation services market estimates & forecast, 2018 - 2030 (USD Billion)
- Fig. 54 MEA industrial automation services market estimates & forecast, 2018 - 2030 (USD Billion)
- Fig. 55 Saudi Arabia industrial automation services market estimates & forecast, 2018 - 2030 (USD Billion)
- Fig. 56 South Africa industrial automation services market estimates & forecast, 2018 - 2030 (USD Billion)
- Fig. 57 UAE industrial automation services market estimates & forecast, 2018 - 2030 (USD Billion)
- Fig. 58 Key company categorization
- Fig. 59 Strategy framework
Industrial Automation Services Market Trends:
The global industrial automation services market size was estimated at USD 175.38 billion in 2024 and is expected to grow at a CAGR of 10.8% from 2025 to 2030. The growth is primarily driven by the increasing demand for enhanced operational efficiency. Companies across various industries are increasingly investing in automation to streamline processes, eliminate inefficiencies, optimize workflows, and improve overall productivity while reducing manual labor. This shift in industries toward higher precision and consistency is further fueled by the adoption of automation technologies such as robotics, AI, and machine learning, which is expected to further drive the industrial automation services industry expansion in the coming years.
The shift towards Industry 4.0 is a major driver within the industrial automation services industry. This revolution is characterized by the integration of IT with operational technology, enabling real-time monitoring, improved decision-making, and highly efficient production systems. As manufacturers adopt smart factory solutions, there is a growing demand for automation services to help businesses transition to fully connected and intelligent systems. This trend towards smart manufacturing continues to accelerate the growth of the industrial automation services industry.
Additionally, the integration of Artificial Intelligence (AI) and machine learning into industrial automation systems is emerging as another major trend. AI helps optimize processes by analyzing vast amounts of data to make intelligent decisions autonomously, while machine learning enables systems to improve based on real-time feedback and historical data continuously. These technologies are being applied to tasks such as quality control, predictive maintenance, and process optimization. As AI and machine learning continue to advance, their integration into automation is expected to become more impactful, enabling smarter and more efficient production environments, thereby further driving market growth.
Predictive maintenance is rapidly gaining traction as a trend within the industrial automation services industry. By utilizing sensors and IoT devices, companies can monitor the health of machinery in real-time and predict when equipment will require maintenance, thus preventing unplanned downtime. This trend is enabled by advanced data analytics, which can forecast potential failures before they occur, saving costs on repairs and extending the life of equipment. As industries aim to reduce maintenance-related disruptions and costs, predictive maintenance is increasingly becoming a crucial element of their automation strategies, playing a significant role in the growth of the industrial automation services industry.
Virtualization of control systems is a growing trend in industrial automation, where traditional hardware-based control systems are replaced with software-based solutions running on virtualized platforms. This allows for more flexible, scalable, and cost-effective management of industrial automation processes. Virtualization enables manufacturers to simulate, monitor, and control automation processes from a centralized location, without the need for extensive physical infrastructure. With the growing need for more efficient resource management and quicker adaptation to changing demands, virtualization is becoming an essential element of the modern industrial automation services industry, which is expected to fuel further the industrial automation services market in the coming years.
Global Industrial Automation Services Market Report Segmentation
This report forecasts revenue growth at global, regional, and country levels and provides an analysis of the latest technological trends in each of the sub-segments from 2018 to 2030. For this study, Grand View Research has segmented the global industrial automation services market report based on service type, product type, end-use, and region:
- Service Type Outlook (Revenue, USD Billion, 2018 - 2030)
- Project Engineering and Installation
- Maintenance & Support
- Consulting Services
- Operational Services
- Product Type Outlook (Revenue, USD Billion, 2018 - 2030)
- DCS
- PLC
- SCADA
- Others
- End-use Outlook (Revenue, USD Billion, 2018 - 2030)
- Aerospace & Defense
- Automotive
- Chemical
- Energy & Utilities
- Food & Beverage
- Healthcare
- Manufacturing
- Mining & Metal
- Oil & Gas
- Transportation
- Others
- Regional Outlook (Revenue, USD Billion, 2018 - 2030)
- North America
- U.S.
- Canada
- Mexico
- Europe
- UK
- Germany
- France
- Asia Pacific
- China
- Japan
- India
- South Korea
- Australia
- Latin America
- Brazil
- Middle East & Africa
- Saudi Arabia
- South Africa
- UAE
Table of Contents
Chapter 1. Methodology and Scope
- 1.1. Market Segmentation and Scope
- 1.2. Market Definitions
- 1.2.1. Information analysis
- 1.2.2. Market formulation & data visualization
- 1.2.3. Data validation & publishing
- 1.3. Research Scope and Assumptions
- 1.3.1. List of Data Sources
Chapter 2. Executive Summary
- 2.1. Market Outlook
- 2.2. Segment Outlook
- 2.3. Competitive Insights
Chapter 3. Industrial Automation Services Market Variables, Trends, & Scope
- 3.1. Market Lineage Outlook
- 3.2. Market Dynamics
- 3.2.1. Market Driver Analysis
- 3.2.2. Market Restraint Analysis
- 3.2.3. Deployment Challenge
- 3.3. Industrial Automation Services Market Analysis Tools
- 3.3.1. Deployment Analysis - Porter's
- 3.3.1.1. Bargaining power of the suppliers
- 3.3.1.2. Bargaining power of the buyers
- 3.3.1.3. Threats of substitution
- 3.3.1.4. Threats from new entrants
- 3.3.1.5. Competitive rivalry
- 3.3.2. PESTEL Analysis
- 3.3.2.1. Political landscape
- 3.3.2.2. Economic landscape
- 3.3.2.3. Social landscape
- 3.3.2.4. Technological landscape
- 3.3.2.5. Environmental landscape
- 3.3.2.6. Legal landscape
- 3.3.1. Deployment Analysis - Porter's
Chapter 4. Industrial Automation Services Market: Service Type Estimates & Trend Analysis
- 4.1. Segment Dashboard
- 4.2. Industrial Automation Services Market: Service Type Movement Analysis, 2018 - 2030 (USD Billion)
- 4.3. Project Engineering and Installation
- 4.3.1. Project Engineering and Installation Market Revenue Estimates and Forecasts, 2018 - 2030 (USD Billion)
- 4.4. Maintenance and Support
- 4.4.1. Maintenance and Support Market Revenue Estimates and Forecasts, 2018 - 2030 (USD Billion)
- 4.5. Consulting Services
- 4.5.1. Consulting Services Market Revenue Estimates and Forecasts, 2018 - 2030 (USD Billion)
- 4.6. Operational Services
- 4.6.1. Operational Services Market Revenue Estimates and Forecasts, 2018 - 2030 (USD Billion)
Chapter 5. Industrial Automation Services Market: Product Type Estimates & Trend Analysis
- 5.1. Segment Dashboard
- 5.2. Industrial Automation Services Market: Product Type Movement Analysis, 2018 - 2030 (USD Billion)
- 5.3. DCS
- 5.3.1. DCS Market Revenue Estimates and Forecasts, 2018 - 2030 (USD Billion)
- 5.4. PLC
- 5.4.1. PLC Market Revenue Estimates and Forecasts, 2018 - 2030 (USD Billion)
- 5.5. SCADA
- 5.5.1. SCADA Market Revenue Estimates and Forecasts, 2018 - 2030 (USD Billion)
- 5.6. Others
- 5.6.1. Others Market Revenue Estimates and Forecasts, 2018 - 2030 (USD Billion)
Chapter 6. Industrial Automation Services Market: End Use Estimates & Trend Analysis
- 6.1. Segment Dashboard
- 6.2. Industrial Automation Services Market: End Use Movement Analysis, 2018 - 2030 (USD Billion)
- 6.3. Aerospace & Defense
- 6.3.1. Aerospace & Defense Market Revenue Estimates and Forecasts, 2018 - 2030 (USD Billion)
- 6.4. Automotive
- 6.4.1. Automotive Market Revenue Estimates and Forecasts, 2018 - 2030 (USD Billion)
- 6.5. Chemical
- 6.5.1. Chemical Market Revenue Estimates and Forecasts, 2018 - 2030 (USD Billion)
- 6.6. Energy & Utilities
- 6.6.1. Energy & Utilities Market Revenue Estimates and Forecasts, 2018 - 2030 (USD Billion)
- 6.7. Food & Beverage
- 6.7.1. Food & Beverage Market Revenue Estimates and Forecasts, 2018 - 2030 (USD Billion)
- 6.8. Healthcare
- 6.8.1. Healthcare Market Revenue Estimates and Forecasts, 2018 - 2030 (USD Billion)
- 6.9. Manufacturing
- 6.9.1. Manufacturing Market Revenue Estimates and Forecasts, 2018 - 2030 (USD Billion)
- 6.10. Mining & Metal
- 6.10.1. Mining & Metal Market Revenue Estimates and Forecasts, 2018 - 2030 (USD Billion)
- 6.11. Oil & Gas
- 6.11.1. Oil & Gas Market Revenue Estimates and Forecasts, 2018 - 2030 (USD Billion)
- 6.12. Transportation
- 6.12.1. Transportation Market Revenue Estimates and Forecasts, 2018 - 2030 (USD Billion)
- 6.13. Others
- 6.13.1. Others Market Revenue Estimates and Forecasts, 2018 - 2030 (USD Billion)
Chapter 7. Industrial Automation Services Market: Regional Estimates & Trend Analysis
- 7.1. Industrial Automation Services Market by Region, 2024 & 2030
- 7.2. North America
- 7.2.1. North America Industrial Automation Services Market Estimates & Forecasts, 2018 - 2030 (USD Billion)
- 7.2.2. U.S.
- 7.2.2.1. Industrial Automation Services Market Estimates and Forecasts, 2018 - 2030 (USD Billion)
- 7.2.3. Canada
- 7.2.3.1. Canada Industrial Automation Services Market Estimates and Forecasts, 2018 - 2030 (USD Billion)
- 7.2.4. Mexico
- 7.2.4.1. Mexico Industrial Automation Services Market Estimates and Forecasts, 2018 - 2030 (USD Billion)
- 7.3. Europe
- 7.3.1. Europe Industrial Automation Services Market Estimates and Forecasts, 2018 - 2030 (USD Billion)
- 7.3.2. UK
- 7.3.2.1. UK Industrial Automation Services Market Estimates and Forecasts, 2018 - 2030 (USD Billion)
- 7.3.3. Germany
- 7.3.3.1. Germany Industrial Automation Services Market Estimates and Forecasts, 2018 - 2030 (USD Billion)
- 7.3.4. France
- 7.3.4.1. France Industrial Automation Services Market Estimates and Forecasts, 2018 - 2030 (USD Billion)
- 7.4. Asia Pacific
- 7.4.1. Asia Pacific Industrial Automation Services Market Estimates and Forecasts, 2018 - 2030 (USD Billion)
- 7.4.2. China
- 7.4.2.1. China Industrial Automation Services Market Estimates and Forecasts, 2018 - 2030 (USD Billion)
- 7.4.3. Japan
- 7.4.3.1. Japan Industrial Automation Services Market Estimates and Forecasts, 2018 - 2030 (USD Billion)
- 7.4.4. India
- 7.4.4.1. India Industrial Automation Services Market Estimates and Forecasts, 2018 - 2030 (USD Billion)
- 7.4.5. South Korea
- 7.4.5.1. South Korea Industrial Automation Services Market Estimates and Forecasts, 2018 - 2030 (USD Billion)
- 7.4.6. Australia
- 7.4.6.1. Australia Industrial Automation Services Market Estimates and Forecasts, 2018 - 2030 (USD Billion)
- 7.5. Latin America
- 7.5.1. Latin America Industrial Automation Services Market Estimates and Forecasts, 2018 - 2030 (USD Billion)
- 7.5.2. Brazil
- 7.5.2.1. Brazil Industrial Automation Services Market Estimates and Forecasts, 2018 - 2030 (USD Billion)
- 7.6. Middle East and Africa
- 7.6.1. Middle East and Africa Industrial Automation Services Market Estimates and Forecasts, 2018 - 2030 (USD Billion)
- 7.6.2. Saudi Arabia
- 7.6.2.1. Saudi Arabia Industrial Automation Services Market Estimates and Forecasts, 2018 - 2030 (USD Billion)
- 7.6.3. South Africa
- 7.6.3.1. South Africa Industrial Automation Services Market Estimates and Forecasts, 2018 - 2030 (USD Billion)
- 7.6.4. UAE
- 7.6.4.1. UAE Industrial Automation Services Market Estimates and Forecasts, 2018 - 2030 (USD Billion)
Chapter 8. Competitive Landscape
- 8.1. Company Categorization
- 8.2. Company Market Positioning
- 8.3. Company Heat Map Analysis
- 8.4. Company Profiles/Listing
- 8.4.1. Siemens AG
- 8.4.1.1. Participant's Overview
- 8.4.1.2. Financial Performance
- 8.4.1.3. Product Benchmarking
- 8.4.1.4. Strategic Initiatives
- 8.4.2. Rockwell Automation, Inc.
- 8.4.2.1. Participant's Overview
- 8.4.2.2. Financial Performance
- 8.4.2.3. Product Benchmarking
- 8.4.2.4. Strategic Initiatives
- 8.4.3. Schneider Electric
- 8.4.3.1. Participant's Overview
- 8.4.3.2. Financial Performance
- 8.4.3.3. Product Benchmarking
- 8.4.3.4. Strategic Initiatives
- 8.4.4. Honeywell International Inc.
- 8.4.4.1. Participant's Overview
- 8.4.4.2. Financial Performance
- 8.4.4.3. Product Benchmarking
- 8.4.4.4. Strategic Initiatives
- 8.4.5. ABB Ltd.
- 8.4.5.1. Participant's Overview
- 8.4.5.2. Financial Performance
- 8.4.5.3. Product Benchmarking
- 8.4.5.4. Strategic Initiatives
- 8.4.6. Mitsubishi Electric Corporation
- 8.4.6.1. Participant's Overview
- 8.4.6.2. Financial Performance
- 8.4.6.3. Product Benchmarking
- 8.4.6.4. Strategic Initiatives
- 8.4.7. Emerson Electric Co.
- 8.4.7.1. Participant's Overview
- 8.4.7.2. Financial Performance
- 8.4.7.3. Product Benchmarking
- 8.4.7.4. Strategic Initiatives
- 8.4.8. Yokogawa Electric Corporation
- 8.4.8.1. Participant's Overview
- 8.4.8.2. Financial Performance
- 8.4.8.3. Product Benchmarking
- 8.4.8.4. Strategic Initiatives
- 8.4.9. Fuji Electric Co., Ltd.
- 8.4.9.1. Participant's Overview
- 8.4.9.2. Financial Performance
- 8.4.9.3. Product Benchmarking
- 8.4.9.4. Strategic Initiatives
- 8.4.10. Omron Corporation
- 8.4.10.1. Participant's Overview
- 8.4.10.2. Financial Performance
- 8.4.10.3. Product Benchmarking
- 8.4.10.4. Strategic Initiatives
- 8.4.1. Siemens AG

