|
|
市場調査レポート
商品コード
1726172
ガスケットとシール材市場の市場規模、シェア、動向分析レポート:材料別、最終用途別、地域別、セグメント予測、2025年~2030年Gasket And Seal Materials Market Size, Share & Trends Analysis Report By Material (Rubber, Metal), By End-use, By Region (North America, Asia Pacific, Europe, Central & South America, Middle East & Africa), And Segment Forecasts, 2025 - 2030 |
||||||
|
|||||||
カスタマイズ可能
|
|||||||

| ガスケットとシール材市場の市場規模、シェア、動向分析レポート:材料別、最終用途別、地域別、セグメント予測、2025年~2030年 |
|
出版日: 2025年04月08日
発行: Grand View Research
ページ情報: 英文 101 Pages
納期: 2~10営業日
|

全表示
- 概要
- 図表
- 目次
ガスケットとシール材市場の成長と動向
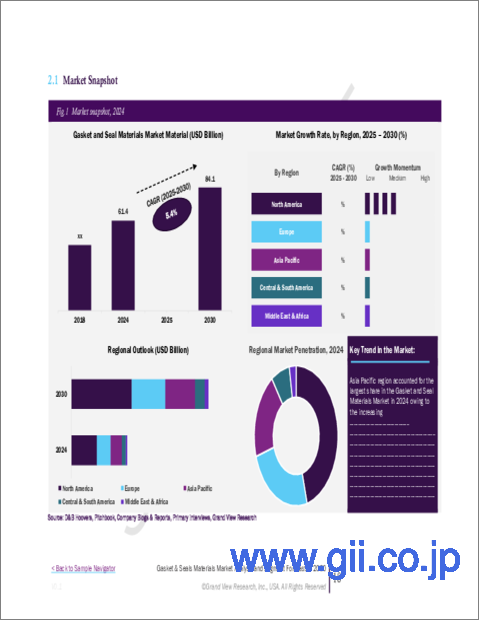
Grand View Research, Inc.の最新レポートによると、世界のガスケットとシール材市場規模は、予測期間中にCAGR 5.4%で成長し、2030年までに841億1,000万米ドルに達すると予測されています。
世界のガスケットとシール材産業の成長は、主に様々な高性能用途における信頼性の高いシーリングソリューションに対する需要の高まりによって牽引されています。自動車、航空宇宙、石油・ガス、製造業などの産業では、高圧、温度変動、化学品への暴露などの極端な使用条件に耐える材料が必要とされています。ガスケットとシールは、漏れを防ぎ、圧力の完全性を維持し、機器の効率を高める上で重要な役割を果たしています。産業オペレーションが複雑化し、安全基準が厳しくなるにつれて、耐久性と性能の一貫性を提供する先進的シール材へのニーズは高まり続けています。
自動車セグメントでは、電気自動車やハイブリッド車への移行とともに、自動車の生産台数が増加していることが市場成長の大きな要因となっています。現代の自動車は、バッテリー、電気モーター、エンジン、トランスミッションシステムなどの部品の完全性を確保するために、高品質のガスケットやシールを必要としています。さらに、燃費を向上させるために自動車の軽量化が推進されているため、強度と軽量化を両立させた革新的なシール材が開発されています。また、世界の排ガス規制が厳しくなる動向も、過酷な使用環境に耐え、よりクリーンで効率的なエンジンに貢献する先進的なガスケットやシール材の使用を後押ししています。
航空宇宙産業もガスケットとシール材産業の成長に大きく貢献しています。このセグメントでは、極端な圧力、温度、化学品への暴露に耐えることができる高度に設計されたシーリングソリューションが求められています。航空機の利用が拡大し、防衛の近代化構想が勢いを増すにつれて、航空機の信頼性と安全性を支える軽量で高性能なシーリング部品への需要が高まっています。さらに、宇宙探査と衛星配備の台頭は、宇宙ミッションの過酷な条件下で効果的に作動できる耐久性のあるガスケットとシール材料の必要性をさらに強めています。
材料科学における技術の進歩は、次世代ガスケットとシール製品の開発を大きく支えてきました。ポリテトラフルオロエチレン(PTFE)、シリコーン、黒鉛、高性能エラストマーなどの材料における革新は、メーカーが特定の産業ニーズに合わせてカスタマイズ型ソリューションを提供することを可能にしています。こうした進歩は、製品の性能と寿命を向上させるだけでなく、持続可能性と規制遵守に関する産業の要件にも合致しています。さらに、主要市場参入企業による継続的な研究開発は、費用対効果が高くエコフレンドリーシーリングソリューションを提供することを目的としており、それによってガスケットとシール材市場の全体的な成長を強化しています。
ガスケットとシール材市場レポートハイライト
- 材料別では、ゴムセグメントが市場をリードし、2024年には40.0%の最大収益シェアを占めました。
- 最終用途別では、自動車セグメントが市場を独占し、2024年に35.7%の最大売上シェアを占めました。
- アジア太平洋が市場を独占し、2024年には約44.8%の最大収益シェアを占めました。これは、急速な工業化、インフラ開拓の進展、自動車と製造部門の拡大に牽引されたものです。
目次
第1章 調査手法と範囲
第2章 エグゼクティブサマリー
第3章 ガスケットとシール材市場の変数、動向、範囲
- 市場の系統/補助市場の展望
- 産業バリューチェーン分析
- 流通チャネル分析
- 規制の枠組み
- アナリストの視点
- 規制と基準
- 市場力学
- 市場促進要因分析
- 市場抑制要因分析
- 産業の機会
- 産業の課題
- ビジネス環境ツール分析:ガスケットとシール材市場
- ポーターのファイブフォース分析
- PESTLE分析
- 市場混乱分析
第4章 ガスケットとシール材市場:材料別、推定・動向分析
- 主要ポイント
- 材料変動分析と市場シェア、2024年と2030年
- 世界のガスケットとシール材市場:材料別、2018~2030年
- ゴム
- ゴム、2018~2030年
- 金属
- 金属、2018~2030年
- PTFE
- PTFE、2018~2030年
- コルク
- コルク、2018~2030年
- その他
- その他、2018~2030年
第5章 ガスケットとシール材市場:最終用途別、推定・動向分析
- 主要ポイント
- 最終用途変動分析と市場シェア、2024年と2030年
- 世界のガスケットとシール材市場:最終用途別、2018~2030年
- 自動車
- 自動車、2018~2030年
- 電気・電子
- 電気・電子、2018~2030年
- 海上・鉄道
- 海上・鉄道、2018~2030年
- 工業・製造
- 工業・製造、2018~2030年
- 航空宇宙
- 航空宇宙、2018~2030年
- 石油・ガス
- 石油・ガス、2018~2030年
- 化学品・石油化学製品
- 化学品・石油化学製品、2018~2030年
- その他
- その他、2018~2030年
第6章 ガスケットとシール材市場:地域別、推定・動向分析
- 主要ポイント
- 地域別市場シェア分析、2024年と2030年
- 北米
- 材料別、2018~2030年
- 用途別、2018~2030年
- 米国
- カナダ
- メキシコ
- 欧州
- 材料別、2018~2030年
- 用途別、2018~2030年
- ドイツ
- 英国
- フランス
- イタリア
- スペイン
- アジア太平洋
- 材料別、2018~2030年
- 用途別、2018~2030年
- 中国
- インド
- 日本
- オーストラリア
- 中南米
- 材料別、2018~2030年
- 用途別、2018~2030年
- 中東・アフリカ
- 材料別、2018~2030年
- 用途別、2018~2030年
第7章 サプライヤー情報
- クラリッチマトリックス
- エンゲージメントモデル
- 交渉戦略
- 調達のベストプラクティス
- ベンダー選定基準
第8章 競合情勢
- 主要参入企業、最近の動向、産業への影響
- 競合の分類
- 企業の市況分析
- 企業ヒートマップ分析
- 戦略マッピング、2024年
- 企業リスト
- Trelleborg Group
- Freudenberg Sealing Technologies
- Parker Hannifin Corporation
- ERIKS NV
- ElringKlinger Kunststofftechnik GmbH
- Saint-Gobain Performance Plastics
- BRUSS Sealing Systems GmbH
- Dimer Group
- John Crane
- Klinger Holding
List of Tables
- Table 1 Gasket & Seal Materials Market Estimates And Forecasts, by Rubber 2018 - 2030 (USD Million)
- Table 2 Gasket & Seal Materials Market Estimates And Forecasts, by Metal, 2018 - 20230 (USD Million)
- Table 3 Gasket & Seal Materials Market Estimates And Forecasts, by PTFE 2018 - 2030 (USD Million)
- Table 4 Gasket & Seal Materials Market Estimates And Forecasts, by Cork, 2018 - 20230 (USD Million)
- Table 5 Gasket & Seal Materials Market Estimates And Forecasts, by Automotive, 2018 - 2030 (USD Million)
- Table 6 Gasket & Seal Materials Market Estimates And Forecasts, by Electrical & Electronics, 2018 - 2030 (USD Million)
- Table 7 Gasket & Seal Materials Market Estimates And Forecasts, by Marine & Rail, 2018 - 2030 (USD Million)
- Table 8 Gasket & Seal Materials Market Estimates And Forecasts, by Industrial & Manufacturing, 2018 - 2030 (USD Million)
- Table 9 Gasket & Seal Materials Market Estimates And Forecasts, by Aerospace, 2018 - 2030 (USD Million)
- Table 10 Gasket & Seal Materials Market Estimates And Forecasts, by Oil & gas, 2018 - 2030 (USD Million)
- Table 11 Gasket & Seal Materials Market Estimates And Forecasts, by Chemicals & Petrochemicals, 2018 - 2030 (USD Million)
- Table 12 Gasket & Seal Materials Market Estimates And Forecasts, by Other End Uses, 2018 - 2030 (USD Million)
- Table 13 North America Gasket & Seal Materials Market Estimates And Forecasts, 2018 - 2030 (USD Million)
- Table 14 North America Gasket & Seal Materials Market Estimates And Forecasts, By Material, 2018 - 2030 (USD Million)
- Table 15 North America Gasket & Seal Materials Market Estimates And Forecasts, By End Use, 2018 - 2030 (USD Million)
- Table 16 U.S. Gasket & Seal Materials Market Estimates And Forecasts, 2018 - 2030 (USD Million)
- Table 17 U.S. Gasket & Seal Materials Market Estimates And Forecasts, By Material, 2018 - 2030 (USD Million)
- Table 18 U.S. Gasket & Seal Materials Market Estimates And Forecasts, By End Use, 2018 - 2030 (USD Million)
- Table 19 Canada Gasket & Seal Materials Market Estimates And Forecasts, 2018 - 2030 (USD Million)
- Table 20 Canada Gasket & Seal Materials Market Estimates And Forecasts, By Material, 2018 - 2030 (USD Million)
- Table 21 Canada Gasket & Seal Materials Market Estimates And Forecasts, By End Use, 2018 - 2030 (USD Million)
- Table 22 Mexico Gasket & Seal Materials Market Estimates And Forecasts, 2018 - 2030 (USD Million)
- Table 23 Mexico Gasket & Seal Materials Market Estimates And Forecasts, By Material, 2018 - 2030 (USD Million)
- Table 24 Mexico Gasket & Seal Materials Market Estimates And Forecasts, By End Use, 2018 - 2030 (USD Million)
- Table 25 Europe Gasket & Seal Materials Market Estimates And Forecasts, 2018 - 2030 (USD Million)
- Table 26 Europe Gasket & Seal Materials Market Estimates And Forecasts, By Material, 2018 - 2030 (USD Million)
- Table 27 Europe Gasket & Seal Materials Market Estimates And Forecasts, By End Use, 2018 - 2030 (USD Million)
- Table 28 Germany Gasket & Seal Materials Market Estimates And Forecasts, 2018 - 2030 (USD Million)
- Table 29 Germany Gasket & Seal Materials Market Estimates And Forecasts, By Material, 2018 - 2030 (USD Million)
- Table 30 Germany Gasket & Seal Materials Market Estimates And Forecasts, By End Use, 2018 - 2030 (USD Million)
- Table 31 UK Gasket & Seal Materials Market Estimates And Forecasts, 2018 - 2030 (USD Million)
- Table 32 UK Gasket & Seal Materials Market Estimates And Forecasts, By Material, 2018 - 2030 (USD Million)
- Table 33 UK Gasket & Seal Materials Market Estimates And Forecasts, By End Use, 2018 - 2030 (USD Million)
- Table 34 France Gasket & Seal Materials Market Estimates And Forecasts, 2018 - 2030 (USD Million)
- Table 35 France Gasket & Seal Materials Market Estimates And Forecasts, By Material, 2018 - 2030 (USD Million)
- Table 36 France Gasket & Seal Materials Market Estimates And Forecasts, By End Use, 2018 - 2030 (USD Million)
- Table 37 Italy Gasket & Seal Materials Market Estimates And Forecasts, 2018 - 2030 (USD Million)
- Table 38 Italy Gasket & Seal Materials Market Estimates And Forecasts, By Material, 2018 - 2030 (USD Million)
- Table 39 Italy Gasket & Seal Materials Market Estimates And Forecasts, By End Use, 2018 - 2030 (USD Million)
- Table 40 Spain Gasket & Seal Materials Market Estimates And Forecasts, 2018 - 2030 (USD Million)
- Table 41 Spain Gasket & Seal Materials Market Estimates And Forecasts, By Material, 2018 - 2030 (USD Million)
- Table 42 Spain Gasket & Seal Materials Market Estimates And Forecasts, By End Use, 2018 - 2030 (USD Million)
- Table 43 Asia Pacific Gasket & Seal Materials Market Estimates And Forecasts, 2018 - 2030 (USD Million)
- Table 44 Asia Pacific Gasket & Seal Materials Market Estimates And Forecasts, By Material, 2018 - 2030 (USD Million)
- Table 45 Asia Pacific Gasket & Seal Materials Market Estimates And Forecasts, By End Use, 2018 - 2030 (USD Million)
- Table 46 China Gasket & Seal Materials Market Estimates And Forecasts, 2018 - 2030 (USD Million)
- Table 47 China Gasket & Seal Materials Market Estimates And Forecasts, By Material, 2018 - 2030 (USD Million)
- Table 48 China Gasket & Seal Materials Market Estimates And Forecasts, By End Use, 2018 - 2030 (USD Million)
- Table 49 India Gasket & Seal Materials Market Estimates And Forecasts, 2018 - 2030 (USD Million)
- Table 50 India Gasket & Seal Materials Market Estimates And Forecasts, By Material, 2018 - 2030 (USD Million)
- Table 51 India Gasket & Seal Materials Market Estimates And Forecasts, By End Use, 2018 - 2030 (USD Million)
- Table 52 Japan Gasket & Seal Materials Market Estimates And Forecasts, 2018 - 2030 (USD Million)
- Table 53 Japan Gasket & Seal Materials Market Estimates And Forecasts, By Material, 2018 - 2030 (USD Million)
- Table 54 Japan Gasket & Seal Materials Market Estimates And Forecasts, By End Use, 2018 - 2030 (USD Million)
- Table 55 Australia Gasket & Seal Materials Market Estimates And Forecasts, 2018 - 2030 (USD Million)
- Table 56 Australia Gasket & Seal Materials Market Estimates And Forecasts, By Material, 2018 - 2030 (USD Million)
- Table 57 Australia Gasket & Seal Materials Market Estimates And Forecasts, By End Use, 2018 - 2030 (USD Million)
- Table 58 Central & South America Gasket & Seal Materials Market Estimates And Forecasts, 2018 - 2030 (USD Million)
- Table 59 Central & South America Gasket & Seal Materials Market Estimates And Forecasts, By Material, 2018 - 2030 (USD Million)
- Table 60 Central & South America Gasket & Seal Materials Market Estimates And Forecasts, By End Use, 2018 - 2030 (USD Million)
- Table 61 Middle East & Africa Gasket & Seal Materials Market Estimates And Forecasts, 2018 - 2030 (USD Million)
- Table 62 Middle East & Africa Gasket & Seal Materials Market Estimates And Forecasts, By Material, 2018 - 2030 (USD Million)
- Table 63 Middle East & Africa Gasket & Seal Materials Market Estimates And Forecasts, By End Use, 2018 - 2030 (USD Million)
List of Figures
- Fig. 1 Information Procurement
- Fig. 2 Primary Research Pattern
- Fig. 3 Primary Research Process
- Fig. 4 Market Research Approaches - Bottom-Up Approach
- Fig. 5 Market Research Approaches - Top-Down Approach
- Fig. 6 Market Research Approaches - Combined Approach
- Fig. 7 Market Snapshot
- Fig. 8 Segmental Outlook
- Fig. 9 Competitive Outlook
- Fig. 10 Gasket & Seal Materials Market - Value Chain Analysis
- Fig. 11 Gasket & Seal Materials Market - Sales Channel Analysis
- Fig. 12 Market Drivers Impact Analysis
- Fig. 13 Market Restraint Impact Analysis
- Fig. 14 Industry Analysis - PORTERS
- Fig. 15 Industry Analysis - PESTEL by SWOT
- Fig. 16 Material: Key Takeaways
- Fig. 17 Material: Market Share, 2024 & 2030
- Fig. 18 End Use: Key Takeaways
- Fig. 19 End Use: Market Share, 2024 & 2030
- Fig. 20 Region, 2024 & 2030, (USD Million)
- Fig. 21 Regional Marketplace: Key Takeaways
- Fig. 22 Kraljic Matrix
- Fig. 23 Engagement Model
- Fig. 24 Sourcing Best Practices
- Fig. 25 Sourcing Best Practices
- Fig. 26 Competition Categorization
- Fig. 27 Company Market Positioning
- Fig. 28 Strategy Mapping, 2024
Gasket And Seal Materials Market Growth & Trends:
The global gasket And seal materials market size is anticipated to reach USD 84.11 billion by 2030, growing at a CAGR of 5.4% during the forecast period, according to a new report by Grand View Research, Inc. Growth of the global gasket and seal materials industry is primarily driven by the increasing demand for reliable sealing solutions across various high-performance applications. Industries such as automotive, aerospace, oil and gas, and manufacturing require materials that can withstand extreme operating conditions, including high pressure, temperature fluctuations, and chemical exposure. Gaskets and seals play a vital role in preventing leakages, maintaining pressure integrity, and enhancing equipment efficiency. As industrial operations become more complex and safety standards grow stricter, the need for advanced sealing materials that offer durability and performance consistency continues to rise.
In the automotive sector, the growing production of vehicles, along with the transition toward electric and hybrid models, is a significant factor contributing to market growth. Modern vehicles require high-quality gaskets and seals to ensure the integrity of components such as batteries, electric motors, engines, and transmission systems. Additionally, the push for lightweight vehicles to improve fuel efficiency has led to the development of innovative sealing materials that combine strength with reduced weight. The trend toward stringent emission regulations globally also encourages the use of advanced gasket and seal materials that can endure harsh operating environments and contribute to cleaner, more efficient engines.
The aerospace industry is another major contributor to the growth of the gasket and seal materials industry. The segment demands highly engineered sealing solutions capable of withstanding extreme pressure, temperature, and chemical exposure. As air travel expands and defense modernization initiatives gain momentum, there is increased demand for lightweight, high-performance sealing components that support aircraft reliability and safety. Moreover, the rise of space exploration and satellite deployment has further intensified the need for durable gasket and seal materials that can operate effectively under the extreme conditions of space missions.
Technological advancements in material science have significantly supported the development of next-generation gasket and seal products. Innovations in materials such as polytetrafluoroethylene (PTFE), silicone, graphite, and high-performance elastomers are enabling manufacturers to offer customized solutions tailored to specific industrial needs. These advancements not only enhance product performance and lifespan but also align with industry requirements for sustainability and regulatory compliance. Furthermore, ongoing research and development efforts by key market players aim to deliver cost-effective and environmentally friendly sealing solutions, thereby strengthening the overall growth of the gasket and seal materials market.
Gasket And Seal Materials Market Report Highlights:
- Based on material, the rubber segment led the market and accounted for the largest revenue share of 40.0% in 2024, driven by its versatile properties and widespread applicability across various end-use industries.
- Based on end use, the automotive segment dominated the market and accounted for the largest revenue share of 35.7% in 2024, driven by the continuous evolution of vehicle technologies and stringent performance standards.
- Asia Pacific dominated the market and accounted for the largest revenue share of about 44.8% in 2024, driven by rapid industrialization, growing infrastructure development, and the expanding automotive and manufacturing sectors.
Table of Contents
Chapter 1. Methodology and Scope
- 1.1. Research Methodology
- 1.2. Research Scope & Assumption
- 1.3. Information Procurement
- 1.3.1. Purchased Database
- 1.3.2. GVR's Internal Database
- 1.3.3. Secondary Sources & Third-Party Perspectives
- 1.3.4. Primary Research
- 1.4. Information Analysis
- 1.4.1. Data Analysis Models
- 1.5. Market Formulation & Data Visualization
- 1.6. List of Data Sources
Chapter 2. Executive Summary
- 2.1. Market Outlook, 2024 (USD Billion)
- 2.2. Segmental Outlook
- 2.3. Competitive Insights
Chapter 3. Gasket & Seal Materials Market Variables, Trends & Scope
- 3.1. Market Lineage/Ancillary Market Outlook
- 3.2. Industry Value Chain Analysis
- 3.2.1. Sales Channel Analysis
- 3.3. Regulatory Framework
- 3.3.1. Analyst Perspective
- 3.3.2. Regulations & Standards
- 3.4. Market Dynamics
- 3.4.1. Market Driver Analysis
- 3.4.2. Market Restraint Analysis
- 3.4.3. Industry Opportunities
- 3.4.4. Industry Challenges
- 3.5. Business Environmental Tools Analysis: Gasket & Seal Materials Market
- 3.5.1. Porter's Five Forces Analysis
- 3.5.1.1. Bargaining Power of Suppliers
- 3.5.1.2. Bargaining Power of Buyers
- 3.5.1.3. Threat of Substitution
- 3.5.1.4. Threat of New Entrants
- 3.5.1.5. Competitive Rivalry
- 3.5.2. PESTLE Analysis
- 3.5.2.1. Political Landscape
- 3.5.2.2. Economic Landscape
- 3.5.2.3. Social Landscape
- 3.5.2.4. Technology Landscape
- 3.5.2.5. Environmental Landscape
- 3.5.2.6. Legal Landscape
- 3.5.1. Porter's Five Forces Analysis
- 3.6. Market Disruption Analysis
Chapter 4. Gasket & Seal Materials Market: Material Estimates & Trend Analysis
- 4.1. Key Takeaways
- 4.2. Material Movement Analysis & Market Share, 2024 & 2030
- 4.3. Global Gasket & Seal Materials Market By Material, 2018 - 2030 (USD Million)
- 4.4. Rubber
- 4.4.1. Gasket & Seal Materials Market Estimates And Forecasts, by Rubber 2018 - 2030 (USD Million)
- 4.5. Metal
- 4.5.1. Gasket & Seal Materials Market Estimates And Forecasts, by Metal, 2018 - 2030 (USD Million)
- 4.6. PTFE
- 4.6.1. Gasket & Seal Materials Market Estimates And Forecasts, by PTFE, 2018 - 2030 (USD Million)
- 4.7. Cork
- 4.7.1. Gasket & Seal Materials Market Estimates And Forecasts, by Cork, 2018 - 2030 (USD Million)
- 4.8. Other Materials
- 4.8.1. Gasket & Seal Materials Market Estimates And Forecasts, by Other Materials, 2018 - 2030 (USD Million)
Chapter 5. Gasket & Seal Materials Market: End Use Estimates & Trend Analysis
- 5.1. Key Takeaways
- 5.2. End Use Movement Analysis & Market Share, 2024 & 2030
- 5.3. Global Gasket & Seal Materials Market By End Use, 2018 - 2030 (USD Million)
- 5.4. Automotive
- 5.4.1. Gasket & Seal Materials Market Estimates And Forecasts, by Automotive, 2018 - 2030 (USD Million)
- 5.5. Electrical & Electronics
- 5.5.1. Gasket & Seal Materials Market Estimates And Forecasts, by Electrical & Electronics, 2018 - 2030 (USD Million)
- 5.6. Marine & Rail
- 5.6.1. Gasket & Seal Materials Market Estimates And Forecasts, by Marine & Rail, 2018 - 2030 (USD Million)
- 5.7. Industrial & Manufacturing
- 5.7.1. Gasket & Seal Materials Market Estimates And Forecasts, by Industrial & Manufacturing, 2018 - 2030 (USD Million)
- 5.8. Aerospace
- 5.8.1. Gasket & Seal Materials Market Estimates And Forecasts, by Aerospace, 2018 - 2030 (USD Million)
- 5.9. Oil & gas
- 5.9.1. Gasket & Seal Materials Market Estimates And Forecasts, by Oil & gas, 2018 - 2030 (USD Million)
- 5.10. Chemicals & Petrochemicals
- 5.10.1. Gasket & Seal Materials Market Estimates And Forecasts, by Chemicals & Petrochemicals, 2018 - 2030 (USD Million)
- 5.11. Other End Uses
- 5.11.1. Gasket & Seal Materials Market Estimates And Forecasts, by Other End Uses, 2018 - 2030 (USD Million)
Chapter 6. Gasket & Seal Materials Market: Regional Estimates & Trend Analysis
- 6.1. Key Takeaways
- 6.2. Regional Market Share Analysis, 2024 & 2030
- 6.3. North America
- 6.3.1. North America Gasket & Seal Materials Market Estimates And Forecasts, 2018 - 2030 (USD Million)
- 6.3.2. North America Gasket & Seal Materials Market Estimates And Forecasts, By Material, 2018 - 2030 (USD Million)
- 6.3.3. North America Gasket & Seal Materials Market Estimates And Forecasts, By End Use, 2018 - 2030 (USD Million)
- 6.3.4. U.S.
- 6.3.4.1. U.S. Gasket & Seal Materials Market Estimates And Forecasts, 2018 - 2030 (USD Million)
- 6.3.4.2. U.S. Gasket & Seal Materials Market Estimates And Forecasts, By Material, 2018 - 2030 (USD Million)
- 6.3.4.3. U.S. Gasket & Seal Materials Market Estimates And Forecasts, By End Use, 2018 - 2030 (USD Million)
- 6.3.5. Canada
- 6.3.5.1. Canada Gasket & Seal Materials Market Estimates And Forecasts, 2018 - 2030 (USD Million)
- 6.3.5.2. Canada Gasket & Seal Materials Market Estimates And Forecasts, By Material, 2018 - 2030 (USD Million)
- 6.3.5.3. Canada Gasket & Seal Materials Market Estimates And Forecasts, By End Use, 2018 - 2030 (USD Million)
- 6.3.6. Mexico
- 6.3.6.1. Mexico Gasket & Seal Materials Market Estimates And Forecasts, 2018 - 2030 (USD Million)
- 6.3.6.2. Mexico Gasket & Seal Materials Market Estimates And Forecasts, By Material, 2018 - 2030 (USD Million)
- 6.3.6.3. Mexico Gasket & Seal Materials Market Estimates And Forecasts, By End Use, 2018 - 2030 (USD Million)
- 6.4. Europe
- 6.4.1. Europe Gasket & Seal Materials Market Estimates And Forecasts, 2018 - 2030 (USD Million)
- 6.4.2. Europe Gasket & Seal Materials Market Estimates And Forecasts, By Material, 2018 - 2030 (USD Million)
- 6.4.3. Europe Gasket & Seal Materials Market Estimates And Forecasts, By End Use, 2018 - 2030 (USD Million)
- 6.4.4. Germany
- 6.4.4.1. Germany Gasket & Seal Materials Market Estimates And Forecasts, 2018 - 2030 (USD Million)
- 6.4.4.2. Germany Gasket & Seal Materials Market Estimates And Forecasts, By Material, 2018 - 2030 (USD Million)
- 6.4.4.3. Germany Gasket & Seal Materials Market Estimates And Forecasts, By End Use, 2018 - 2030 (USD Million)
- 6.4.5. UK
- 6.4.5.1. UK Gasket & Seal Materials Market Estimates And Forecasts, 2018 - 2030 (USD Million)
- 6.4.5.2. UK Gasket & Seal Materials Market Estimates And Forecasts, By Material, 2018 - 2030 (USD Million)
- 6.4.5.3. UK Gasket & Seal Materials Market Estimates And Forecasts, By End Use, 2018 - 2030 (USD Million)
- 6.4.6. France
- 6.4.6.1. France Gasket & Seal Materials Market Estimates And Forecasts, 2018 - 2030 (USD Million)
- 6.4.6.2. France Gasket & Seal Materials Market Estimates And Forecasts, By Material, 2018 - 2030 (USD Million)
- 6.4.6.3. France Gasket & Seal Materials Market Estimates And Forecasts, By End Use, 2018 - 2030 (USD Million)
- 6.4.7. Italy
- 6.4.7.1. Italy Gasket & Seal Materials Market Estimates And Forecasts, 2018 - 2030 (USD Million)
- 6.4.7.2. Italy Gasket & Seal Materials Market Estimates And Forecasts, By Material, 2018 - 2030 (USD Million)
- 6.4.7.3. Italy Gasket & Seal Materials Market Estimates And Forecasts, By End Use, 2018 - 2030 (USD Million)
- 6.4.8. Spain
- 6.4.8.1. Spain Gasket & Seal Materials Market Estimates And Forecasts, 2018 - 2030 (USD Million)
- 6.4.8.2. Spain Gasket & Seal Materials Market Estimates And Forecasts, By Material, 2018 - 2030 (USD Million)
- 6.4.8.3. Spain Gasket & Seal Materials Market Estimates And Forecasts, By End Use, 2018 - 2030 (USD Million)
- 6.5. Asia Pacific
- 6.5.1. Asia Pacific Gasket & Seal Materials Market Estimates And Forecasts, 2018 - 2030 (USD Million)
- 6.5.2. Asia Pacific Gasket & Seal Materials Market Estimates And Forecasts, By Material, 2018 - 2030 (USD Million)
- 6.5.3. Asia Pacific Gasket & Seal Materials Market Estimates And Forecasts, By End Use, 2018 - 2030 (USD Million)
- 6.5.4. China
- 6.5.4.1. China Gasket & Seal Materials Market Estimates And Forecasts, 2018 - 2030 (USD Million)
- 6.5.4.2. China Gasket & Seal Materials Market Estimates And Forecasts, By Material, 2018 - 2030 (USD Million)
- 6.5.4.3. China Gasket & Seal Materials Market Estimates And Forecasts, By End Use, 2018 - 2030 (USD Million)
- 6.5.5. India
- 6.5.5.1. India Gasket & Seal Materials Market Estimates And Forecasts, 2018 - 2030 (USD Million)
- 6.5.5.2. India Gasket & Seal Materials Market Estimates And Forecasts, By Material, 2018 - 2030 (USD Million)
- 6.5.5.3. India Gasket & Seal Materials Market Estimates And Forecasts, By End Use, 2018 - 2030 (USD Million)
- 6.5.6. Japan
- 6.5.6.1. Japan Gasket & Seal Materials Market Estimates And Forecasts, 2018 - 2030 (USD Million)
- 6.5.6.2. Japan Gasket & Seal Materials Market Estimates And Forecasts, By Material, 2018 - 2030 (USD Million)
- 6.5.6.3. Japan Gasket & Seal Materials Market Estimates And Forecasts, By End Use, 2018 - 2030 (USD Million)
- 6.5.7. Australia
- 6.5.7.1. Australia Gasket & Seal Materials Market Estimates And Forecasts, 2018 - 2030 (USD Million)
- 6.5.7.2. Australia Gasket & Seal Materials Market Estimates And Forecasts, By Material, 2018 - 2030 (USD Million)
- 6.5.7.3. Australia Gasket & Seal Materials Market Estimates And Forecasts, By End Use, 2018 - 2030 (USD Million)
- 6.6. Central & South America
- 6.6.1. Central & South America Gasket & Seal Materials Market Estimates And Forecasts, 2018 - 2030 (USD Million)
- 6.6.2. Central & South America Gasket & Seal Materials Market Estimates And Forecasts, By Material, 2018 - 2030 (USD Million)
- 6.6.3. Central & South America Gasket & Seal Materials Market Estimates And Forecasts, By End Use, 2018 - 2030 (USD Million)
- 6.7. Middle East & Africa
- 6.7.1. Middle East & Africa Gasket & Seal Materials Market Estimates And Forecasts, 2018 - 2030 (USD Million)
- 6.7.2. Middle East & Africa Gasket & Seal Materials Market Estimates And Forecasts, By Material, 2018 - 2030 (USD Million)
- 6.7.3. Middle East & Africa Gasket & Seal Materials Market Estimates And Forecasts, By End Use, 2018 - 2030 (USD Million)
Chapter 7. Supplier Intelligence
- 7.1.1. Kraljic Matrix
- 7.1.2. Engagement Model
- 7.1.3. Negotiation Strategies
- 7.1.4. Sourcing Best Practices
- 7.1.5. Vendor Selection Criteria
Chapter 8. Competitive Landscape
- 8.1. Key Players, their Recent Developments, and their Impact on Industry
- 8.2. Competition Categorization
- 8.3. Company Market Position Analysis
- 8.4. Company Heat Map Analysis
- 8.5. Strategy Mapping, 2024
- 8.6. Company Listing
- 8.6.1. Trelleborg Group
- 8.6.1.1. Company Overview
- 8.6.1.2. Financial Performance
- 8.6.1.3. Application Benchmarking
- 8.6.1.4. Strategic Initiatives
- 8.6.2. Freudenberg Sealing Technologies
- 8.6.2.1. Company Overview
- 8.6.2.2. Financial Performance
- 8.6.2.3. Application Benchmarking
- 8.6.2.4. Strategic Initiatives
- 8.6.3. Parker Hannifin Corporation
- 8.6.3.1. Company Overview
- 8.6.3.2. Financial Performance
- 8.6.3.3. Application Benchmarking
- 8.6.3.4. Strategic Initiatives
- 8.6.4. ERIKS NV
- 8.6.4.1. Company Overview
- 8.6.4.2. Financial Performance
- 8.6.4.3. Application Benchmarking
- 8.6.4.4. Strategic Initiatives
- 8.6.5. ElringKlinger Kunststofftechnik GmbH
- 8.6.5.1. Company Overview
- 8.6.5.2. Financial Performance
- 8.6.5.3. Application Benchmarking
- 8.6.5.4. Strategic Initiatives
- 8.6.6. Saint-Gobain Performance Plastics
- 8.6.6.1. Company Overview
- 8.6.6.2. Financial Performance
- 8.6.6.3. Application Benchmarking
- 8.6.6.4. Strategic Initiatives
- 8.6.7. BRUSS Sealing Systems GmbH
- 8.6.7.1. Company Overview
- 8.6.7.2. Financial Performance
- 8.6.7.3. Application Benchmarking
- 8.6.7.4. Strategic Initiatives
- 8.6.8. Dimer Group
- 8.6.8.1. Company Overview
- 8.6.8.2. Financial Performance
- 8.6.8.3. Application Benchmarking
- 8.6.8.4. Strategic Initiatives
- 8.6.9. John Crane
- 8.6.9.1. Company Overview
- 8.6.9.2. Financial Performance
- 8.6.9.3. Application Benchmarking
- 8.6.9.4. Strategic Initiatives
- 8.6.10. Klinger Holding
- 8.6.10.1. Company Overview
- 8.6.10.2. Financial Performance
- 8.6.10.3. Application Benchmarking
- 8.6.10.4. Strategic Initiatives
- 8.6.1. Trelleborg Group
