|
|
市場調査レポート
商品コード
1701585
セラミック基複合材料の市場規模、シェア、動向分析レポート:製品別、用途別、地域別、セグメント予測、2025年~2030年Ceramic Matrix Composites Market Size, Share & Trends Analysis Report By Product, By Application, By Region, And Segment Forecasts, 2025 - 2030 |
||||||
カスタマイズ可能
|
|||||||
| セラミック基複合材料の市場規模、シェア、動向分析レポート:製品別、用途別、地域別、セグメント予測、2025年~2030年 |
|
出版日: 2025年03月13日
発行: Grand View Research
ページ情報: 英文 101 Pages
納期: 2~10営業日
|
全表示
- 概要
- 図表
- 目次
セラミック基複合材料市場の成長と動向:
Grand View Research, Inc.の最新レポートによると、世界のセラミック基複合材料の市場規模は2030年までに158億3,000万米ドルに達し、予測期間中にCAGR 12.5%で成長すると予測されています。
自動車産業における軽量材料の需要拡大は、CMC市場の成長を後押しする重要な役割を果たしています。燃費効率と二酸化炭素排出量削減への注目が高まる中、自動車メーカーはCMCのような軽量材料を自動車部品に組み込む傾向を強めています。CMCはブレーキシステムやエンジン部品などの重要部品に使用され、その強度対重量比が優れた性能を発揮します。燃費に関する規制基準が世界的に厳しくなるにつれて、CMCのような軽量材料の需要が高まり、市場の成長がさらに促進されると予想されます。
防衛技術の進歩も、セラミック基複合材料産業の重要な促進要因です。防衛用途では、高熱や高圧などの過酷な条件に耐える材料が必要とされるため、極超音速車両、ロケット、装甲車などの先進軍事システムの開発でCMCの使用が増加しています。これらの複合材料は、このような要求の厳しい用途に必要な強度、耐熱性、耐久性を提供するため、防衛分野での採用が増加し、CMC市場全体の成長に寄与しています。
宇宙開発産業における高度な熱保護システム(TPS)の需要も、CMC市場の成長を後押ししています。火星や月の有人探査を含む宇宙ミッションへの関心が高まる中、再突入時や着陸時の極度の熱と圧力に耐える材料へのニーズが高まっています。CMCは卓越した耐熱性を持ち、宇宙船のTPS用途に理想的です。宇宙探査の進展に伴い、この分野におけるCMCの需要は大幅に伸び、市場の成長をさらに押し上げると予想されます。
CMCの製造技術の進歩も市場成長に寄与しています。高度な繊維製織技術や樹脂システムの開発、低コスト製造法の導入といったイントロダクションより、CMCは産業用途に利用しやすくなり、コスト効率も向上しています。これらの技術が向上するにつれて、CMCの生産はより効率的になり、自動車、防衛、エレクトロニクスを含む幅広い用途での使用が可能になります。CMC製造プロセスの絶え間ない進化が、多様な産業での採用を後押ししています。
セラミック基複合材料市場レポートハイライト
- 製品別では、カーボン分野が市場をリードし、2024年には49.59%の最大収益シェアを占める。
- 用途別では、航空宇宙分野が市場を独占し、2024年に43.77%の最大収益シェアを占めました。CMCは、従来の金属合金と比較して、耐高温性、強化された靭性、軽量化などの優れた機械的特性を提供します。これらの利点は、民間および軍用の航空宇宙用途において、燃料効率と全体的な性能の向上に寄与しています。
- 北米がセラミック基複合材料業界を支配し、2024年には45.2%の最大の売上シェアを占めました。製造技術の進歩が北米のCMC市場の急成長に寄与しています。
目次
第1章 調査手法と範囲
第2章 エグゼクティブサマリー
第3章 セラミック基複合材料市場の変数、動向、範囲
- 市場系統の見通し
- 業界バリューチェーン分析
- 製造業の動向
- テクノロジーの概要
- 規制の枠組み
- 市場力学
- 市場促進要因分析
- 市場抑制要因分析
- 業界の課題
- ビジネス環境分析:世界の製紙市場
- 業界分析- ポーターのファイブフォース分析
- PESTEL分析、 SWOT分析
- 市場混乱分析
第4章 セラミック基複合材料市場:製品別推定・動向分析
- 重要なポイント
- 市場シェア分析、2022年および2030年
- 酸化物
- 炭化ケイ素
- 炭素
- その他
第5章 セラミック基複合材料市場:用途別推定・動向分析
- 重要なポイント
- 市場シェア分析、2022年および2030年
- 航空宇宙
- 防衛
- エネルギーと電力
- 電気・電子
- 極超音速ミサイル
- その他
第6章 セラミック基複合材料市場:地域別推定・動向分析
- 重要なポイント
- 地域別市場シェア分析、2022年および2030年
- 北米
- 北米のセラミック基複合材料市場推計・予測、2018年~2030年
- 米国
- カナダ
- メキシコ
- 欧州
- 欧州のセラミック基複合材料市場推計・予測、2018年~2030年
- ドイツ
- 英国
- フランス
- スペイン
- イタリア
- アジア太平洋
- アジア太平洋地域のセラミック基複合材料市場推計・予測、2018年~2030年
- 中国
- インド
- 日本
- 韓国
- 中南米
- 中南米のセラミック基複合材料市場推計・予測、2018年~2030年
- ブラジル
- 中東・アフリカ
- 中東およびアフリカのセラミック基複合材料市場推計・予測、2018年~2030年
第7章 セラミック基複合材料市場:競合分析
- 世界の主要プレーヤー、その取り組み、そして市場への影響
- 競合環境
- 企業の市場ポジショニング
- 企業ヒートマップ分析
- 戦略マッピング
- 企業リスト
- 3M Company
- COI Ceramics, Inc.
- CoorsTek, Inc.
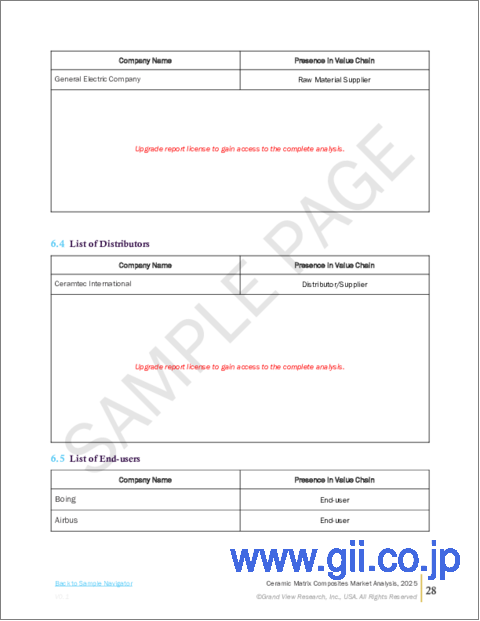
- General Electric Company
- Kyocera Corporation
- Lancer Systems LP
- SGL Carbon Company
- Ultramet, Inc.
- Ube Industries, Ltd.
List of Tables
- Table 1 Ceramic Matrix Composites market estimates and forecasts, by product, 2018 - 2030 (USD Million)
- Table 2 Ceramic Matrix Composites market estimates and forecasts, by product, 2018 - 2030 (Tons)
- Table 3 Ceramic Matrix Composites market estimates and forecasts, by application, 2018 - 2030 (USD Million)
- Table 4 Ceramic Matrix Composites market estimates and forecasts, by application, 2018 - 2030 (Tons)
List of Figures
- Fig. 1 Information Procurement
- Fig. 2 Primary Research Pattern
- Fig. 3 Primary Research Process
- Fig. 4 Market Research Approaches - Bottom Up Approach
- Fig. 5 Market Research Approaches - Top Down Approach
- Fig. 6 Market Research Approaches - Combined Approach
- Fig. 7 Market Outlook
- Fig. 8 Segment Outlook
- Fig. 9 Competitive Insights
- Fig. 10 Market Segmentation
- Fig. 11 Penetration and Growth Prospect Mapping
- Fig. 12 Industry Value Chain Analysis
- Fig. 13 Market Driver Analysis
- Fig. 14 Market Restraint Analysis
- Fig. 18 Competitive Environment
- Fig. 19 Company Market Position Analysis
- Fig. 20 SWOT
- Fig. 21 Product market share analysis, 2022 & 2030
- Fig. 22 Ceramic Matrix Composites market estimates and forecasts, by oxides, 2018 - 2030 (Tons) (USD Million)
- Fig. 23 Ceramic Matrix Composites market estimates and forecasts, by silicon carbide, 2018 - 2030 (Tons) (USD Million)
- Fig. 24 Ceramic Matrix Composites market estimates and forecasts, by carbon, 2018 - 2030 (Tons) (USD Million)
- Fig. 25 Ceramic Matrix Composites market estimates and forecasts, by others, 2018 - 2030 (Tons) (USD Million)
- Fig. 26 Application market share analysis, 2022 & 2030
- Fig. 27 Ceramic Matrix Composites market estimates and forecasts, by aerospace, 2018 - 2030 (Tons) (USD Million)
- Fig. 28 Ceramic Matrix Composites market estimates and forecasts, by defense, 2018 - 2030 (Tons) (USD Million)
- Fig. 29 Ceramic Matrix Composites market estimates and forecasts, by energy & power, 2018 - 2030 (Tons) (USD Million)
- Fig. 30 Ceramic Matrix Composites market estimates and forecasts, by electrical & electronics, 2018 - 2030 (Tons) (USD Million)
- Fig. 31 Ceramic Matrix Composites market estimates and forecasts,by hypersonic missiles, 2018 - 2030 (Tons) (USD Million)
- Fig. 32 Ceramic Matrix Composites market estimates and forecasts, by others, 2018 - 2030 (Tons) (USD Million)
- Fig. 33 North America Ceramic Matrix Composites market estimates and forecasts, 2018 - 2030 (Tons) (USD Million)
- Fig. 34 U.S. Ceramic Matrix Composites market estimates and forecasts, 2018 - 2030 (Tons) (USD Million)
- Fig. 35 Canada Ceramic Matrix Composites market estimates and forecasts, 2018 - 2030 (Tons) (USD Million)
- Fig. 36 Mexico Ceramic Matrix Composites market estimates and forecasts, 2018 - 2030 (Tons) (USD Million)
- Fig. 37 Europe Ceramic Matrix Composites market estimates and forecasts, 2018 - 2030 (Tons) (USD Million)
- Fig. 38 Germany Ceramic Matrix Composites market estimates and forecasts, 2018 - 2030 (Tons) (USD Million)
- Fig. 40 France Ceramic Matrix Composites market estimates and forecasts, 2018 - 2030 (Tons) (USD Million)
- Fig. 41 UK Ceramic Matrix Composites market estimates and forecasts, 2018 - 2030 (Tons) (USD Million)
- Fig. 42 Spain Ceramic Matrix Composites market estimates and forecasts, 2018 - 2030 (Tons) (USD Million)
- Fig. 43 Italy Ceramic Matrix Composites market estimates and forecasts, 2018 - 2030 (Tons) (USD Million)
- Fig. 44 Asia Pacific Ceramic Matrix Composites market estimates and forecasts, 2018 - 2030 (Tons) (USD Million)
- Fig. 45 China Ceramic Matrix Composites market estimates and forecasts, 2018 - 2030 (Tons) (USD Million)
- Fig. 46 India Ceramic Matrix Composites market estimates and forecasts, 2018 - 2030 (Tons) (USD Million)
- Fig. 47 Japan Ceramic Matrix Composites market estimates and forecasts, 2018 - 2030 (Tons) (USD Million)
- Fig. 48 South Korea Ceramic Matrix Composites market estimates and forecasts, 2018 - 2030 (Tons) (USD Million)
- Fig. 49 Central & South America Ceramic Matrix Composites market estimates and forecasts, 2018 - 2030
- Fig. 50 Brazil Ceramic Matrix Composites market estimates and forecasts, 2018 - 2030 (Tons) (USD Million)
- Fig. 51 Middle East & Africa Ceramic Matrix Composites market estimates and forecasts, 2018 - 2030 (Tons) (USD Million)
Ceramic Matrix Composites Market Growth & Trends:
The global ceramic matrix composites market size is anticipated to reach USD 15.83 billion by 2030, growing at a CAGR of 12.5% during the forecast period, according to a new report by Grand View Research, Inc. The expanding demand for lightweight materials in the automotive industry is playing a crucial role in boosting the CMC market growth. With the growing focus on fuel efficiency and reducing carbon emissions, automakers are increasingly incorporating lightweight materials like CMCs into vehicle components. CMCs are used in critical parts such as brake systems and engine components, where their strength-to-weight ratio provides superior performance. As regulatory standards for fuel efficiency become more stringent globally, the demand for lightweight materials like CMCs is expected to rise, further driving market growth.
The advancement of defense technologies is another significant driver for the ceramic matrix composites industry. As defense applications require materials capable of withstanding extreme conditions such as high heat and pressure, CMCs are increasingly being used in the development of advanced military systems, including hypersonic vehicles, rockets, and armored vehicles. These composites provide the necessary strength, thermal resistance, and durability for such demanding applications, resulting in increased adoption within the defense sector and contributing to the overall growth of the CMC market.
The demand for advanced thermal protection systems (TPS) in the space exploration industry is also driving the growth of the CMC market. With the increasing interest in space missions, including human exploration of Mars and the Moon, there is a rising need for materials that can withstand the extreme heat and pressure during re-entry and landing. CMCs offer exceptional heat resistance and are ideal for TPS applications in spacecraft. As space exploration continues to advance, the demand for CMCs in this sector is expected to grow significantly, further boosting the market growth.
The advancements in manufacturing technologies for CMCs are also contributing to market growth. Innovations such as the development of advanced fiber weaving techniques, resin systems, and the introduction of low-cost production methods have made CMCs more accessible and cost-effective for industrial applications. As these technologies improve, the production of CMCs becomes more efficient, enabling their use in a broader range of applications, including automotive, defense, and electronics. The continuous evolution of CMC manufacturing processes is helping to drive their adoption across diverse industries.
Ceramic Matrix Composites Market Report Highlights:
- Based on product, the carbon segment led the market and accounted for the largest revenue share of 49.59% in 2024, driven by increasing demand for lightweight and high-strength materials across various industries.
- Based on application, the aerospace segment dominated the market and accounted for the largest revenue share of 43.77% in 2024. CMCs offer superior mechanical properties, including high-temperature resistance, enhanced toughness, and reduced weight compared to traditional metal alloys. These advantages contribute to improved fuel efficiency and overall performance in both commercial and military aerospace applications.
- North America dominated the ceramic matrix composites industry and accounted for the largest revenue share of 45.2% in 2024. Advancements in manufacturing technologies are contributing to the rapid growth of the CMC market in North America.
Table of Contents
Chapter 1. Methodology and Scope
- 1.1. Market Segmentation and Scope
- 1.2. Research Methodology
- 1.3. Research Scope & Assumption
- 1.4. Information Procurement
- 1.4.1. Purchased Database
- 1.4.2. GVR's Internal Database
- 1.4.3. Secondary Sources & Third-Party Perspectives
- 1.4.4. Primary Research
- 1.5. Information Analysis
- 1.5.1. Data Analysis Models
- 1.6. Market Formulation & Data Visualization
- 1.7. Data Validation & Publishing
Chapter 2. Executive Summary
- 2.1. Market Outlook
- 2.2. Segmental Outlook
- 2.3. Competitive Insights
Chapter 3. Ceramic Matrix Composites Market Variables, Trends & Scope
- 3.1. Market Lineage Outlook
- 3.2. Industry Value Chain Analysis
- 3.2.1. Manufacturing Trends
- 3.3. Technology Overview
- 3.4. Regulatory Framework
- 3.5. Market Dynamics
- 3.5.1. Market Driver Analysis
- 3.5.2. Market Restraint Analysis
- 3.5.3. Industry Challenges
- 3.6. Business Environment Analysis: Global Paper Market
- 3.6.1. Industry Analysis - Porter's
- 3.6.1.1. Supplier Power
- 3.6.1.2. Buyer Power
- 3.6.1.3. Substitution Threat
- 3.6.1.4. Threat from New Entrant
- 3.6.1.5. Competitive Rivalry
- 3.6.2. PESTEL Analysis, By SWOT
- 3.6.2.1. Political Landscape
- 3.6.2.2. Environmental Landscape
- 3.6.2.3. Social Landscape
- 3.6.2.4. Technology Landscape
- 3.6.2.5. Economic Landscape
- 3.6.2.6. Legal Landscape
- 3.6.1. Industry Analysis - Porter's
- 3.7. Market Disruption Analysis
Chapter 4. Ceramic Matrix Composites Market: Product Estimates & Trend Analysis
- 4.1. Key Takeaways
- 4.2. Product Market Share Analysis, 2022 & 2030
- 4.2.1. Oxide
- 4.2.1.1. Ceramic Matrix Composites market estimates and forecasts, by Oxide, 2018 - 2030 (Tons) (USD Million)
- 4.2.2. Silicon Carbide
- 4.2.2.1. Ceramic Matrix Composites market estimates and forecasts, by Silicon Carbide, 2018 - 2030 (Tons) (USD Million)
- 4.2.3. Carbon
- 4.2.3.1. Ceramic Matrix Composites market estimates and forecasts, by Carbon, 2018 - 2030 (Tons) (USD Million)
- 4.2.4. Others
- 4.2.4.1. Ceramic Matrix Composites market estimates and forecasts, by Others, 2018 - 2030 (Tons) (USD Million)
- 4.2.1. Oxide
Chapter 5. Ceramic Matrix Composites Market: Application Estimates & Trend Analysis
- 5.1. Key Takeaways
- 5.2. Application Market Share Analysis, 2022 & 2030
- 5.2.1. Aerospace
- 5.2.1.1. Ceramic Matrix Composites market estimates and forecasts, by Aerospace applications, 2018 - 2030 (Tons) (USD Million)
- 5.2.2. Defense
- 5.2.2.1. Ceramic Matrix Composites market estimates and forecasts, by Defense, 2018 - 2030 (Tons) (USD Million)
- 5.2.3. Energy & Power
- 5.2.3.1. Ceramic Matrix Composites market estimates and forecasts, by Energy & Power, 2018 - 2030 (Tons) (USD Million)
- 5.2.4. Electrical & Electronics
- 5.2.4.1. Ceramic Matrix Composites market estimates and forecasts, by Electrical & Electronics, 2018 - 2030 (Tons) (USD Million)
- 5.2.5. Hypersonic Missiles
- 5.2.5.1. Ceramic Matrix Composites market estimates and forecasts, by Electrical & Electronics, 2018 - 2030 (Tons) (USD Million)
- 5.2.6. Others
- 5.2.6.1. Ceramic Matrix Composites market estimates and forecasts, by Others, 2018 - 2030 (Tons) (USD Million)
- 5.2.1. Aerospace
Chapter 6. Ceramic Matrix Composites Market: Regional Estimates & Trend Analysis
- 6.1. Key Takeaways
- 6.2. Regional Market Share Analysis, 2022 & 2030
- 6.3. North America
- 6.3.1. North America ceramic matrix composites market estimates and forecasts, 2018 -2030 (Tons) (USD Million)
- 6.3.2. U.S.
- 6.3.2.1. U.S. ceramic matrix composites market estimates and forecasts, 2018 -2030 (Tons) (USD Million)
- 6.3.3. Canada
- 6.3.3.1. Canada ceramic matrix composites market estimates and forecasts, 2018 -2030 (Tons) (USD Million)
- 6.3.4. Mexico
- 6.3.4.1. Mexico ceramic matrix composites market estimates and forecasts, 2018 -2030 (Tons) (USD Million)
- 6.4 Europe
- 6.4.1 Europe ceramic matrix composites market estimates and forecasts, 2018 -2030 (Tons) (USD Million)
- 6.4.2 Germany
- 6.4.2.1 Germany ceramic matrix composites market estimates and forecasts, 2018 -2030 (Tons) (USD Million)
- 6.4.3 UK
- 6.4.3.1 UK ceramic matrix composites market estimates and forecasts, 2018 -2030 (Tons) (USD Million)
- 6.4.4 France
- 6.4.4.1 France ceramic matrix composites market estimates and forecasts, 2018 -2030 (Tons) (USD Million)
- 6.4.5 Spain
- 6.4.5.1 Spain ceramic matrix composites market estimates and forecasts, 2018 -2030 (Tons) (USD Million)
- 6.4.6 Italy
- 6.4.6.1 Italy ceramic matrix composites market estimates and forecasts, 2018 -2030 (Tons) (USD Million)
- 6.5 Asia Pacific
- 6.5.1 Asia Pacific ceramic matrix composites market estimates and forecasts, 2018 -2030 (Tons) (USD Million)
- 6.5.2 China
- 6.5.2.1 China ceramic matrix composites market estimates and forecasts, 2018 -2030 (Tons) (USD Million)
- 6.5.3 India
- 6.5.3.1 India ceramic matrix composites market estimates and forecasts, 2018 -2030 (Tons) (USD Million)
- 6.5.4 Japan
- 6.5.4.1 Japan ceramic matrix composites market estimates and forecasts, 2018 -2030 (Tons) (USD Million)
- 6.5.5 South Korea
- 6.5.5.1 South Korea ceramic matrix composites market estimates and forecasts, 2018 -2030 (Tons) (USD Million)
- 6.6 Central & South America
- 6.6.1 Central & South America ceramic matrix composites market estimates and forecasts, 2018 -2030 (Tons) (USD Million)
- 6.6.2 Brazil
- 6.6.2.1 Brazil ceramic matrix composites market estimates and forecasts, 2018 -2030 (Tons) (USD Million)
- 6.7 Middle East & Africa
- 6.7.1 Middle East & Africa ceramic matrix composites market estimates and forecasts, 2018 -2030 (Tons) (USD Million)
Chapter 7. Ceramic Matrix Composites Market: Competitive Analysis
- 7.1. Key Global Player, Their Initiatives, & Their Impact on the Market
- 7.2. Competitive Environment
- 7.3. Company Market Positioning
- 7.4. Company Heat Map Analysis
- 7.5. Strategy Mapping
- 7.6. Company Listing
- 7.6.1. 3M Company
- 7.6.1.1. Company Overview
- 7.6.1.2. Financial Performance
- 7.6.1.3. Product Benchmarking
- 7.6.1.4. Strategic Initiatives
- 7.6.2. COI Ceramics, Inc.
- 7.6.2.1. Company Overview
- 7.6.2.2. Financial Performance
- 7.6.2.3. Product Benchmarking
- 7.6.2.4. Strategic Initiatives
- 7.6.3. CoorsTek, Inc.
- 7.6.3.1. Company Overview
- 7.6.3.2. Financial Performance
- 7.6.3.3. Product Benchmarking
- 7.6.3.4. Strategic Initiatives
- 7.6.4. General Electric Company
- 7.6.4.1. Company Overview
- 7.6.4.2. Financial Performance
- 7.6.4.3. Product Benchmarking
- 7.6.4.4. Strategic Initiatives
- 7.6.5. Kyocera Corporation
- 7.6.5.1. Company Overview
- 7.6.5.2. Financial Performance
- 7.6.5.3. Product Benchmarking
- 7.6.5.4. Strategic Initiatives
- 7.6.6. Lancer Systems LP
- 7.6.6.1. Company Overview
- 7.6.6.2. Financial Performance
- 7.6.6.3. Product Benchmarking
- 7.6.6.4. Strategic Initiatives
- 7.6.7. SGL Carbon Company
- 7.6.7.1. Company Overview
- 7.6.7.2. Financial Performance
- 7.6.7.3. Product Benchmarking
- 7.6.7.4. Strategic Initiatives
- 7.6.8. Ultramet, Inc.
- 7.6.8.1. Company Overview
- 7.6.8.2. Financial Performance
- 7.6.8.3. Product Benchmarking
- 7.6.8.4. Strategic Initiatives
- 7.6.9. Ube Industries, Ltd.
- 7.6.9.1. Company Overview
- 7.6.9.2. Financial Performance
- 7.6.9.3. Product Benchmarking
- 7.6.9.4. Strategic Initiatives
- 7.6.1. 3M Company


