|
|
市場調査レポート
商品コード
1701333
希少疾患臨床検査市場規模、シェア、動向分析レポート:フェーズ別、治療領域別、スポンサー別、地域別、セグメント別予測、2025年~2030年Rare Disease Clinical Trials Market Size, Share, & Trends Analysis Report By Phase (Phase I, Phase II, Phase III, Phase IV), By Therapeutic Area (Oncology, Cardiovascular), By Sponsor, By Region, And Segment Forecasts, 2025 - 2030 |
||||||
|
|||||||
カスタマイズ可能
|
|||||||


| 希少疾患臨床検査市場規模、シェア、動向分析レポート:フェーズ別、治療領域別、スポンサー別、地域別、セグメント別予測、2025年~2030年 |
|
出版日: 2025年03月18日
発行: Grand View Research
ページ情報: 英文 100 Pages
納期: 2~10営業日
|

全表示
- 概要
- 図表
- 目次
希少疾患臨床検査市場の成長と動向
Grand View Research, Inc.の最新レポートによると、世界の希少疾患臨床検査市場規模は2025~2030年にかけてCAGR 6.8%で拡大し、2030年には190億2,000万米ドルに達する見込みです。
希少疾患臨床検査産業の主要促進要因は、世界的に希少疾患の負担が大きく、調査需要が高まっていることです。さらに、断続的な上市とパイプラインにある多数の製品も成長を後押ししています。希少疾病用医薬品法(Orphan Drug Act)のような製品開発を奨励する政府の取り組みは、産業の成長をさらに後押しすると期待されています。
米国国立衛生ラボ(NIH)によると、世界には7,000を超える希少疾病が存在します。これらの病気は約3,000万人のアメリカ人に、つまり10人に1人の割合で罹患しています。ユーロディスによれば、希少疾患の72%は遺伝によるもので、その他は感染症、アレルギー、環境によるものです。希少疾患に対する人々の意識の高まりや、希少疾患治療のための潜在的治療法の開発に対する関心の高まりが、市場の成長を支えるものと期待されています。
製薬会社や非営利団体は、希少疾患臨床研究に積極的に資金を提供しています。例えば、2022年2月には、Health Research Boardが希少疾患臨床検査を支援するために110万米ドルの資金を提供しました。今後も同様の取り組みが行われ、予測期間中の市場を支えることが期待されます。
希少疾病用医薬品の売上は近年着実に増加しています。例えば、Evaluate Pharmaによると、希少疾病用医薬品の売上高は2020年には1,380億米ドルを占め、2022年には1,720億米ドルに達します。オーファンドラッグの売上高は、2026年までに2,680億米ドルに達すると推定されています。希少疾病治療の売上増加は、希少疾病領域における新たな治療開発への研究者の関心を喚起し、パンデミック後の市場を支えるものと期待されます。
希少疾患臨床検査市場レポートハイライト
- フェーズIIIセグメントは2024年の売上高シェア54.2%で市場を独占。このセグメントの成長を支えているのは、多数のボランティアを必要とするため、第III相希少疾患臨床検査のコストが高いことです。
- 2024年には、がん領域が最大の売上シェアを占めました。希少がんを治療するための新たな潜在的治療法の開発に対する研究者の関心の高まりが、このセグメントの成長を支えています。
- 非営利団体セグメントは、これらの団体が希少疾患臨床研究を支援するために多額の資金を提供していることから、予測期間中に大きなCAGRで成長すると予測されています。
- 北米が市場を独占し、2024年の売上シェアは42.6%でした。北米における希少疾患の罹患率の高さ、臨床検査において多数の企業が存在することなどが、高い市場シェアの主要理由です。
目次
第1章 調査手法と範囲
第2章 エグゼクティブサマリー
第3章 希少疾患臨床検査市場の変数、動向、範囲
- 市場系統の展望
- 市場力学
- 市場促進要因分析
- 市場抑制要因分析
- ビジネス環境分析
- 産業分析-ポーターのファイブフォース分析
- PESTLE分析
第4章 希少疾患臨床検査市場:フェーズビジネス分析
- フェーズ市場シェア、2024年と2030年
- フェーズセグメントダッシュボード
- 市場規模と予測と動向分析(フェーズ別、2018~2030年)
- フェーズI
- フェーズII
- フェーズIII
- フェーズIV
第5章 希少疾患臨床検査市場:治療領域ビジネス分析
- 治療領域市場シェア、2024年と2030年
- 治療領域セグメントダッシュボード
- 市場規模、予測、動向分析(治療領域別、2018~2030年)
- 腫瘍学
- 心血管疾患
- 神経疾患
- 感染症
- 遺伝性疾患
- 自己免疫と炎症
- 血液疾患
- 筋骨格系障害
- その他
第6章 希少疾患臨床検査市場:スポンサービジネス分析
- スポンサー市場シェア、2024年と2030年
- スポンサーセグメントダッシュボード
- 市場規模と予測と動向分析(スポンサー別、2018~2030年)
- 製薬・バイオ医薬品企業
- 非営利団体
- その他
第7章 希少疾患臨床検査市場:地域別、推定・動向分析
- 地域別市場シェア分析、2024年と2030年
- 地域別市場ダッシュボード
- 市場規模と予測動向分析、2018~2030年
- 北米
- 国別、2018~2030年
- 米国
- カナダ
- メキシコ
- 欧州
- 国別、2018~2030年
- 英国
- ドイツ
- フランス
- イタリア
- スペイン
- デンマーク
- スウェーデン
- ノルウェー
- アジア太平洋
- 日本
- 中国
- インド
- 韓国
- オーストラリア
- タイ
- ラテンアメリカ
- 国別、2018~2030年
- ブラジル
- アルゼンチン
- 中東・アフリカ
- 国別、2018~2030年
- 南アフリカ
- サウジアラビア
- アラブ首長国連邦
- クウェート
第8章 競合情勢
- 参加者概要
- 企業の市況分析
- 企業分類
- 戦略マッピング
- 企業プロファイル/上場企業
- Takeda Pharmaceutical Company Limited
- F. Hoffmann-La Roche Ltd
- Pfizer Inc
- AstraZeneca
- Novartis AG
- Laboratory Corporation of America Holdings(LabCorp)
- IQVIA
- Charles River Laboratories
- ICON plc
- Parexel International(MA)Corporation
List of Tables
- Table 1. List of secondary sources
- Table 2. List of abbreviations
- Table 3. Global rare disease clinical trials market, by region, 2018 - 2030 (USD Billion)
- Table 4. Global rare disease clinical trials market, by phase, 2018 - 2030 (USD Billion)
- Table 5. Global rare disease clinical trials market, by therapeutic area, 2018 - 2030 (USD Billion)
- Table 6. Global rare disease clinical trials market, by sponsor, 2018 - 2030 (USD Billion)
- Table 7. North America rare disease clinical trials market, by country, 2018 - 2030 (USD Billion)
- Table 8. North America rare disease clinical trials market, by phase, 2018 - 2030 (USD Billion)
- Table 9. North America rare disease clinical trials market, by therapeutic area, 2018 - 2030 (USD Billion)
- Table 10. North America rare disease clinical trials market, by sponsor, 2018 - 2030 (USD Billion)
- Table 11. U.S. rare disease clinical trials market, by phase, 2018 - 2030 (USD Billion)
- Table 12. U.S. rare disease clinical trials market, by therapeutic area, 2018 - 2030 (USD Billion)
- Table 13. U.S. rare disease clinical trials market, by sponsor, 2018 - 2030 (USD Billion)
- Table 14. Canada rare disease clinical trials market, by phase, 2018 - 2030 (USD Billion)
- Table 15. Canada rare disease clinical trials market, by therapeutic area, 2018 - 2030 (USD Billion)
- Table 16. Canada rare disease clinical trials market, by sponsor, 2018 - 2030 (USD Billion)
- Table 17. Mexico rare disease clinical trials market, by phase, 2018 - 2030 (USD Billion)
- Table 18. Mexico rare disease clinical trials market, by therapeutic area, 2018 - 2030 (USD Billion)
- Table 19. Mexico rare disease clinical trials market, by sponsor, 2018 - 2030 (USD Billion)
- Table 20. Europe rare disease clinical trials market, by country, 2018 - 2030 (USD Billion)
- Table 21. Europe rare disease clinical trials market, by phase, 2018 - 2030 (USD Billion)
- Table 22. Europe rare disease clinical trials market, by therapeutic area, 2018 - 2030 (USD Billion)
- Table 23. Europe rare disease clinical trials market, by sponsor, 2018 - 2030 (USD Billion)
- Table 24. UK rare disease clinical trials market, by phase, 2018 - 2030 (USD Billion)
- Table 25. UK rare disease clinical trials market, by therapeutic area, 2018 - 2030 (USD Billion)
- Table 26. UK rare disease clinical trials market, by sponsor, 2018 - 2030 (USD Billion)
- Table 27. Germany rare disease clinical trials market, by phase, 2018 - 2030 (USD Billion)
- Table 28. Germany rare disease clinical trials market, by therapeutic area, 2018 - 2030 (USD Billion)
- Table 29. Germany rare disease clinical trials market, by sponsor, 2018 - 2030 (USD Billion)
- Table 30. France rare disease clinical trials market, by phase, 2018 - 2030 (USD Billion)
- Table 31. France rare disease clinical trials market, by therapeutic area, 2018 - 2030 (USD Billion)
- Table 32. France rare disease clinical trials market, by sponsor, 2018 - 2030 (USD Billion)
- Table 33. Italy rare disease clinical trials market, by phase, 2018 - 2030 (USD Billion)
- Table 34. Italy rare disease clinical trials market, by therapeutic area, 2018 - 2030 (USD Billion)
- Table 35. Italy rare disease clinical trials market, by sponsor, 2018 - 2030 (USD Billion)
- Table 36. Spain rare disease clinical trials market, by phase, 2018 - 2030 (USD Billion)
- Table 37. Spain rare disease clinical trials market, by therapeutic area, 2018 - 2030 (USD Billion)
- Table 38. Spain rare disease clinical trials market, by sponsor, 2018 - 2030 (USD Billion)
- Table 39. Denmark rare disease clinical trials market, by phase, 2018 - 2030 (USD Billion)
- Table 40. Denmark rare disease clinical trials market, by therapeutic area, 2018 - 2030 (USD Billion)
- Table 41. Denmark rare disease clinical trials market, by sponsor, 2018 - 2030 (USD Billion)
- Table 42. Sweden rare disease clinical trials market, by phase, 2018 - 2030 (USD Billion)
- Table 43. Sweden rare disease clinical trials market, by therapeutic area, 2018 - 2030 (USD Billion)
- Table 44. Sweden rare disease clinical trials market, by sponsor, 2018 - 2030 (USD Billion)
- Table 45. Norway rare disease clinical trials market, by phase, 2018 - 2030 (USD Billion)
- Table 46. Norway rare disease clinical trials market, by therapeutic area, 2018 - 2030 (USD Billion)
- Table 47. Norway rare disease clinical trials market, by sponsor, 2018 - 2030 (USD Billion)
- Table 48. Asia Pacific rare disease clinical trials market, by country, 2018 - 2030 (USD Billion)
- Table 49. Asia Pacific rare disease clinical trials market, by phase, 2018 - 2030 (USD Billion)
- Table 50. Asia Pacific rare disease clinical trials market, by therapeutic area, 2018 - 2030 (USD Billion)
- Table 51. Asia Pacific rare disease clinical trials market, by sponsor, 2018 - 2030 (USD Billion)
- Table 52. Japan rare disease clinical trials market, by phase, 2018 - 2030 (USD Billion)
- Table 53. Japan rare disease clinical trials market, by therapeutic area, 2018 - 2030 (USD Billion)
- Table 54. Japan rare disease clinical trials market, by sponsor, 2018 - 2030 (USD Billion)
- Table 55. China rare disease clinical trials market, by phase, 2018-2030 (USD Billion)
- Table 56. China rare disease clinical trials market, by therapeutic area, 2018-2030 (USD Billion)
- Table 57. China rare disease clinical trials market, by sponsor, 2018-2030 (USD Billion)
- Table 58. India rare disease clinical trials market, by phase, 2018 - 2030 (USD Billion)
- Table 59. India rare disease clinical trials market, by therapeutic area, 2018 - 2030 (USD Billion)
- Table 60. India rare disease clinical trials market, by sponsor, 2018 - 2030 (USD Billion)
- Table 61. South Korea rare disease clinical trials market, by phase, 2018 - 2030 (USD Billion)
- Table 62. South Korea rare disease clinical trials market, by therapeutic area, 2018 - 2030 (USD Billion)
- Table 63. South Korea rare disease clinical trials market, by sponsor, 2018 - 2030 (USD Billion)
- Table 64. Australia rare disease clinical trials market, by phase, 2018 - 2030 (USD Billion)
- Table 65. Australia rare disease clinical trials market, by therapeutic area, 2018 - 2030 (USD Billion)
- Table 66. Australia rare disease clinical trials market, by sponsor, 2018 - 2030 (USD Billion)
- Table 67. Thailand rare disease clinical trials market, by phase, 2018 - 2030 (USD Billion)
- Table 68. Thailand rare disease clinical trials market, by therapeutic area, 2018 - 2030 (USD Billion)
- Table 69. Thailand rare disease clinical trials market, by sponsor, 2018 - 2030 (USD Billion)
- Table 70. Latin America rare disease clinical trials market, by country, 2018 - 2030 (USD Billion)
- Table 71. Latin America rare disease clinical trials market, by phase, 2018 - 2030 (USD Billion)
- Table 72. Latin America rare disease clinical trials market, by therapeutic area, 2018 - 2030 (USD Billion
- Table 73. Latin America rare disease clinical trials market, by sponsor, 2018 - 2030 (USD Billion
- Table 74. Brazil rare disease clinical trials market, by phase, 2018 - 2030 (USD Billion)
- Table 75. Brazil rare disease clinical trials market, by therapeutic area, 2018 - 2030 (USD Billion)
- Table 76. Brazil rare disease clinical trials market, by sponsor, 2018 - 2030 (USD Billion)
- Table 77. Argentina rare disease clinical trials market, by phase, 2018 - 2030 (USD Billion)
- Table 78. Argentina rare disease clinical trials market, by therapeutic area, 2018 - 2030 (USD Billion)
- Table 79. Argentina rare disease clinical trials market, by sponsor, 2018 - 2030 (USD Billion)
- Table 80. Middle East & Africa rare disease clinical trials market, by country, 2018 - 2030 (USD Billion)
- Table 81. Middle East & Africa rare disease clinical trials market, by phase, 2018 - 2030 (USD Billion)
- Table 82. Middle East & Africa rare disease clinical trials market, by therapeutic area, 2018 - 2030 (USD Billion)
- Table 83. Middle East & Africa rare disease clinical trials market, by sponsor, 2018 - 2030 (USD Billion)
- Table 84. South Africa rare disease clinical trials market, by phase, 2018 - 2030 (USD Billion)
- Table 85. South Africa rare disease clinical trials market, by therapeutic area, 2018 - 2030 (USD Billion)
- Table 86. South Africa rare disease clinical trials market, by sponsor, 2018 - 2030 (USD Billion)
- Table 87. Saudi Arabia rare disease clinical trials market, by phase, 2018 - 2030 (USD Billion)
- Table 88. Saudi Arabia rare disease clinical trials market, by therapeutic area, 2018 - 2030 (USD Billion)
- Table 89. Saudi Arabia rare disease clinical trials market, by sponsor, 2018 - 2030 (USD Billion)
- Table 90. UAE rare disease clinical trials market, by phase, 2018 - 2030 (USD Billion)
- Table 91. UAE rare disease clinical trials market, by therapeutic area, 2018 - 2030 (USD Billion)
- Table 92. UAE rare disease clinical trials market, by sponsor, 2018 - 2030 (USD Billion)
- Table 93. Kuwait rare disease clinical trials market, by phase, 2018 - 2030 (USD Billion)
- Table 94. Kuwait rare disease clinical trials market, by therapeutic area, 2018 - 2030 (USD Billion)
- Table 95. Kuwait rare disease clinical trials market, by sponsor, 2018 - 2030 (USD Billion)
List of Figures
- Fig. 1 Rare disease clinical trials market segmentation
- Fig. 2 Market research process
- Fig. 3 Data triangulation techniques
- Fig. 4 Primary research pattern
- Fig. 5 Market research approaches
- Fig. 6 Value-chain-based sizing & forecasting
- Fig. 7 Market formulation & validation
- Fig. 8 Market snapshot
- Fig. 9 Phase outlook (USD Billion)
- Fig. 10 Therapeutic area outlook (USD Billion)
- Fig. 11 Sponsor outlook (USD Billion)
- Fig. 12 Competitive landscape
- Fig. 13 Rare disease clinical trials market dynamics
- Fig. 14 Rare disease clinical trials market: Porter's five forces analysis
- Fig. 15 Rare disease clinical trials market: PESTLE analysis
- Fig. 16 Rare disease clinical trials market: Phase segment dashboard
- Fig. 17 Rare disease clinical trials market: Phase market share analysis, 2024 & 2030
- Fig. 18 Phase I market, 2018 - 2030 (USD Billion)
- Fig. 19 Phase II market, 2018 - 2030 (USD Billion)
- Fig. 20 Phase III market, 2018 - 2030 (USD Billion)
- Fig. 21 Phase IV market, 2018 - 2030 (USD Billion)
- Fig. 22 Rare disease clinical trials market: Therapeutic area segment dashboard
- Fig. 23 Rare disease clinical trials market: Therapeutic area market share analysis, 2024 & 2030
- Fig. 24 Oncology market, 2018 - 2030 (USD Billion)
- Fig. 25 Cardiovascular disorders market, 2018 - 2030 (USD Billion)
- Fig. 26 Neurological disorders market, 2018 - 2030 (USD Billion)
- Fig. 27 Infectious disease market, 2018 - 2030 (USD Billion)
- Fig. 28 Genetic disorders market, 2018 - 2030 (USD Billion)
- Fig. 29 Autoimmune and inflammation market, 2018 - 2030 (USD Billion)
- Fig. 30 Hematologic disorders market, 2018 - 2030 (USD Billion)
- Fig. 31 Musculoskeletal disorders market, 2018 - 2030 (USD Billion)
- Fig. 32 Others market, 2018 - 2030 (USD Billion)
- Fig. 33 Rare disease clinical trials market: Sponsor segment dashboard
- Fig. 34 Rare disease clinical trials market: Sponsor market share analysis, 2024 & 2030
- Fig. 35 Pharmaceutical & biopharmaceutical companies market, 2018 - 2030 (USD Billion)
- Fig. 36 Non-profit organizations market, 2018 - 2030 (USD Billion)
- Fig. 37 Other market, 2018 - 2030 (USD Billion)
- Fig. 38 Rare disease clinical trials market revenue, by region
- Fig. 39 Regional marketplace: Key takeaways
- Fig. 40 North America rare disease clinical trials market, 2018 - 2030 (USD Billion)
- Fig. 41 U.S. country dynamics
- Fig. 42 U.S. rare disease clinical trials market, 2018 - 2030 (USD Billion)
- Fig. 43 Canada country dynamics
- Fig. 44 Canada rare disease clinical trials market, 2018 - 2030 (USD Billion)
- Fig. 45 Mexico country dynamics
- Fig. 46 Mexico rare disease clinical trials market, 2018 - 2030 (USD Billion)
- Fig. 47 Europe rare disease clinical trials market, 2018 - 2030 (USD Billion)
- Fig. 48 UK country dynamics
- Fig. 49 UK rare disease clinical trials market, 2018 - 2030 (USD Billion)
- Fig. 50 Germany country dynamics
- Fig. 51 Germany rare disease clinical trials market, 2018 - 2030 (USD Billion)
- Fig. 52 France country dynamics
- Fig. 53 France rare disease clinical trials market, 2018 - 2030 (USD Billion)
- Fig. 54 Italy country dynamics
- Fig. 55 Italy rare disease clinical trials market, 2018 - 2030 (USD Billion)
- Fig. 56 Spain country dynamics
- Fig. 57 Spain rare disease clinical trials market, 2018 - 2030 (USD Billion)
- Fig. 58 Denmark country dynamics
- Fig. 59 Denmark rare disease clinical trials market, 2018 - 2030 (USD Billion)
- Fig. 60 Sweden country dynamics
- Fig. 61 Sweden rare disease clinical trials market, 2018 - 2030 (USD Billion)
- Fig. 62 Norway country dynamics
- Fig. 63 Norway rare disease clinical trials market, 2018 - 2030 (USD Billion)
- Fig. 64 Asia Pacific rare disease clinical trials market, 2018 - 2030 (USD Billion)
- Fig. 65 Japan country dynamics
- Fig. 66 Japan rare disease clinical trials market, 2018 - 2030 (USD Billion)
- Fig. 67 China country dynamics
- Fig. 68 China rare disease clinical trials market, 2018 - 2030 (USD Billion)
- Fig. 69 India country dynamics
- Fig. 70 India rare disease clinical trials market, 2018 - 2030 (USD Billion)
- Fig. 71 South Korea country dynamics
- Fig. 72 South Korea rare disease clinical trials market, 2018 - 2030 (USD Billion)
- Fig. 73 Australia country dynamics
- Fig. 74 Australia rare disease clinical trials market, 2018 - 2030 (USD Billion)
- Fig. 75 Thailand country dynamics
- Fig. 76 Thailand rare disease clinical trials market, 2018 - 2030 (USD Billion)
- Fig. 77 Latin America rare disease clinical trials market, 2018 - 2030 (USD Billion)
- Fig. 78 Brazil country dynamics
- Fig. 79 Brazil rare disease clinical trials market, 2018 - 2030 (USD Billion)
- Fig. 80 Argentina country dynamics
- Fig. 81 Argentina rare disease clinical trials market, 2018 - 2030 (USD Billion)
- Fig. 82 MEA rare disease clinical trials market, 2018 - 2030 (USD Billion)
- Fig. 83 South Africa country dynamics
- Fig. 84 South Africa rare disease clinical trials market, 2018 - 2030 (USD Billion)
- Fig. 85 Saudi Arabia country dynamics
- Fig. 86 Saudi Arabia rare disease clinical trials market, 2018 - 2030 (USD Billion)
- Fig. 87 UAE country dynamics
- Fig. 88 UAE rare disease clinical trials market, 2018 - 2030 (USD Billion)
- Fig. 89 Kuwait country dynamics
- Fig. 90 Kuwait rare disease clinical trials market, 2018 - 2030 (USD Billion)
- Fig. 91 Company categorization
- Fig. 92 Company market position analysis
- Fig. 93 Strategic framework
Rare Disease Clinical Trials Market Growth & Trends:
The global rare disease clinical trials market size is expected to reach USD 19.02 billion by 2030, expanding at 6.8% CAGR from 2025 to 2030, according to a new report by Grand View Research, Inc. The main driving factors of the rare disease clinical trial industry are the high burden of rare diseases worldwide, which has led to rising demand for research. Furthermore, intermittent launches and a large number of products in the pipeline also propel growth. Government initiatives that encourage product development, such as the Orphan Drug Act, are further expected to assist industry growth.
According to the National Institutes of Health (NIH), there are more than 7,000 rare diseases worldwide. These diseases affect nearly 30 million Americans, or 1 in every 10 people. Eurodis states that 72% of rare diseases are genetic, while others are caused by infections, allergies, and environmental causes. The growing awareness among people regarding rare diseases and growing interest in developing potential treatments for treating rare diseases are expected to support market growth.
Pharmaceutical companies and non-profit organizations are actively providing funding for rare disease clinical research. For instance, in February 2022, the Health Research Board funded USD 1.1 million to support rare disease clinical trials. Similar initiatives in the future are expected to support the market during the forecast period.
Orphan drug sales have been steadily increasing in recent years. For instance, according to Evaluate Pharma, orphan drug sales accounted for USD 138 billion in 2020, and by 2022, they accounted for USD 172 billion. It is estimated that orphan drug sales will reach USD 268 billion by 2026. The rise in the sales of orphan drugs is expected to generate interest among researchers in developing new treatments in the area of rare diseases and thus support the market in the post-pandemic period.
Rare Disease Clinical Trials Market Report Highlights:
- The phase III segment dominated the market with the largest revenue share of 54.2% in 2024. The segment's growth is supported by the high cost of phase III rare disease clinical trials due to the requirement for a large number of volunteers
- The oncology segment dominated the market with the largest revenue share in 2024. The growing interest of researchers in the development of new potential treatments for treating rare cancers is supporting the growth of the segment
- The non-profit organizations segment is projected to grow at a significant CAGR over the forecast period owing to the significant funding offered by these organizations to support rare disease clinical research
- North America dominated the market and accounted for a revenue share of 42.6% in 2024. The high burden of rare diseases in North America and the presence of a large number of players in clinical trials are some of the key reasons for its high market share
Table of Contents
Chapter 1. Methodology and Scope
- 1.1. Market Segmentation & Scope
- 1.2. Segment Definitions
- 1.2.1. Phase
- 1.2.2. Therapeutic Area
- 1.2.3. Sponsor
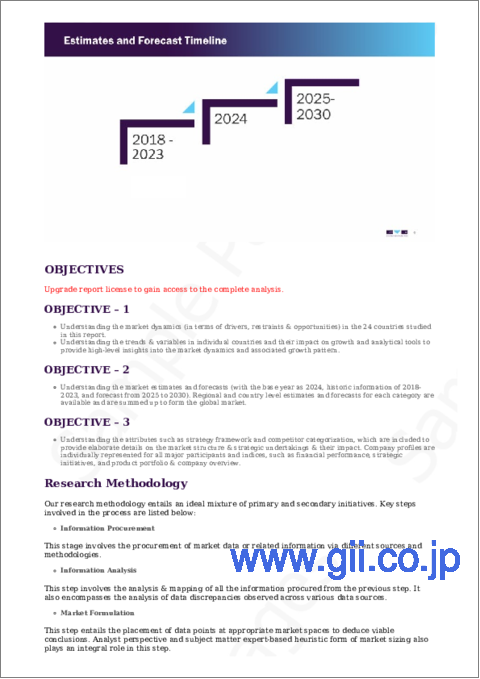
- 1.3. Estimates and Forecast Timeline
- 1.4. Research Methodology
- 1.5. Information Procurement
- 1.5.1. Purchased Database
- 1.5.2. GVR's Internal Database
- 1.5.3. Secondary Sources
- 1.5.4. Primary Research
- 1.6. Information Analysis
- 1.6.1. Data Analysis Models
- 1.7. Market Formulation & Data Visualization
- 1.8. Model Details
- 1.8.1. Commodity Flow Analysis
- 1.9. List of Secondary Sources
- 1.10. Objectives
Chapter 2. Executive Summary
- 2.1. Market Snapshot
- 2.2. Segment Snapshot
- 2.3. Competitive Landscape Snapshot
Chapter 3. Rare Disease Clinical Trials Market Variables, Trends, & Scope
- 3.1. Market Lineage Outlook
- 3.2. Market Dynamics
- 3.2.1. Market Driver Analysis
- 3.2.2. Market Restraint Analysis
- 3.3. Business Environment Analysis
- 3.3.1. Industry Analysis - Porter's Five Forces Analysis
- 3.3.1.1. Supplier Power
- 3.3.1.2. Buyer Power
- 3.3.1.3. Substitution Threat
- 3.3.1.4. Threat of New Entrants
- 3.3.1.5. Competitive Rivalry
- 3.3.2. PESTLE Analysis
- 3.3.1. Industry Analysis - Porter's Five Forces Analysis
Chapter 4. Rare Disease Clinical Trials Market: Phase Business Analysis
- 4.1. Phase Market Share, 2024 & 2030
- 4.2. Phase Segment Dashboard
- 4.3. Market Size & Forecasts and Trend Analysis, by Phase, 2018 to 2030 (USD Billion)
- 4.4. Phase I
- 4.4.1. Phase I Market, 2018 - 2030 (USD Billion)
- 4.5. Phase II
- 4.5.1. Phase II Market, 2018 - 2030 (USD Billion)
- 4.6. Phase III
- 4.6.1. Phase II Market, 2018 - 2030 (USD Billion)
- 4.7. Phase IV
- 4.7.1. Phase IV Market, 2018 - 2030 (USD Billion)
Chapter 5. Rare Disease Clinical Trials Market: Therapeutic Area Business Analysis
- 5.1. Therapeutic Area Market Share, 2024 & 2030
- 5.2. Therapeutic Area Segment Dashboard
- 5.3. Market Size & Forecasts and Trend Analysis, by Therapeutic Area, 2018 to 2030 (USD Billion)
- 5.4. Oncology
- 5.4.1. Oncology Market, 2018 - 2030 (USD Billion)
- 5.5. Cardiovascular Disorders
- 5.5.1. Cardiovascular Disorders Market, 2018 - 2030 (USD Billion)
- 5.6. Neurological Disorders
- 5.6.1. Neurological Disorders Market, 2018 - 2030 (USD Billion)
- 5.7. Infectious Disease
- 5.7.1. Infectious Disease Market, 2018 - 2030 (USD Billion)
- 5.8. Genetic Disorders
- 5.8.1. Genetic Disorders Market, 2018 - 2030 (USD Billion)
- 5.9. Autoimmune and Inflammation
- 5.9.1. Autoimmune and Inflammation Market, 2018 - 2030 (USD Billion)
- 5.10. Hematologic Disorders
- 5.10.1. Hematologic Disorders Market, 2018 - 2030 (USD Billion)
- 5.11. Musculoskeletal Disorders
- 5.11.1. Musculoskeletal Disorders Market, 2018 - 2030 (USD Billion)
- 5.12. Others
- 5.12.1. Others Market, 2018 - 2030 (USD Billion)
Chapter 6. Rare Disease Clinical Trials Market: Sponsor Business Analysis
- 6.1. Sponsor Market Share, 2024 & 2030
- 6.2. Sponsor Segment Dashboard
- 6.3. Market Size & Forecasts and Trend Analysis, by Sponsor, 2018 to 2030 (USD Billion)
- 6.4. Pharmaceutical & Biopharmaceutical Companies
- 6.4.1. Pharmaceutical & Biopharmaceutical Companies Market, 2018 - 2030 (USD Billion)
- 6.5. Non-Profit Organizations
- 6.5.1. Non-Profit Organizations Market, 2018 - 2030 (USD Billion)
- 6.6. Other
- 6.6.1. Other Market, 2018 - 2030 (USD Billion)
Chapter 7. Rare Disease Clinical Trials Market: Regional Estimates & Trend Analysis
- 7.1. Regional Market Share Analysis, 2024 & 2030
- 7.2. Regional Market Dashboard
- 7.3. Market Size & Forecasts Trend Analysis, 2018 to 2030:
- 7.4. North America
- 7.4.1. North America Rare Disease Clinical Trials Market Estimates and Forecasts, by Country, 2018 - 2030 (USD Billion)
- 7.4.2. U.S.
- 7.4.2.1. Key Country Dynamics
- 7.4.2.2. Regulatory Framework
- 7.4.2.3. Competitive Insights
- 7.4.2.4. U.S. Rare Disease Clinical Trials Market Estimates and Forecasts, 2018 - 2030 (USD Billion)
- 7.4.3. Canada
- 7.4.3.1. Key Country Dynamics
- 7.4.3.2. Regulatory Framework
- 7.4.3.3. Competitive Insights
- 7.4.3.4. Canada Rare Disease Clinical Trials Market Estimates and Forecasts, 2018 - 2030 (USD Billion)
- 7.4.4. Mexico
- 7.4.4.1. Key Country Dynamics
- 7.4.4.2. Regulatory Framework
- 7.4.4.3. Competitive Insights
- 7.4.4.4. Mexico Rare Disease Clinical Trials Market Estimates and Forecasts, 2018 - 2030 (USD Billion)
- 7.5. Europe
- 7.5.1. Europe Rare Disease Clinical Trials Market Estimates and Forecasts, by Country, 2018 - 2030 (USD Billion)
- 7.5.2. UK
- 7.5.2.1. Key Country Dynamics
- 7.5.2.2. Regulatory Framework
- 7.5.2.3. Competitive Insights
- 7.5.2.4. UK Rare Disease Clinical Trials Market Estimates and Forecasts, 2018 - 2030 (USD Billion)
- 7.5.3. Germany
- 7.5.3.1. Key Country Dynamics
- 7.5.3.2. Regulatory Framework
- 7.5.3.3. Competitive Insights
- 7.5.3.4. Germany Rare Disease Clinical Trials Market Estimates and Forecasts, 2018 - 2030 (USD Billion)
- 7.5.4. France
- 7.5.4.1. Key Country Dynamics
- 7.5.4.2. Regulatory Framework
- 7.5.4.3. Competitive Insights
- 7.5.4.4. France Rare Disease Clinical Trials Market Estimates and Forecasts, 2018 - 2030 (USD Billion)
- 7.5.5. Italy
- 7.5.5.1. Key Country Dynamics
- 7.5.5.2. Regulatory Framework
- 7.5.5.3. Competitive Insights
- 7.5.5.4. Italy Rare Disease Clinical Trials Market Estimates and Forecasts, 2018 - 2030 (USD Billion)
- 7.5.6. Spain
- 7.5.6.1. Key Country Dynamics
- 7.5.6.2. Regulatory Framework
- 7.5.6.3. Competitive Insights
- 7.5.6.4. Spain Rare Disease Clinical Trials Market Estimates and Forecasts, 2018 - 2030 (USD Billion)
- 7.5.7. Denmark
- 7.5.7.1. Key Country Dynamics
- 7.5.7.2. Regulatory Framework
- 7.5.7.3. Competitive Insights
- 7.5.7.4. Denmark Rare Disease Clinical Trials Market Estimates and Forecasts, 2018 - 2030 (USD Billion)
- 7.5.8. Sweden
- 7.5.8.1. Key Country Dynamics
- 7.5.8.2. Regulatory Framework
- 7.5.8.3. Competitive Insights
- 7.5.8.4. Sweden Rare Disease Clinical Trials Market Estimates and Forecasts, 2018 - 2030 (USD Billion)
- 7.5.9. Norway
- 7.5.9.1. Key Country Dynamics
- 7.5.9.2. Regulatory Framework
- 7.5.9.3. Competitive Insights
- 7.5.9.4. Norway Rare Disease Clinical Trials Market Estimates and Forecasts, 2018 - 2030 (USD Billion)
- 7.6. Asia Pacific
- 7.6.1. Asia Pacific Rare Disease Clinical Trials Market Estimates and Forecasts, 2018 - 2030 (USD Billion)
- 7.6.2. Japan
- 7.6.2.1. Key Country Dynamics
- 7.6.2.2. Regulatory Framework
- 7.6.2.3. Competitive Insights
- 7.6.2.4. Japan Rare Disease Clinical Trials Market Estimates and Forecasts, 2018 - 2030 (USD Billion)
- 7.6.3. China
- 7.6.3.1. Key Country Dynamics
- 7.6.3.2. Regulatory Framework
- 7.6.3.3. Competitive Insights
- 7.6.3.4. China Rare Disease Clinical Trials Market Estimates and Forecasts, 2018 - 2030 (USD Billion)
- 7.6.4. India
- 7.6.4.1. Key Country Dynamics
- 7.6.4.2. Regulatory Framework
- 7.6.4.3. Competitive Insights
- 7.6.4.4. India Rare Disease Clinical Trials Market Estimates and Forecasts, 2018 - 2030 (USD Billion)
- 7.6.5. South Korea
- 7.6.5.1. Key Country Dynamics
- 7.6.5.2. Regulatory Framework
- 7.6.5.3. Competitive Insights
- 7.6.5.4. South Korea Rare Disease Clinical Trials Market Estimates and Forecasts, 2018 - 2030 (USD Billion)
- 7.6.6. Australia
- 7.6.6.1. Key Country Dynamics
- 7.6.6.2. Regulatory Framework
- 7.6.6.3. Competitive Insights
- 7.6.6.4. Australia Rare Disease Clinical Trials Market Estimates and Forecasts, 2018 - 2030 (USD Billion)
- 7.6.7. Thailand
- 7.6.7.1. Key Country Dynamics
- 7.6.7.2. Regulatory Framework
- 7.6.7.3. Competitive Insights
- 7.6.7.4. Thailand Rare Disease Clinical Trials Market Estimates and Forecasts, 2018 - 2030 (USD Billion)
- 7.7. Latin America
- 7.7.1. Latin America Rare Disease Clinical Trials Market Estimates and Forecasts, by Country, 2018 - 2030 (USD Billion)
- 7.7.2. Brazil
- 7.7.2.1. Key Country Dynamics
- 7.7.2.2. Regulatory Framework
- 7.7.2.3. Competitive Insights
- 7.7.2.4. Brazil Rare Disease Clinical Trials Market Estimates and Forecasts, 2018 - 2030 (USD Billion)
- 7.7.3. Argentina
- 7.7.3.1. Key Country Dynamics
- 7.7.3.2. Regulatory Framework
- 7.7.3.3. Competitive Insights
- 7.7.3.4. Argentina Rare Disease Clinical Trials Market Estimates and Forecasts, 2018 - 2030 (USD Billion)
- 7.8. MEA
- 7.8.1. MEA Rare Disease Clinical Trials Market Estimates and Forecasts, by Country, 2018 - 2030 (USD Billion)
- 7.8.2. South Africa
- 7.8.2.1. Key Country Dynamics
- 7.8.2.2. Regulatory Framework
- 7.8.2.3. Competitive Insights
- 7.8.2.4. South Africa Rare Disease Clinical Trials Market Estimates and Forecasts, 2018 - 2030 (USD Billion)
- 7.8.3. Saudi Arabia
- 7.8.3.1. Key Country Dynamics
- 7.8.3.2. Regulatory Framework
- 7.8.3.3. Competitive Insights
- 7.8.3.4. Saudi Arabia Rare Disease Clinical Trials Market Estimates and Forecasts, 2018 - 2030 (USD Billion)
- 7.8.4. UAE
- 7.8.4.1. Key Country Dynamics
- 7.8.4.2. Regulatory Framework
- 7.8.4.3. Competitive Insights
- 7.8.4.4. UAE Rare Disease Clinical Trials Market Estimates and Forecasts, 2018 - 2030 (USD Billion)
- 7.8.5. Kuwait
- 7.8.5.1. Key Country Dynamics
- 7.8.5.2. Regulatory Framework
- 7.8.5.3. Competitive Insights
- 7.8.5.4. Kuwait Rare Disease Clinical Trials Market Estimates and Forecasts, 2018 - 2030 (USD Billion)
Chapter 8. Competitive Landscape
- 8.1. Participant Overview
- 8.2. Company Market Position Analysis
- 8.3. Company Categorization
- 8.4. Strategy Mapping
- 8.5. Company Profiles/Listing
- 8.5.1. Takeda Pharmaceutical Company Limited
- 8.5.1.1. Overview
- 8.5.1.2. Financial Performance
- 8.5.1.3. Product Benchmarking
- 8.5.1.4. Strategic Initiatives
- 8.5.2. F. Hoffmann-La Roche Ltd
- 8.5.2.1. Overview
- 8.5.2.2. Financial Performance
- 8.5.2.3. Product Benchmarking
- 8.5.2.4. Strategic Initiatives
- 8.5.3. Pfizer Inc
- 8.5.3.1. Overview
- 8.5.3.2. Financial Performance
- 8.5.3.3. Product Benchmarking
- 8.5.3.4. Strategic Initiatives
- 8.5.4. AstraZeneca
- 8.5.4.1. Overview
- 8.5.4.2. Financial Performance
- 8.5.4.3. Product Benchmarking
- 8.5.4.4. Strategic Initiatives
- 8.5.5. Novartis AG
- 8.5.5.1. Overview
- 8.5.5.2. Financial Performance
- 8.5.5.3. Product Benchmarking
- 8.5.5.4. Strategic Initiatives
- 8.5.6. Laboratory Corporation of America Holdings (LabCorp)
- 8.5.6.1. Overview
- 8.5.6.2. Financial Performance
- 8.5.6.3. Product Benchmarking
- 8.5.6.4. Strategic Initiatives
- 8.5.7. IQVIA
- 8.5.7.1. Overview
- 8.5.7.2. Financial Performance
- 8.5.7.3. Product Benchmarking
- 8.5.7.4. Strategic Initiatives
- 8.5.8. Charles River Laboratories
- 8.5.8.1. Overview
- 8.5.8.2. Financial Performance
- 8.5.8.3. Product Benchmarking
- 8.5.8.4. Strategic Initiatives
- 8.5.9. ICON plc
- 8.5.9.1. Overview
- 8.5.9.2. Financial Performance
- 8.5.9.3. Product Benchmarking
- 8.5.9.4. Strategic Initiatives
- 8.5.10. Parexel International (MA) Corporation
- 8.5.10.1. Overview
- 8.5.10.2. Financial Performance
- 8.5.10.3. Product Benchmarking
- 8.5.10.4. Strategic Initiatives
- 8.5.1. Takeda Pharmaceutical Company Limited
