|
|
市場調査レポート
商品コード
1654368
アンチマネーロンダリングの市場規模、シェア、動向分析レポート:コンポーネント別、製品別、展開別、企業規模別、最終用途別、地域別、セグメント別予測、2025年~2030年Anti-money Laundering Market Size, Share, & Trends Analysis Report By Component, By Product, By Deployment, By Enterprise Size, By End Use, By Region, And Segment Forecasts, 2025 - 2030 |
||||||
|
|||||||
カスタマイズ可能
|
|||||||

| アンチマネーロンダリングの市場規模、シェア、動向分析レポート:コンポーネント別、製品別、展開別、企業規模別、最終用途別、地域別、セグメント別予測、2025年~2030年 |
|
出版日: 2025年01月20日
発行: Grand View Research
ページ情報: 英文 130 Pages
納期: 2~10営業日
|

全表示
- 概要
- 図表
- 目次
アンチマネーロンダリング市場の成長と動向
世界のアンチマネーロンダリング市場規模は、2030年には42億4,000万米ドルに達すると予測され、2025~2030年のCAGRは16.2%で成長すると予測されています。
デジタル決済とモバイル決済の普及がアンチマネーロンダリング市場を牽引しています。eコマースやモバイル決済の台頭により、サイバー犯罪者が資金洗浄やテロ資金調達を行う新たな可能性が生まれています。AMLソリューションには、こうしたチャネルにおける疑わしい活動をモニタリング・検知する能力が求められています。このため、デジタル決済やモバイル決済に特化した新たなアンチマネーロンダリング市場ソリューションの開発が進んでいます。
さらに、金融機関と規制当局間の連携と情報共有の必要性が、アンチマネーロンダリング市場の成長を後押ししています。金融犯罪は世界の問題であり、サイバー犯罪者は国境を越えて活動することが多いです。効果的なAMLソリューションには、法域を超えた金融機関と規制当局の協力が必要です。このため、新たな情報共有プラットフォームの開発や、アンチマネーロンダリング市場のコンプライアンスに関する共通基準の採用が進んでいます。
マネーロンダリングやテロ資金と闘うため、世界中の政府機関が法律や規制を導入しています。政府間組織である金融活動作業部会は、アンチマネーロンダリング法の更新や制定において各国を支援しています。アンチマネーロンダリング法は国によって異なるため、金融機関は法的な問題を回避するために、その国特有の施策を遵守する必要があります。これらの施策を遵守することで、金融機関は違法な資金が金融システムに侵入するのを防ぐための体系的な一連の手続きを確立することができます。
COVID-19の流行はアンチマネーロンダリング市場に好影響を与えました。パンデミックはオンライン取引の増加につながり、詐欺や金融犯罪の新たな機会を生み出しました。AMLソリューションは、金融機関がリアルタイムで不正取引をモニタリング・検知するのに役立ち、こうした不透明な時代における金融犯罪のリスクを軽減します。
アンチマネーロンダリング市場レポートハイライト
- ソフトウェアセグメントが市場をリードし、2024年の世界売上高の63.0%を占めます。
- 2024年の市場収益シェアはトランザクションモニタリングセグメントが最大となっています。金融犯罪の増加により、膨大なトランザクションをリアルタイムで分析できる先進的モニタリングシステムが必要とされていることが成長の要因です。
- 2024年の市場収益シェアは、オンプレミス部門が最大でした。アンチマネーロンダリング市場のオンプレミス型セグメントは、コンプライアンスシステムよりもコントロールとセキュリティを優先する組織にとって、依然として極めて重要です。
- 2024年の市場収益シェアは、大企業セグメントが最大でした。
- BFSIセグメントは2024年に最大の市場収益シェアを占めました。
目次
第1章 調査手法と範囲
第2章 エグゼクティブサマリー
第3章 市場の変数、動向、範囲
- 市場イントロダクション/系統展望
- 産業バリューチェーン分析
- 市場力学
- 市場促進要因の影響分析
- 市場課題の影響分析
- 市場機会の影響分析
- アンチマネーロンダリング市場分析ツール
- ポーターの分析
- PESTEL分析
第4章 アンチマネーロンダリング市場:コンポーネント別、推定・動向分析
- コンポーネントの変動分析と市場シェア、2024年と2030年
- コンポーネント別
- ソフトウェア
- サービス
第5章 アンチマネーロンダリング市場: 製品別、推定・動向分析
- 製品の変動分析と市場シェア、2024年と2030年
- 製品別
- コンプライアンス管理
- 通貨取引報告
- 顧客ID管理
- トランザクションモニタリング
第6章 アンチマネーロンダリング市場:展開別、推定・動向分析
- 展開の変動分析と市場シェア、2024年と2030年
- 展開別
- クラウド
- オンプレミス
第7章 アンチマネーロンダリング市場:企業規模別、推定・動向分析
- 企業規模の変動分析と市場シェア、2024年と2030年
- 企業規模別
- 大企業
- 中小企業
第8章 アンチマネーロンダリング市場:最終用途別、推定・動向分析
- 最終用途の変動分析と市場シェア、2024年と2030年
- 最終用途別
- BFSI
- 政府
- 医療
- ITと通信
- その他
第9章 アンチマネーロンダリング市場:地域別、推定・動向分析
- アンチマネーロンダリング市場シェア、地域別、2024年と2030年
- 北米
- 米国
- カナダ
- メキシコ
- 欧州
- 英国
- ドイツ
- フランス
- アジア太平洋
- 中国
- インド
- 日本
- 韓国
- オーストラリア
- ラテンアメリカ
- ブラジル
- 中東・アフリカ
- サウジアラビア王国(KSA)
- アラブ首長国連邦
- 南アフリカ
第10章 競合情勢
- 主要市場参入企業による最近の動向と影響分析
- 企業分類
- 企業の市場ポジショニング
- 企業の市場シェア分析
- 企業ヒートマップ分析
- 戦略マッピング
- 拡大
- 合併と買収
- パートナーシップとコラボレーション
- 新製品の発売
- 研究開発
- 企業プロファイル
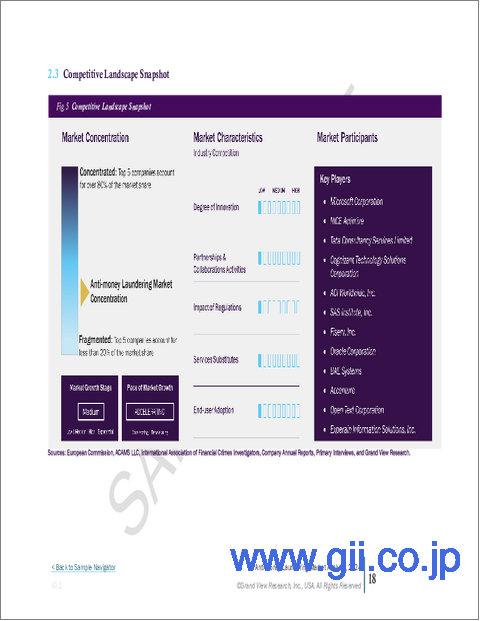
- NICE Actimize
- Tata Consultancy Services Limited
- Cognizant Technology Solutions Corporation
- ACI Worldwide, Inc.
- SAS Institute, Inc.
- Fiserv, Inc.
- Oracle Corporation
- BAE Systems
- Accenture
- Open Text Corporation
- Experian Information Solutions, Inc.
List of Tables
- Table 1 Anti-Money Laundering market,2018 - 2030 (USD Million)
- Table 2 Global market estimates and forecasts, by region, 2018 - 2030 (USD Million)
- Table 3 Global market estimates and forecasts, by component, 2018 - 2030 (USD Million)
- Table 4 Global market estimates and forecasts, by product, 2018 - 2030 (USD Million)
- Table 5 Global market estimates and forecasts, by deployment, 2018 - 2030 (USD Million)
- Table 6 Global market estimates and forecasts, by enterprise size, 2018 - 2030 (USD Million)
- Table 7 Global market estimates and forecasts, by end use, 2018 - 2030 (USD Million)
- Table 8 Software Anti-Money Laundering market, by region, 2018 - 2030 (USD Million)
- Table 9 Services Anti-Money Laundering market, by region, 2018 - 2030 (USD Million)
- Table 10 Compliance Management Anti-Money Laundering market, by region, 2018 - 2030 (USD Million)
- Table 11 Currency Transaction Reporting Anti-Money Laundering market, by region, 2018 - 2030 (USD Million)
- Table 12 Customer Identity Management Anti-Money Laundering market, by region, 2018 - 2030 (USD Million)
- Table 13 Transaction Monitoring Anti-Money Laundering market, by region, 2018 - 2030 (USD Million)
- Table 14 Cloud Anti-Money Laundering market, by region, 2018 - 2030 (USD Million)
- Table 15 On-Premise Anti-Money Laundering market, by region, 2018 - 2030 (USD Million)
- Table 16 Large Enterprises Anti-Money Laundering market, by region, 2018 - 2030 (USD Million)
- Table 17 Small & Medium Enterprise Anti-Money Laundering market, by region, 2018 - 2030 (USD Million)
- Table 18 BFSI Anti-Money Laundering market, by region, 2018 - 2030 (USD Million)
- Table 19 Government Anti-Money Laundering market, by region, 2018 - 2030 (USD Million)
- Table 20 Healthcare Anti-Money Laundering market, by region, 2018 - 2030 (USD Million)
- Table 21 IT & Telecom Anti-Money Laundering market, by region, 2018 - 2030 (USD Million)
- Table 22 Others Anti-Money Laundering market, by region, 2018 - 2030 (USD Million)
- Table 23 North America Anti-Money Laundering market, by component, 2018 - 2030 (USD Million)
- Table 24 North America Anti-Money Laundering market, by product, 2018 - 2030 (USD Million)
- Table 25 North America Anti-Money Laundering market, by deployment, 2018 - 2030 (USD Million)
- Table 26 North America Anti-Money Laundering market, by enterprise size, 2018 - 2030 (USD Million)
- Table 27 North America Anti-Money Laundering market, by end use, 2018 - 2030 (USD Million)
- Table 28 U.S. Anti-Money Laundering market, by component, 2018 - 2030 (USD Million)
- Table 29 U.S. Anti-Money Laundering market, by product, 2018 - 2030 (USD Million)
- Table 30 U.S. Anti-Money Laundering market, by deployment, 2018 - 2030 (USD Million)
- Table 31 U.S. Anti-Money Laundering market, by enterprise size, 2018 - 2030 (USD Million)
- Table 32 U.S. Anti-Money Laundering market, by end use, 2018 - 2030 (USD Million)
- Table 33 Canada Anti-Money Laundering market, by component, 2018 - 2030 (USD Million)
- Table 34 Canada Anti-Money Laundering market, by product, 2018 - 2030 (USD Million)
- Table 35 Canada Anti-Money Laundering market, by deployment, 2018 - 2030 (USD Million)
- Table 36 Canada Anti-Money Laundering market, by enterprise size, 2018 - 2030 (USD Million)
- Table 37 Canada Anti-Money Laundering market, by end use, 2018 - 2030 (USD Million)
- Table 38 Mexico Anti-Money Laundering market, by component, 2018 - 2030 (USD Million)
- Table 39 Mexico Anti-Money Laundering market, by product, 2018 - 2030 (USD Million)
- Table 40 Mexico Anti-Money Laundering market, by deployment, 2018 - 2030 (USD Million)
- Table 41 Mexico Anti-Money Laundering market, by enterprise size, 2018 - 2030 (USD Million)
- Table 42 Mexico Anti-Money Laundering market, by end use, 2018 - 2030 (USD Million)
- Table 43 Europe Anti-Money Laundering market, by component, 2018 - 2030 (USD Million)
- Table 44 Europe Anti-Money Laundering market, by product, 2018 - 2030 (USD Million)
- Table 45 Europe Anti-Money Laundering market, by deployment, 2018 - 2030 (USD Million)
- Table 46 Europe Anti-Money Laundering market, by enterprise size, 2018 - 2030 (USD Million)
- Table 47 Europe Anti-Money Laundering market, by end use, 2018 - 2030 (USD Million)
- Table 48 U.K. Anti-Money Laundering market, by component, 2018 - 2030 (USD Million)
- Table 49 U.K. Anti-Money Laundering market, by product, 2018 - 2030 (USD Million)
- Table 50 U.K. Anti-Money Laundering market, by deployment, 2018 - 2030 (USD Million)
- Table 51 U.K. Anti-Money Laundering market, by enterprise size, 2018 - 2030 (USD Million)
- Table 52 U.K. Anti-Money Laundering market, by end use, 2018 - 2030 (USD Million)
- Table 53 Germany Anti-Money Laundering market, by component, 2018 - 2030 (USD Million)
- Table 54 Germany Anti-Money Laundering market, by product, 2018 - 2030 (USD Million)
- Table 55 Germany Anti-Money Laundering market, by deployment, 2018 - 2030 (USD Million)
- Table 56 Germany Anti-Money Laundering market, by enterprise size, 2018 - 2030 (USD Million)
- Table 57 Germany Anti-Money Laundering market, by end use, 2018 - 2030 (USD Million)
- Table 58 France Anti-Money Laundering market, by component, 2018 - 2030 (USD Million)
- Table 59 France Anti-Money Laundering market, by product, 2018 - 2030 (USD Million)
- Table 60 France Anti-Money Laundering market, by deployment, 2018 - 2030 (USD Million)
- Table 61 France Anti-Money Laundering market, by enterprise size, 2018 - 2030 (USD Million)
- Table 62 France Anti-Money Laundering market, by end use, 2018 - 2030 (USD Million)
- Table 63 Asia Pacific Anti-Money Laundering market, by component, 2018 - 2030 (USD Million)
- Table 64 Asia Pacific Anti-Money Laundering market, by product, 2018 - 2030 (USD Million)
- Table 65 Asia Pacific Anti-Money Laundering market, by deployment, 2018 - 2030 (USD Million)
- Table 66 Asia Pacific Anti-Money Laundering market, by enterprise size, 2018 - 2030 (USD Million)
- Table 67 Asia Pacific Anti-Money Laundering market, by end use, 2018 - 2030 (USD Million)
- Table 68 China Anti-Money Laundering market, by component, 2018 - 2030 (USD Million)
- Table 69 China Anti-Money Laundering market, by product, 2018 - 2030 (USD Million)
- Table 70 China Anti-Money Laundering market, by deployment, 2018 - 2030 (USD Million)
- Table 71 China Anti-Money Laundering market, by enterprise size, 2018 - 2030 (USD Million)
- Table 72 China Anti-Money Laundering market, by end use, 2018 - 2030 (USD Million)
- Table 73 Japan Anti-Money Laundering market, by component, 2018 - 2030 (USD Million)
- Table 74 Japan Anti-Money Laundering market, by product, 2018 - 2030 (USD Million)
- Table 75 Japan Anti-Money Laundering market, by deployment, 2018 - 2030 (USD Million)
- Table 76 Japan Anti-Money Laundering market, by enterprise size, 2018 - 2030 (USD Million)
- Table 77 Japan Anti-Money Laundering market, by end use, 2018 - 2030 (USD Million)
- Table 78 India Anti-Money Laundering market, by component, 2018 - 2030 (USD Million)
- Table 79 India Anti-Money Laundering market, by product, 2018 - 2030 (USD Million)
- Table 80 India Anti-Money Laundering market, by deployment, 2018 - 2030 (USD Million)
- Table 81 India Anti-Money Laundering market, by enterprise size, 2018 - 2030 (USD Million)
- Table 82 India Anti-Money Laundering market, by end use, 2018 - 2030 (USD Million)
- Table 83 South Korea Anti-Money Laundering market, by component, 2018 - 2030 (USD Million)
- Table 84 South Korea Anti-Money Laundering market, by product, 2018 - 2030 (USD Million)
- Table 85 South Korea Anti-Money Laundering market, by deployment, 2018 - 2030 (USD Million)
- Table 86 South Korea Anti-Money Laundering market, by enterprise size, 2018 - 2030 (USD Million)
- Table 87 South Korea Anti-Money Laundering market, by end use, 2018 - 2030 (USD Million)
- Table 88 Australia Anti-Money Laundering market, by component, 2018 - 2030 (USD Million)
- Table 89 Australia Anti-Money Laundering market, by product, 2018 - 2030 (USD Million)
- Table 90 Australia Anti-Money Laundering market, by deployment, 2018 - 2030 (USD Million)
- Table 91 Australia Anti-Money Laundering market, by enterprise size, 2018 - 2030 (USD Million)
- Table 92 Australia Anti-Money Laundering market, by end use, 2018 - 2030 (USD Million)
- Table 93 Latin America Anti-Money Laundering market, by component, 2018 - 2030 (USD Million)
- Table 94 Latin America Anti-Money Laundering market, by product, 2018 - 2030 (USD Million)
- Table 95 Latin America Anti-Money Laundering market, by deployment, 2018 - 2030 (USD Million)
- Table 96 Latin America Anti-Money Laundering market, by enterprise size, 2018 - 2030 (USD Million)
- Table 97 Latin America Anti-Money Laundering market, by end use, 2018 - 2030 (USD Million)
- Table 98 Brazil Anti-Money Laundering market, by component, 2018 - 2030 (USD Million)
- Table 99 Brazil Anti-Money Laundering market, by product, 2018 - 2030 (USD Million)
- Table 100 Brazil Anti-Money Laundering market, by deployment, 2018 - 2030 (USD Million)
- Table 101 Brazil Anti-Money Laundering market, by enterprise size, 2018 - 2030 (USD Million)
- Table 102 Brazil Anti-Money Laundering market, by end use, 2018 - 2030 (USD Million)
- Table 103 Middle East & Africa Anti-Money Laundering market, by component, 2018 - 2030 (USD Million)
- Table 104 Middle East & Africa Anti-Money Laundering market, by product, 2018 - 2030 (USD Million)
- Table 105 Middle East & Africa Anti-Money Laundering market, by deployment, 2018 - 2030 (USD Million)
- Table 106 Middle East & Africa Anti-Money Laundering market, by enterprise size, 2018 - 2030 (USD Million)
- Table 107 Middle East & Africa Anti-Money Laundering market, by end use, 2018 - 2030 (USD Million)
- Table 108 Kingdom of Saudi Arabia (KSA) Anti-Money Laundering market, by component, 2018 - 2030 (USD Million)
- Table 109 Kingdom of Saudi Arabia (KSA) Anti-Money Laundering market, by product, 2018 - 2030 (USD Million)
- Table 110 Kingdom of Saudi Arabia (KSA) Anti-Money Laundering market, by deployment, 2018 - 2030 (USD Million)
- Table 111 Kingdom of Saudi Arabia (KSA) Anti-Money Laundering market, by enterprise size, 2018 - 2030 (USD Million)
- Table 112 Kingdom of Saudi Arabia (KSA) Anti-Money Laundering market, by end use, 2018 - 2030 (USD Million)
- Table 113 UAE Anti-Money Laundering market, by component, 2018 - 2030 (USD Million)
- Table 114 UAE Anti-Money Laundering market, by product, 2018 - 2030 (USD Million)
- Table 115 UAE Anti-Money Laundering market, by deployment, 2018 - 2030 (USD Million)
- Table 116 UAE Anti-Money Laundering market, by enterprise size, 2018 - 2030 (USD Million)
- Table 117 UAE Anti-Money Laundering market, by end use, 2018 - 2030 (USD Million)
- Table 118 South Africa Anti-Money Laundering market, by component, 2018 - 2030 (USD Million)
- Table 119 South Africa Anti-Money Laundering market, by product, 2018 - 2030 (USD Million)
- Table 120 South Africa Anti-Money Laundering market, by deployment, 2018 - 2030 (USD Million)
- Table 121 South Africa Anti-Money Laundering market, by enterprise size, 2018 - 2030 (USD Million)
- Table 122S outh Africa Anti-Money Laundering market, by end use, 2018 - 2030 (USD Million)
- Table 123 Company Market Share, 2024
- Table 124 Company Heat Map Analysis
- Table 125 Key Companies undergoing partnerships, collaborations, & agreements
- Table 126 Key Companies launching new products
List of Figures
- Fig. 1 Anti-money laundering market segmentation
- Fig. 2 Information procurement
- Fig. 3 Data analysis models
- Fig. 4 Market formulation and validation
- Fig. 5 Data validating & publishing
- Fig. 6 Market snapshot
- Fig. 7 Segment snapshot
- Fig. 8 Competitive landscape snapshot
- Fig. 9 Parent Market Value, 2024 (USD Million)
- Fig. 10 Anti-money laundering market - Industry value chain analysis
- Fig. 11 Anti-money laundering market dynamics
- Fig. 12 Anti-money laundering market: Porter's analysis
- Fig. 13 Anti-money laundering market: PESTEL analysis
- Fig. 14 Anti-money laundering market, by component: key takeaways
- Fig. 15 Anti-money laundering market, by component: market share, 2024 & 2030
- Fig. 16 Anti-money laundering market estimates & forecasts, by software, 2018 - 2030 (USD Million)
- Fig. 17 Anti-money laundering market estimates & forecasts, by services, 2018 - 2030 (USD Million)
- Fig. 18 Anti-money laundering market, by product: key takeaways
- Fig. 19 Anti-money laundering market, by product: market share, 2024 & 2030
- Fig. 20 Anti-money laundering market estimates & forecasts, by compliance management, 2018 - 2030 (USD Million)
- Fig. 21 Anti-money laundering market estimates & forecasts, by currency transaction reporting, 2018 - 2030 (USD Million)
- Fig. 22 Anti-money laundering market estimates & forecasts, by customer identity management, 2018 - 2030 (USD Million)
- Fig. 23 Anti-money laundering market estimates & forecasts, by transaction monitoring, 2018 - 2030 (USD Million)
- Fig. 24 Anti-money laundering market, by deployment: key takeaways
- Fig. 25 Anti-money laundering market, by deployment: market share, 2024 & 2030
- Fig. 26 Anti-money laundering market estimates & forecasts, by cloud, 2018 - 2030 (USD Million)
- Fig. 27 Anti-money laundering market estimates & forecasts, by on-premise, 2018 - 2030 (USD Million)
- Fig. 28 Anti-money laundering market, by enterprise size: key takeaways
- Fig. 29 Anti-money laundering market, by enterprise size: market share, 2024 & 2030
- Fig. 30 Anti-money laundering market estimates & forecasts, by large enterprises, 2018 - 2030 (USD Million)
- Fig. 31 Anti-money laundering market estimates & forecasts, by small & medium enterprises, 2018 - 2030 (USD Million)
- Fig. 32 Anti-money laundering market, by end use: key takeaways
- Fig. 33 Anti-money laundering market, by end use: market share, 2024 & 2030
- Fig. 34 Anti-money laundering market estimates & forecasts, by BFSI, 2018 - 2030 (USD Million)
- Fig. 35 Anti-money laundering market estimates & forecasts, by government, 2018 - 2030 (USD Million)
- Fig. 36 Anti-money laundering market estimates & forecasts, by healthcare, 2018 - 2030 (USD Million)
- Fig. 37 Anti-money laundering market estimates & forecasts, by IT & Telecom, 2018 - 2030 (USD Million)
- Fig. 38 Anti-money laundering market estimates & forecasts, by others, 2018 - 2030 (USD Million)
- Fig. 39 Anti-money laundering market revenue, by region, 2024 & 2030 (USD Million)
- Fig. 40 Regional marketplace: key takeaways
- Fig. 41 North America anti-money laundering market estimates & forecasts, 2018 - 2030 (USD Million)
- Fig. 42 U.S. anti-money laundering market estimates & forecasts, 2018 - 2030 (USD Million)
- Fig. 43 Canada anti-money laundering market estimates & forecasts, 2018 - 2030 (USD Million)
- Fig. 44 Mexico anti-money laundering market estimates & forecasts, 2018 - 2030 (USD Million)
- Fig. 45 Europe anti-money laundering market estimates & forecasts, 2018 - 2030 (USD Million)
- Fig. 46 UK anti-money laundering market estimates & forecasts, 2018 - 2030 (USD Million)
- Fig. 47 Germany anti-money laundering market estimates & forecasts, 2018 - 2030 (USD Million)
- Fig. 48 France anti-money laundering market estimates & forecasts, 2018 - 2030 (USD Million)
- Fig. 49 Asia Pacific anti-money laundering market estimates & forecasts, 2018 - 2030 (USD Million)
- Fig. 50 China anti-money laundering market estimates & forecasts, 2018 - 2030 (USD Million)
- Fig. 51 India anti-money laundering market estimates & forecasts, 2018 - 2030 (USD Million)
- Fig. 52 Japan anti-money laundering market estimates & forecasts, 2018 - 2030 (USD Million)
- Fig. 53 South Korea anti-money laundering market estimates & forecasts, 2018 - 2030 (USD Million)
- Fig. 54 Australia anti-money laundering market estimates & forecasts, 2018 - 2030 (USD Million)
- Fig. 55 Latin America anti-money laundering market estimates & forecasts, 2018 - 2030 (USD Million)
- Fig. 56 Brazil anti-money laundering market estimates & forecasts, 2018 - 2030 (USD Million)
- Fig. 57 Middle East & Africa anti-money laundering market estimates & forecasts, 2018 - 2030 (USD Million)
- Fig. 58 Kingdom of Saudi Arabia (KSA) anti-money laundering market estimates & forecasts, 2018 - 2030 (USD Million)
- Fig. 59 UAE anti-money laundering market estimates & forecasts, 2018 - 2030 (USD Million)
- Fig. 60 South Africa anti-money laundering market estimates & forecasts, 2018 - 2030 (USD Million)
- Fig. 61 Key company categorization
- Fig. 62 Company market positioning
- Fig. 63 Company market share analysis, 2023
- Fig. 64 Strategic framework
Anti-money Laundering Market Growth & Trends:
The global anti-money laundering market size is expected to reach USD 4.24 billion in 2030 and is projected to grow at a CAGR of 16.2% from 2025 to 2030. The growing adoption of digital and mobile payments is driving the anti-money laundering market. The rise of e-commerce and mobile payments has created new possibilities for cybercriminals to launder money and finance terrorism. AML solutions need to be able to monitor and detect suspicious activity in these channels. This has led to the development of new anti-money laundering market solutions specifically designed for digital and mobile payments.
Moreover, the need for collaboration and information sharing between financial institutions and regulators is driving the anti-money laundering market growth. Financial crime is a global problem, and cybercriminals often operate across borders. Effective AML solutions require the cooperation of financial institutions and regulators across jurisdictions. This has led to the development of new information-sharing platforms and the adoption of common standards for anti-money laundering market compliance.
To combat money laundering and terrorism funding, government bodies worldwide have implemented laws and regulations. The Financial Action Task Force, an inter-governmental organization, supports countries in updating and establishing anti-money laundering laws. Since anti-money laundering laws differ from country to country, financial institutions need to comply with country-specific policies to avoid any legal issues. Adhering to these policies, financial institutions can establish a structured set of procedures to prevent unlawful funds from infiltrating their financial systems.
The COVID-19 pandemic has had a positive impact on anti-money laundering market. The pandemic has led to an increase in online transactions, which has created new opportunities for fraud and financial crime. AML solutions can help financial institutions monitor and detect fraudulent transactions in real-time, reducing the risk of financial crime during these uncertain times.
Anti-money Laundering Market Report Highlights:
- The software segment led the market and accounted for 63.0% of the global revenue in 2024
- The transaction monitoring segment accounted for the largest market revenue share in 2024. The growth attributed to the rising financial crimes, which necessitates advanced monitoring systems capable of analyzing vast volumes of transactions in real-time
- The on-premise segment accounted for the largest market revenue share in 2024. The on-premise segment of the anti-money laundering market remains crucial for organizations that prioritize control and security over their compliance systems
- The large enterprises segment accounted for the largest market revenue share in 2024
- The BFSI segment accounted for the largest market revenue share in 2024
Table of Contents
Chapter 1. Methodology and Scope
- 1.1. Market Segmentation & Scope
- 1.2. Market Definitions
- 1.3. Research Methodology
- 1.3.1. Information Procurement
- 1.3.2. Information or Data Analysis
- 1.3.3. Market Formulation & Data Visualization
- 1.3.4. Data Validation & Publishing
- 1.4. Research Scope and Assumptions
- 1.4.1. List of Data Sources
Chapter 2. Executive Summary
- 2.1. Market Outlook
- 2.2. Segmental Outlook
- 2.3. Competitive Landscape Snapshot
Chapter 3. Market Variables, Trends, and Scope
- 3.1. Market Introduction/Lineage Outlook
- 3.2. Industry Value Chain Analysis
- 3.3. Market Dynamics
- 3.3.1. Market Driver Impact Analysis
- 3.3.2. Market Challenge Impact Analysis
- 3.3.3. Market Opportunity Impact Analysis
- 3.4. Anti-Money Laundering Market Analysis Tools
- 3.4.1. Porter's Analysis
- 3.4.1.1. Bargaining power of the suppliers
- 3.4.1.2. Bargaining power of the buyers
- 3.4.1.3. Threats of substitution
- 3.4.1.4. Threats from new entrants
- 3.4.1.5. Competitive rivalry
- 3.4.2. PESTEL Analysis
- 3.4.2.1. Political landscape
- 3.4.2.2. Economic and Social landscape
- 3.4.2.3. Technological landscape
- 3.4.2.4. Environmental landscape
- 3.4.2.5. Legal landscape
- 3.4.1. Porter's Analysis
Chapter 4. Anti-money Laundering Market: Component Estimates & Trend Analysis
- 4.1. Component Movement Analysis & Market Share, 2024 & 2030
- 4.2. Anti-money Laundering Market Estimates & Forecast, By Component
- 4.3. Software
- 4.3.1. Software Market Revenue Estimates and Forecasts, 2018 - 2030 (USD Million)
- 4.4. Services
- 4.4.1. Services Market Revenue Estimates and Forecasts, 2018 - 2030 (USD Million)
Chapter 5. Anti-money Laundering Market: Product Estimates & Trend Analysis
- 5.1. Product Movement Analysis & Market Share, 2024 & 2030
- 5.2. Anti-money Laundering Market Estimates & Forecast, By Product
- 5.3. Compliance Management
- 5.3.1. Compliance Management Market Revenue Estimates and Forecasts, 2018 - 2030 (USD Million)
- 5.4. Currency Transaction Reporting
- 5.4.1. Currency Transaction Reporting Market Revenue Estimates and Forecasts, 2018 - 2030 (USD Million)
- 5.5. Customer Identity Management
- 5.5.1. Customer Identity Management Market Revenue Estimates and Forecasts, 2018 - 2030 (USD Million)
- 5.6. Transaction Monitoring
- 5.6.1. Transaction Monitoring Market Revenue Estimates and Forecasts, 2018 - 2030 (USD Million)
Chapter 6. Anti-money Laundering Market: Deployment Estimates & Trend Analysis
- 6.1. Deployment Movement Analysis & Market Share, 2024 & 2030
- 6.2. Anti-money Laundering Market Estimates & Forecast, By Deployment
- 6.3. Cloud
- 6.3.1. Cloud Market Revenue Estimates and Forecasts, 2018 - 2030 (USD Million)
- 6.4. On-premise
- 6.4.1. On-premise Market Revenue Estimates and Forecasts, 2018 - 2030 (USD Million)
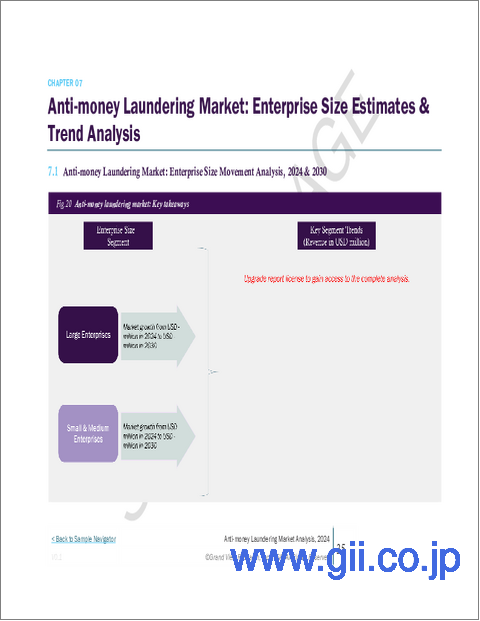
Chapter 7. Anti-money Laundering Market: Enterprise Size Estimates & Trend Analysis
- 7.1. Enterprise Size Movement Analysis & Market Share, 2024 & 2030
- 7.2. Anti-money Laundering Market Estimates & Forecast, By Enterprise Size
- 7.3. Large Enterprises
- 7.3.1. Large Enterprises Market Revenue Estimates and Forecasts, 2018 - 2030 (USD Million)
- 7.4. Small & Medium Enterprises
- 7.4.1. Small & Medium Enterprises Market Revenue Estimates and Forecasts, 2018 - 2030 (USD Million)
Chapter 8. Anti-money Laundering Market: End Use Estimates & Trend Analysis
- 8.1. End Use Movement Analysis & Market Share, 2024 & 2030
- 8.2. Anti-money Laundering Market Estimates & Forecast, By End Use
- 8.3. BFSI
- 8.3.1. BFSI Market Revenue Estimates and Forecasts, 2018 - 2030 (USD Million)
- 8.4. Government
- 8.4.1. Government Market Revenue Estimates and Forecasts, 2018 - 2030 (USD Million)
- 8.5. Healthcare
- 8.5.1. Healthcare Market Revenue Estimates and Forecasts, 2018 - 2030 (USD Million)
- 8.6. IT & Telecom
- 8.6.1. IT & Telecom Market Revenue Estimates and Forecasts, 2018 - 2030 (USD Million)
- 8.7. Others
- 8.7.1. Others Market Revenue Estimates and Forecasts, 2018 - 2030 (USD Million)
Chapter 9. Anti-Money Laundering Market: Regional Estimates & Trend Analysis
- 9.1. Anti-Money Laundering Market Share, By Region, 2024 & 2030 (USD Million)
- 9.2. North America
- 9.2.1. North America Anti-Money Laundering Market estimates & forecasts, 2018 - 2030 (USD Million)
- 9.2.2. U.S.
- 9.2.2.1. U.S. Anti-Money Laundering Market estimates & forecasts, 2018 - 2030 (USD Million)
- 9.2.3. Canada
- 9.2.3.1. Canada Anti-Money Laundering Market estimates & forecasts, 2018 - 2030 (USD Million)
- 9.2.4. Mexico
- 9.2.4.1. Mexico Anti-Money Laundering Market estimates & forecasts, 2018 - 2030 (USD Million)
- 9.3. Europe
- 9.3.1. Europe Anti-Money Laundering Market estimates & forecasts, 2018 - 2030 (USD Million)
- 9.3.2. U.K.
- 9.3.2.1. U.K. Anti-Money Laundering Market estimates & forecasts, 2018 - 2030 (USD Million)
- 9.3.3. Germany
- 9.3.3.1. Germany Anti-Money Laundering Market estimates & forecasts, 2018 - 2030 (USD Million)
- 9.3.4. France
- 9.3.4.1. France Anti-Money Laundering Market estimates & forecasts, 2018 - 2030 (USD Million)
- 9.4. Asia Pacific
- 9.4.1. Asia Pacific Anti-Money Laundering Market estimates & forecasts, 2018 - 2030 (USD Million)
- 9.4.2. China
- 9.4.2.1. China Anti-Money Laundering Market estimates & forecasts, 2018 - 2030 (USD Million)
- 9.4.3. India
- 9.4.3.1. India Anti-Money Laundering Market estimates & forecasts, 2018 - 2030 (USD Million)
- 9.4.4. Japan
- 9.4.4.1. Japan Anti-Money Laundering Market estimates & forecasts, 2018 - 2030 (USD Million)
- 9.4.5. South Korea
- 9.4.5.1. South Korea Anti-Money Laundering Market estimates & forecasts, 2018 - 2030 (USD Million)
- 9.4.6. Australia
- 9.4.6.1. Australia Anti-Money Laundering Market estimates & forecasts, 2018 - 2030 (USD Million)
- 9.5. Latin America
- 9.5.1. Latin America Anti-Money Laundering Market estimates & forecasts, 2018 - 2030 (USD Million)
- 9.5.2. Brazil
- 9.5.2.1. Brazil Anti-Money Laundering Market estimates & forecasts, 2018 - 2030 (USD Million)
- 9.6. Middle East & Africa
- 9.6.1. Middle East & Africa Anti-Money Laundering Market estimates & forecasts, 2018 - 2030 (USD Million)
- 9.6.2. The Kingdom of Saudi Arabia (KSA)
- 9.6.2.1. The Kingdom of Saudi Arabia (KSA) Anti-Money Laundering Market estimates & forecasts, 2018 - 2030 (USD Million)
- 9.6.3. UAE
- 9.6.3.1. UAE Anti-Money Laundering Market estimates & forecasts, 2018 - 2030 (USD Million)
- 9.6.4. South Africa
- 9.6.4.1. South Africa Anti-Money Laundering Market estimates & forecasts, 2018 - 2030 (USD Million)
Chapter 10. Competitive Landscape
- 10.1. Recent Developments & Impact Analysis by Key Market Participants
- 10.2. Company Categorization
- 10.3. Company Market Positioning
- 10.4. Company Market Share Analysis
- 10.5. Company Heat Map Analysis
- 10.6. Strategy Mapping
- 10.6.1. Expansion
- 10.6.2. Mergers & Acquisition
- 10.6.3. Partnerships & Collaborations
- 10.6.4. New Product Launches
- 10.6.5. Research And Development
- 10.7. Company Profiles
- 10.7.1. NICE Actimize
- 10.7.1.1. Participant's Overview
- 10.7.1.2. Financial Performance
- 10.7.1.3. Product Benchmarking
- 10.7.1.4. Recent Developments
- 10.7.2. Tata Consultancy Services Limited
- 10.7.2.1. Participant's Overview
- 10.7.2.2. Financial Performance
- 10.7.2.3. Product Benchmarking
- 10.7.2.4. Recent Developments
- 10.7.3. Cognizant Technology Solutions Corporation
- 10.7.3.1. Participant's Overview
- 10.7.3.2. Financial Performance
- 10.7.3.3. Product Benchmarking
- 10.7.3.4. Recent Developments
- 10.7.4. ACI Worldwide, Inc.
- 10.7.4.1. Participant's Overview
- 10.7.4.2. Financial Performance
- 10.7.4.3. Product Benchmarking
- 10.7.4.4. Recent Developments
- 10.7.5. SAS Institute, Inc.
- 10.7.5.1. Participant's Overview
- 10.7.5.2. Financial Performance
- 10.7.5.3. Product Benchmarking
- 10.7.5.4. Recent Developments
- 10.7.6. Fiserv, Inc.
- 10.7.6.1. Participant's Overview
- 10.7.6.2. Financial Performance
- 10.7.6.3. Product Benchmarking
- 10.7.6.4. Recent Developments
- 10.7.7. Oracle Corporation
- 10.7.7.1. Participant's Overview
- 10.7.7.2. Financial Performance
- 10.7.7.3. Product Benchmarking
- 10.7.7.4. Recent Developments
- 10.7.8. BAE Systems
- 10.7.8.1. Participant's Overview
- 10.7.8.2. Financial Performance
- 10.7.8.3. Product Benchmarking
- 10.7.8.4. Recent Developments
- 10.7.9. Accenture
- 10.7.9.1. Participant's Overview
- 10.7.9.2. Financial Performance
- 10.7.9.3. Product Benchmarking
- 10.7.9.4. Recent Developments
- 10.7.10. Open Text Corporation
- 10.7.10.1. Participant's Overview
- 10.7.10.2. Financial Performance
- 10.7.10.3. Product Benchmarking
- 10.7.10.4. Recent Developments
- 10.7.11. Experian Information Solutions, Inc.
- 10.7.11.1. Participant's Overview
- 10.7.11.2. Financial Performance
- 10.7.11.3. Product Benchmarking
- 10.7.11.4. Recent Developments
- 10.7.1. NICE Actimize

