|
|
市場調査レポート
商品コード
1631159
神経内分泌腫瘍治療市場規模、シェア、動向分析レポート:タイプ別、製品別、部位別、最終用途別、地域別、セグメント別予測、2025年~2030年Neuroendocrine Tumor Treatment Market Size, Share & Trends Analysis Report By Type (Meningiomas, Adrenal Cancer, Carcinoid Tumors, Paraganglioma), By Product, By Site, By End Use, By Region, And Segment Forecasts, 2025 - 2030 |
||||||

|
|||||||
カスタマイズ可能
|
|||||||

| 神経内分泌腫瘍治療市場規模、シェア、動向分析レポート:タイプ別、製品別、部位別、最終用途別、地域別、セグメント別予測、2025年~2030年 |
|
出版日: 2024年12月11日
発行: Grand View Research
ページ情報: 英文 100 Pages
納期: 2~10営業日
|

全表示
- 概要
- 図表
- 目次
神経内分泌腫瘍治療市場の成長と動向
Grand View Research, Inc.の最新レポートによると、世界の神経内分泌腫瘍治療市場規模は2030年までに37億3,000万米ドルに達する見込みです。
同市場は2025~2030年にかけてCAGR 6.0%を記録すると推定されています。カルチノイド腫瘍の蔓延性の増加が予測期間中の市場を牽引すると予想されます。新製品を開発するためにさまざまな製薬企業が臨床検査に多額の投資を行っていることも、市場開拓を後押しする要因のひとつです。
例えば、Novartis AGの臨床検査数が最も多く、Pfizer Inc.やIpsen Pharmaがこれに続きます。さらに、神経内分泌腫瘍を治療するための治療法の技術的進歩は、今後数年間の市場成長を促進すると予想されています。その中には、Ga標識ソマトスタチンによるPETイメージング、標的薬剤療法、チロシンキナーゼ療法などが含まれます。例えば、Novartis AGのLutatheraは、史上初の放射性ヌクレオチド療法としてFDAの承認を受けた。
神経内分泌腫瘍治療市場レポートハイライト
- カルチノイド腫瘍の有病率の増加と治療手法の進歩が牽引し、2024年の売上高シェアはカルチノイド腫瘍セグメントが24.3%で市場を独占しました。
- ソマトスタチン類似体(SSAs)セグメントは、神経内分泌腫瘍に関連する症状の管理に有効であることが証明されたため、2024年の売上高シェアで市場を独占しました。
- 小腸セグメントは2024年に最大の収益シェアを占め、市場を独占しました。
- 病院セグメントは、神経内分泌腫瘍の複雑な症例に対して病院が提供する包括的なケアに牽引され、2024年に最大の収益シェアで市場を独占しました。
- 北米の神経内分泌腫瘍治療市場は、2024年に42.1%の収益シェアで世界市場を独占しました。
目次
第1章 調査手法と範囲
第2章 エグゼクティブサマリー
第3章 神経内分泌腫瘍治療市場の変数、動向、範囲
- 市場系統の展望
- 市場力学
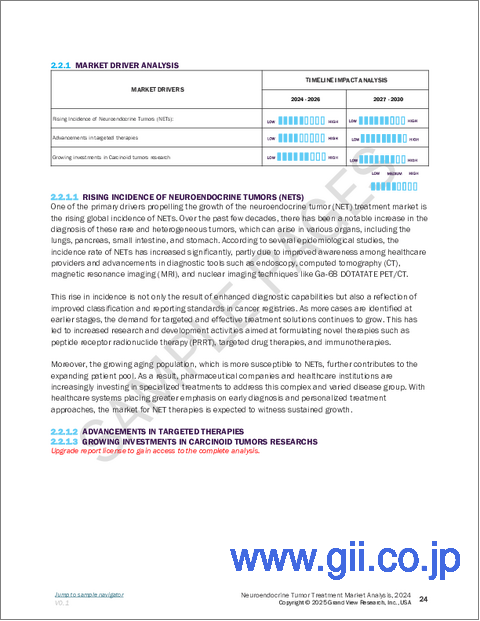
- 市場促進要因分析
- 市場抑制要因分析
- ビジネス環境分析
- 産業分析-ポーターのファイブフォース分析
- PESTLE分析
第4章 神経内分泌腫瘍治療市場:タイプ別ビジネス分析
- タイプ市場シェア、2024年と2030年
- タイプセグメントダッシュボード
- 市場規模と予測と動向分析、タイプ別、2018~2030年
- 髄膜腫
- 副腎がん
- カルチノイド腫瘍
- 傍神経節腫
- 褐色細胞腫
- その他
第5章 神経内分泌腫瘍治療市場:製品ビジネス分析
- 製品市場シェア、2024年と2030年
- 製品セグメントダッシュボード
- 市場規模と予測と動向分析、製品別、2018~2030年
- ソマトスタチン類似体(SSA)
- 標的療法
- その他
第6章 神経内分泌腫瘍治療市場:部位ビジネス分析
- 部位市場シェア、2024年と2030年
- 部位セグメントダッシュボード
- 市場規模と予測と動向分析、部位別、2018~2030年
- 肺
- 膵臓
- 結腸
- 小腸
- 直腸
- 胃
- その他
第7章 神経内分泌腫瘍治療市場:最終用途ビジネス分析
- 最終用途市場シェア、2024年と2030年
- 最終用途セグメントダッシュボード
- 市場規模と予測と動向分析、最終用途別、2018~2030年
- 病院
- クリニック
- その他
第8章 神経内分泌腫瘍治療市場:地域別、推定・動向分析
- 地域別市場シェア分析、2024年と2030年
- 地域別市場ダッシュボード
- 市場規模と予測動向分析、2018~2030年
- 北米
- 国別、2018~2030年
- 米国
- カナダ
- メキシコ
- 欧州
- 国別、2018~2030年
- 英国
- ドイツ
- フランス
- イタリア
- スペイン
- ノルウェー
- デンマーク
- スウェーデン
- アジア太平洋
- 日本
- 中国
- インド
- 韓国
- オーストラリア
- シンガポール
- ラテンアメリカ
- 国別、2018~2030年
- ブラジル
- アルゼンチン
- 中東・アフリカ
- 国別、2018~2030年
- 南アフリカ
- サウジアラビア
- アラブ首長国連邦
- クウェート
第9章 競合情勢
- 参加者概要
- 企業の市況分析
- 企業分類
- 戦略マッピング
- 企業プロファイル/上場企業
- Novartis AG
- Bristol-Myers Squibb Company
- Pfizer Inc.
- Boehringer Ingelheim International GmbH
- Hutchison MediPharma Limited.
- AVEO Pharmaceuticals, Inc.
- Ipsen Pharma.
- Eli Lilly and Company.
- Exelixis, Inc.
- Jubilant Pharmova Limited
List of Tables
- Table 1 List of secondary sources
- Table 2 List of abbreviations
- Table 3 Global neuroendocrine tumor treatment market, by region, 2018 - 2030 (USD Billion)
- Table 4 Global neuroendocrine tumor treatment market, by type, 2018 - 2030 (USD Billion)
- Table 5 Global neuroendocrine tumor treatment market, by product, 2018 - 2030 (USD Billion)
- Table 6 Global neuroendocrine tumor treatment market, by site, 2018 - 2030 (USD Billion)
- Table 7 Global neuroendocrine tumor treatment market, by end use, 2018 - 2030 (USD Billion)
- Table 8 North America neuroendocrine tumor treatment market, by country, 2018 - 2030 (USD Billion)
- Table 9 North America neuroendocrine tumor treatment market, by type, 2018 - 2030 (USD Billion)
- Table 10 North America neuroendocrine tumor treatment market, by product, 2018 - 2030 (USD Billion)
- Table 11 North America neuroendocrine tumor treatment market, by site, 2018 - 2030 (USD Billion)
- Table 12 North America neuroendocrine tumor treatment market, by end use, 2018 - 2030 (USD Billion)
- Table 13 U.S. neuroendocrine tumor treatment market, by type, 2018 - 2030 (USD Billion)
- Table 14 U.S. neuroendocrine tumor treatment market, by product, 2018 - 2030 (USD Billion)
- Table 15 U.S. neuroendocrine tumor treatment market, by site, 2018 - 2030 (USD Billion)
- Table 16 U.S. neuroendocrine tumor treatment market, by end use, 2018 - 2030 (USD Billion)
- Table 17 Canada neuroendocrine tumor treatment market, by type, 2018 - 2030 (USD Billion)
- Table 18 Canada neuroendocrine tumor treatment market, by product, 2018 - 2030 (USD Billion)
- Table 19 Canada neuroendocrine tumor treatment market, by site, 2018 - 2030 (USD Billion)
- Table 20 Canada neuroendocrine tumor treatment market, by end use, 2018 - 2030 (USD Billion)
- Table 21 Mexico neuroendocrine tumor treatment market, by type, 2018 - 2030 (USD Billion)
- Table 22 Mexico neuroendocrine tumor treatment market, by product, 2018 - 2030 (USD Billion)
- Table 23 Mexico neuroendocrine tumor treatment market, by site, 2018 - 2030 (USD Billion)
- Table 24 Mexico neuroendocrine tumor treatment market, by end use, 2018 - 2030 (USD Billion)
- Table 25 Europe neuroendocrine tumor treatment market, by country, 2018 - 2030 (USD Billion)
- Table 26 Europe neuroendocrine tumor treatment market, by type, 2018 - 2030 (USD Billion)
- Table 27 Europe neuroendocrine tumor treatment market, by product, 2018 - 2030 (USD Billion)
- Table 28 Europe neuroendocrine tumor treatment market, by site, 2018 - 2030 (USD Billion)
- Table 29 Europe neuroendocrine tumor treatment market, by end use, 2018 - 2030 (USD Billion)
- Table 30 UK neuroendocrine tumor treatment market, by type, 2018 - 2030 (USD Billion)
- Table 31 UK neuroendocrine tumor treatment market, by product, 2018 - 2030 (USD Billion)
- Table 32 UK neuroendocrine tumor treatment market, by site, 2018 - 2030 (USD Billion)
- Table 33 UK neuroendocrine tumor treatment market, by end use, 2018 - 2030 (USD Billion)
- Table 34 Germany neuroendocrine tumor treatment market, by type, 2018 - 2030 (USD Billion)
- Table 35 Germany neuroendocrine tumor treatment market, by product, 2018 - 2030 (USD Billion)
- Table 36 Germany neuroendocrine tumor treatment market, by site, 2018 - 2030 (USD Billion)
- Table 37 Germany neuroendocrine tumor treatment market, by end use, 2018 - 2030 (USD Billion)
- Table 38 France neuroendocrine tumor treatment market, by type, 2018 - 2030 (USD Billion)
- Table 39 France neuroendocrine tumor treatment market, by product, 2018 - 2030 (USD Billion)
- Table 40 France neuroendocrine tumor treatment market, by site, 2018 - 2030 (USD Billion)
- Table 41 France neuroendocrine tumor treatment market, by end use, 2018 - 2030 (USD Billion)
- Table 42 Italy neuroendocrine tumor treatment market, by type, 2018 - 2030 (USD Billion)
- Table 43 Italy neuroendocrine tumor treatment market, by product, 2018 - 2030 (USD Billion)
- Table 44 Italy neuroendocrine tumor treatment market, by site, 2018 - 2030 (USD Billion)
- Table 45 Italy neuroendocrine tumor treatment market, by end use, 2018 - 2030 (USD Billion)
- Table 46 Spain neuroendocrine tumor treatment market, by type, 2018 - 2030 (USD Billion)
- Table 47 Spain neuroendocrine tumor treatment market, by product, 2018 - 2030 (USD Billion)
- Table 48 Spain neuroendocrine tumor treatment market, by site, 2018 - 2030 (USD Billion)
- Table 49 Spain neuroendocrine tumor treatment market, by end use, 2018 - 2030 (USD Billion)
- Table 50 Norway neuroendocrine tumor treatment market, by type, 2018 - 2030 (USD Billion)
- Table 51 Norway neuroendocrine tumor treatment market, by product, 2018 - 2030 (USD Billion)
- Table 52 Norway neuroendocrine tumor treatment market, by site, 2018 - 2030 (USD Billion)
- Table 53 Norway neuroendocrine tumor treatment market, by end use, 2018 - 2030 (USD Billion)
- Table 54 Denmark neuroendocrine tumor treatment market, by type, 2018 - 2030 (USD Billion)
- Table 55 Denmark neuroendocrine tumor treatment market, by product, 2018 - 2030 (USD Billion)
- Table 56 Denmark neuroendocrine tumor treatment market, by site, 2018 - 2030 (USD Billion)
- Table 57 Denmark neuroendocrine tumor treatment market, by end use, 2018 - 2030 (USD Billion)
- Table 58 Sweden neuroendocrine tumor treatment market, by type, 2018 - 2030 (USD Billion)
- Table 59 Sweden neuroendocrine tumor treatment market, by product, 2018 - 2030 (USD Billion)
- Table 60 Sweden neuroendocrine tumor treatment market, by site, 2018 - 2030 (USD Billion)
- Table 61 Sweden neuroendocrine tumor treatment market, by end use, 2018 - 2030 (USD Billion)
- Table 62 Asia Pacific neuroendocrine tumor treatment market, by country, 2018 - 2030 (USD Billion)
- Table 63 Asia Pacific neuroendocrine tumor treatment market, by type, 2018 - 2030 (USD Billion)
- Table 64 Asia Pacific neuroendocrine tumor treatment market, by product, 2018 - 2030 (USD Billion)
- Table 65 Asia Pacific neuroendocrine tumor treatment market, by site, 2018 - 2030 (USD Billion)
- Table 66 Asia Pacific neuroendocrine tumor treatment market, by end use, 2018 - 2030 (USD Billion)
- Table 67 Japan neuroendocrine tumor treatment market, by type, 2018 - 2030 (USD Billion)
- Table 68 Japan neuroendocrine tumor treatment market, by product, 2018 - 2030 (USD Billion)
- Table 69 Japan neuroendocrine tumor treatment market, by site, 2018 - 2030 (USD Billion)
- Table 70 Japan neuroendocrine tumor treatment market, by end use, 2018 - 2030 (USD Billion)
- Table 71 China neuroendocrine tumor treatment market, by type, 2018-2030 (USD Billion)
- Table 72 China neuroendocrine tumor treatment market, by product, 2018-2030 (USD Billion)
- Table 73 China neuroendocrine tumor treatment market, by site, 2018-2030 (USD Billion)
- Table 74 China neuroendocrine tumor treatment market, by end use, 2018-2030 (USD Billion)
- Table 75 India neuroendocrine tumor treatment market, by type, 2018 - 2030 (USD Billion)
- Table 76 India neuroendocrine tumor treatment market, by product, 2018 - 2030 (USD Billion)
- Table 77 India neuroendocrine tumor treatment market, by site, 2018 - 2030 (USD Billion)
- Table 78 India neuroendocrine tumor treatment market, by end use, 2018 - 2030 (USD Billion)
- Table 79 Australia neuroendocrine tumor treatment market, by type, 2018 - 2030 (USD Billion)
- Table 80 Australia neuroendocrine tumor treatment market, by product, 2018 - 2030 (USD Billion)
- Table 81 Australia neuroendocrine tumor treatment market, by site, 2018 - 2030 (USD Billion)
- Table 82 Australia neuroendocrine tumor treatment market, by end use, 2018 - 2030 (USD Billion)
- Table 83 South Korea neuroendocrine tumor treatment market, by type, 2018 - 2030 (USD Billion)
- Table 84 South Korea neuroendocrine tumor treatment market, by product, 2018 - 2030 (USD Billion)
- Table 85 South Korea neuroendocrine tumor treatment market, by site, 2018 - 2030 (USD Billion)
- Table 86 South Korea neuroendocrine tumor treatment market, by end use, 2018 - 2030 (USD Billion)
- Table 87 Singapore neuroendocrine tumor treatment market, by type, 2018 - 2030 (USD Billion)
- Table 88 Singapore neuroendocrine tumor treatment market, by product, 2018 - 2030 (USD Billion)
- Table 89 Singapore neuroendocrine tumor treatment market, by site, 2018 - 2030 (USD Billion)
- Table 90 Singapore neuroendocrine tumor treatment market, by end use, 2018 - 2030 (USD Billion)
- Table 91 Latin America neuroendocrine tumor treatment market, by country, 2018 - 2030 (USD Billion)
- Table 92 Latin America neuroendocrine tumor treatment market, by type, 2018 - 2030 (USD Billion)
- Table 93 Latin America neuroendocrine tumor treatment market, by product, 2018 - 2030 (USD Billion
- Table 94 Latin America neuroendocrine tumor treatment market, by site, 2018 - 2030 (USD Billion
- Table 95 Latin America neuroendocrine tumor treatment market, by end use, 2018 - 2030 (USD Billion
- Table 96 Brazil neuroendocrine tumor treatment market, by type, 2018 - 2030 (USD Billion)
- Table 97 Brazil neuroendocrine tumor treatment market, by product, 2018 - 2030 (USD Billion)
- Table 98 Brazil neuroendocrine tumor treatment market, by site, 2018 - 2030 (USD Billion)
- Table 99 Brazil neuroendocrine tumor treatment market, by end use, 2018 - 2030 (USD Billion)
- Table 100 Argentina neuroendocrine tumor treatment market, by type, 2018 - 2030 (USD Billion)
- Table 101 Argentina neuroendocrine tumor treatment market, by product, 2018 - 2030 (USD Billion)
- Table 102 Argentina neuroendocrine tumor treatment market, by site, 2018 - 2030 (USD Billion)
- Table 103 Argentina neuroendocrine tumor treatment market, by end use, 2018 - 2030 (USD Billion)
- Table 104 Middle East & Africa neuroendocrine tumor treatment market, by country, 2018 - 2030 (USD Billion)
- Table 105 Middle East & Africa neuroendocrine tumor treatment market, by type, 2018 - 2030 (USD Billion)
- Table 106 Middle East & Africa neuroendocrine tumor treatment market, by product, 2018 - 2030 (USD Billion)
- Table 107 Middle East & Africa neuroendocrine tumor treatment market, by site, 2018 - 2030 (USD Billion)
- Table 108 Middle East & Africa neuroendocrine tumor treatment market, by end use, 2018 - 2030 (USD Billion)
- Table 109 South Africa neuroendocrine tumor treatment market, by type, 2018 - 2030 (USD Billion)
- Table 110 South Africa neuroendocrine tumor treatment market, by product, 2018 - 2030 (USD Billion)
- Table 111 South Africa neuroendocrine tumor treatment market, by site, 2018 - 2030 (USD Billion)
- Table 112 South Africa neuroendocrine tumor treatment market, by end use, 2018 - 2030 (USD Billion)
- Table 113 Saudi Arabia neuroendocrine tumor treatment market, by type, 2018 - 2030 (USD Billion)
- Table 114 Saudi Arabia neuroendocrine tumor treatment market, by product, 2018 - 2030 (USD Billion)
- Table 115 Saudi Arabia neuroendocrine tumor treatment market, by site, 2018 - 2030 (USD Billion)
- Table 116 Saudi Arabia neuroendocrine tumor treatment market, by end use, 2018 - 2030 (USD Billion)
- Table 117 UAE neuroendocrine tumor treatment market, by type, 2018 - 2030 (USD Billion)
- Table 118 UAE neuroendocrine tumor treatment market, by product, 2018 - 2030 (USD Billion)
- Table 119 UAE neuroendocrine tumor treatment market, by site, 2018 - 2030 (USD Billion)
- Table 120 UAE neuroendocrine tumor treatment market, by end use, 2018 - 2030 (USD Billion)
- Table 121 Kuwait neuroendocrine tumor treatment market, by type, 2018 - 2030 (USD Billion)
- Table 122 Kuwait neuroendocrine tumor treatment market, by product, 2018 - 2030 (USD Billion)
- Table 123 Kuwait neuroendocrine tumor treatment market, by site, 2018 - 2030 (USD Billion)
- Table 124 Kuwait neuroendocrine tumor treatment market, by end use, 2018 - 2030 (USD Billion)
List of Figures
- Fig. 1 Neuroendocrine tumor treatment market segmentation
- Fig. 2 Market research process
- Fig. 3 Data triangulation techniques
- Fig. 4 Primary research pattern
- Fig. 5 Market research approaches
- Fig. 6 Value-chain-based sizing & forecasting
- Fig. 7 Market formulation & validation
- Fig. 8 Market snapshot
- Fig. 9 Type outlook (USD Billion)
- Fig. 10 Product outlook (USD Billion)
- Fig. 11 Site outlook (USD Billion)
- Fig. 12 End Use outlook (USD Billion)
- Fig. 13 Competitive landscape
- Fig. 14 Neuroendocrine tumor treatment market dynamics
- Fig. 15 Neuroendocrine tumor treatment market: Porter's five forces analysis
- Fig. 16 Neuroendocrine tumor treatment market: PESTLE analysis
- Fig. 17 Neuroendocrine tumor treatment market: Type segment dashboard
- Fig. 18 Neuroendocrine tumor treatment market: Type market share analysis, 2024 & 2030
- Fig. 19 Meningiomas market, 2018 - 2030 (USD Billion)
- Fig. 20 Adrenal Cancer market, 2018 - 2030 (USD Billion)
- Fig. 21 Carcinoid Tumors market, 2018 - 2030 (USD Billion)
- Fig. 22 Paraganglioma market, 2018 - 2030 (USD Billion)
- Fig. 23 Pheochromocytoma market, 2018 - 2030 (USD Billion)
- Fig. 24 Others market, 2018 - 2030 (USD Billion)
- Fig. 25 Neuroendocrine tumor treatment market: Product segment dashboard
- Fig. 26 Neuroendocrine tumor treatment market: Product market share analysis, 2024 & 2030
- Fig. 27 Somatostatin analogs (SSAs) market, 2018 - 2030 (USD Billion)
- Fig. 28 Targeted therapy market, 2018 - 2030 (USD Billion)
- Fig. 29 Others market, 2018 - 2030 (USD Billion)
- Fig. 30 Neuroendocrine tumor treatment market: Site segment dashboard
- Fig. 31 Neuroendocrine tumor treatment market: Site market share analysis, 2024 & 2030
- Fig. 32 Lung market, 2018 - 2030 (USD Billion)
- Fig. 33 Pancreas market, 2018 - 2030 (USD Billion)
- Fig. 34 Colon market, 2018 - 2030 (USD Billion)
- Fig. 35 Small Intestine market, 2018 - 2030 (USD Billion)
- Fig. 36 Rectum market, 2018 - 2030 (USD Billion)
- Fig. 37 Stomach market, 2018 - 2030 (USD Billion)
- Fig. 38 Others market, 2018 - 2030 (USD Billion)
- Fig. 39 Neuroendocrine tumor treatment market revenue, by region
- Fig. 40 Regional marketplace: Key takeaways
- Fig. 41 North America neuroendocrine tumor treatment market, 2018 - 2030 (USD Billion)
- Fig. 42 U.S. country dynamics
- Fig. 43 U.S. neuroendocrine tumor treatment market, 2018 - 2030 (USD Billion)
- Fig. 44 Canada country dynamics
- Fig. 45 Canada neuroendocrine tumor treatment market, 2018 - 2030 (USD Billion)
- Fig. 46 Mexico country dynamics
- Fig. 47 Mexico neuroendocrine tumor treatment market, 2018 - 2030 (USD Billion)
- Fig. 48 Europe neuroendocrine tumor treatment market, 2018 - 2030 (USD Billion)
- Fig. 49 UK country dynamics
- Fig. 50 UK neuroendocrine tumor treatment market, 2018 - 2030 (USD Billion)
- Fig. 51 Germany country dynamics
- Fig. 52 Germany neuroendocrine tumor treatment market, 2018 - 2030 (USD Billion)
- Fig. 53 France country dynamics
- Fig. 54 France neuroendocrine tumor treatment market, 2018 - 2030 (USD Billion)
- Fig. 55 Italy country dynamics
- Fig. 56 Italy neuroendocrine tumor treatment market, 2018 - 2030 (USD Billion)
- Fig. 57 Spain country dynamics
- Fig. 58 Spain neuroendocrine tumor treatment market, 2018 - 2030 (USD Billion)
- Fig. 59 Norway country dynamics
- Fig. 60 Norway neuroendocrine tumor treatment market, 2018 - 2030 (USD Billion)
- Fig. 61 Denmark country dynamics
- Fig. 62 Denmark neuroendocrine tumor treatment market, 2018 - 2030 (USD Billion
- Fig. 63 Sweden country dynamics
- Fig. 64 Sweden neuroendocrine tumor treatment market, 2018 - 2030 (USD Billion)
- Fig. 65 Asia Pacific neuroendocrine tumor treatment market, 2018 - 2030 (USD Billion)
- Fig. 66 Japan country dynamics
- Fig. 67 Japan neuroendocrine tumor treatment market, 2018 - 2030 (USD Billion)
- Fig. 68 China country dynamics
- Fig. 69 China neuroendocrine tumor treatment market, 2018 - 2030 (USD Billion)
- Fig. 70 India country dynamics
- Fig. 71 India neuroendocrine tumor treatment market, 2018 - 2030 (USD Billion)
- Fig. 72 South Korea country dynamics
- Fig. 73 South Korea neuroendocrine tumor treatment market, 2018 - 2030 (USD Billion)
- Fig. 74 Australia country dynamics
- Fig. 75 Australia neuroendocrine tumor treatment market, 2018 - 2030 (USD Billion)
- Fig. 76 Singapore country dynamics
- Fig. 77 Singapore neuroendocrine tumor treatment market, 2018 - 2030 (USD Billion)
- Fig. 78 Latin America neuroendocrine tumor treatment market, 2018 - 2030 (USD Billion)
- Fig. 79 Brazil country dynamics
- Fig. 80 Brazil neuroendocrine tumor treatment market, 2018 - 2030 (USD Billion)
- Fig. 81 Argentina country dynamics
- Fig. 82 Argentina neuroendocrine tumor treatment market, 2018 - 2030 (USD Billion)
- Fig. 83 MEA neuroendocrine tumor treatment market, 2018 - 2030 (USD Billion)
- Fig. 84 South Africa country dynamics
- Fig. 85 South Africa neuroendocrine tumor treatment market, 2018 - 2030 (USD Billion)
- Fig. 86 Saudi Arabia country dynamics
- Fig. 87 Saudi Arabia neuroendocrine tumor treatment market, 2018 - 2030 (USD Billion)
- Fig. 88 UAE country dynamics
- Fig. 89 UAE neuroendocrine tumor treatment market, 2018 - 2030 (USD Billion)
- Fig. 90 Kuwait country dynamics
- Fig. 91 Kuwait neuroendocrine tumor treatment market, 2018 - 2030 (USD Billion)
- Fig. 92 Company categorization
- Fig. 93 Company market position analysis
- Fig. 94 Strategic framework
Neuroendocrine Tumor Treatment Market Growth & Trends:
The global neuroendocrine tumor treatment market size is expected to reach USD 3.73 billion by 2030, according to a new report by Grand View Research, Inc. The market is estimated to register a CAGR of 6.0% from 2025 to 2030. Increasing pervasiveness of carcinoid tumors is expected to drive the market over the forecast period. Heavy investment in clinical trials by various pharmaceutical companies to develop novel products is another factor propelling the market development.
For instance, Novartis AG has the highest number of clinical trials followed by Pfizer Inc. and Ipsen Pharma. Moreover, technological advancements in therapies to treat neuroendocrine tumors are anticipated to fuel the market growth over the coming years. Some of these include PET imaging with Ga labeled Somatostatin, targeted drug therapies, and tyrosine kinase therapies. For instance, Lutathera by Novartis AG received FDA approval for the first ever radionucleotide therapy.
Neuroendocrine Tumor Treatment Market Report Highlights:
- The carcinoid tumors segment dominated the market with a revenue share of 24.3% in 2024, driven by the increasing prevalence of carcinoid tumors and advancements in treatment methodologies.
- The Somatostatin Analogs (SSAs) segment dominated the market with the largest revenue share in 2024, attributed to their proven efficacy in managing symptoms associated with neuroendocrine tumors.
- The small intestine segment dominated the market with the largest revenue share in 2024, attributed to the higher incidence rates of neuroendocrine tumors originating from this site.
- The hospitals segment dominated the market with the largest revenue share in 2024, driven by the comprehensive care offered by hospitals for complex cases of neuroendocrine tumors.
- North America neuroendocrine tumor treatment market dominated the global market with a revenue share of 42.1% in 2024, driven by high healthcare expenditure coupled with advanced medical infrastructure.
Table of Contents
Chapter 1. Methodology and Scope
- 1.1. Market Segmentation & Scope
- 1.2. Segment Definitions
- 1.2.1. Type
- 1.2.2. Product
- 1.2.3. Site
- 1.2.4. End Use
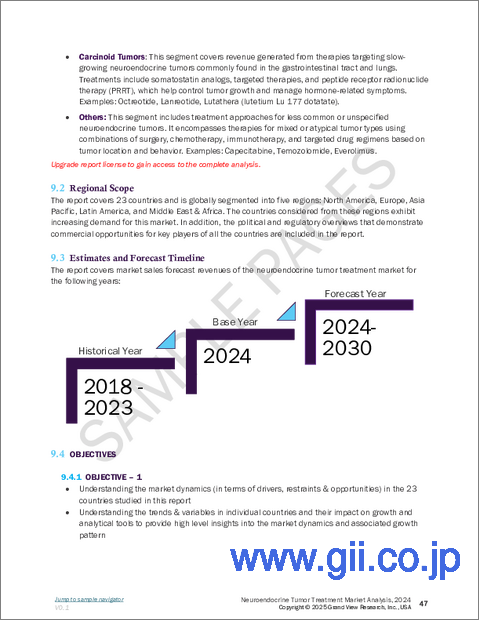
- 1.3. Estimates and Forecast Timeline
- 1.4. Research Methodology
- 1.5. Information Procurement
- 1.5.1. Purchased Database
- 1.5.2. GVR's Internal Database
- 1.5.3. Secondary Sources
- 1.5.4. Primary Research
- 1.6. Information Analysis
- 1.6.1. Data Analysis Models
- 1.7. Market Formulation & Data Visualization
- 1.8. Model Details
- 1.8.1. Commodity Flow Analysis
- 1.9. List of Secondary Sources
- 1.10. Objectives
Chapter 2. Executive Summary
- 2.1. Market Snapshot
- 2.2. Segment Snapshot
- 2.3. Competitive Landscape Snapshot
Chapter 3. Neuroendocrine Tumor Treatment Market Variables, Trends, & Scope
- 3.1. Market Lineage Outlook
- 3.2. Market Dynamics
- 3.2.1. Market Driver Analysis
- 3.2.2. Market Restraint Analysis
- 3.3. Business Environment Analysis
- 3.3.1. Industry Analysis - Porter's Five Forces Analysis
- 3.3.1.1. Supplier Power
- 3.3.1.2. Buyer Power
- 3.3.1.3. Substitution Threat
- 3.3.1.4. Threat of New Entrants
- 3.3.1.5. Competitive Rivalry
- 3.3.2. PESTLE Analysis
- 3.3.1. Industry Analysis - Porter's Five Forces Analysis
Chapter 4. Neuroendocrine Tumor Treatment Market: Type Business Analysis
- 4.1. Type Market Share, 2024 & 2030
- 4.2. Type Segment Dashboard
- 4.3. Market Size & Forecasts and Trend Analysis, by Type, 2018 to 2030 (USD Billion)
- 4.4. Meningiomas
- 4.4.1. Meningiomas Market, 2018 - 2030 (USD Billion)
- 4.5. Adrenal Cancer
- 4.5.1. Adrenal Cancer Market, 2018 - 2030 (USD Billion)
- 4.6. Carcinoid Tumors
- 4.6.1. Carcinoid Tumors Market, 2018 - 2030 (USD Billion)
- 4.7. Paraganglioma
- 4.7.1. Paraganglioma Market, 2018 - 2030 (USD Billion)
- 4.8. Pheochromocytoma
- 4.8.1. Pheochromocytoma Market, 2018 - 2030 (USD Billion)
- 4.9. Others
- 4.9.1. Others Market, 2018 - 2030 (USD Billion)
Chapter 5. Neuroendocrine Tumor Treatment Market: Product Business Analysis
- 5.1. Product Market Share, 2024 & 2030
- 5.2. Product Segment Dashboard
- 5.3. Market Size & Forecasts and Trend Analysis, by Product, 2018 to 2030 (USD Billion)
- 5.4. Somatostatin Analogs (SSAs)
- 5.4.1. Somatostatin Analogs (SSAs)Market, 2018 - 2030 (USD Billion)
- 5.5. Targeted Therapy
- 5.5.1. Targeted Therapy Market, 2018 - 2030 (USD Billion)
- 5.6. Others
- 5.6.1. Others Market, 2018 - 2030 (USD Billion)
Chapter 6. Neuroendocrine Tumor Treatment Market: Site Business Analysis
- 6.1. Site Market Share, 2024 & 2030
- 6.2. Site Segment Dashboard
- 6.3. Market Size & Forecasts and Trend Analysis, by Site, 2018 to 2030 (USD Billion)
- 6.4. Lung
- 6.4.1. Lung Market, 2018 - 2030 (USD Billion)
- 6.5. Pancreas
- 6.5.1. Pancreas Market, 2018 - 2030 (USD Billion)
- 6.6. Colon
- 6.6.1. Colon Market, 2018 - 2030 (USD Billion)
- 6.7. Small Intestine
- 6.7.1. Small Intestine Market, 2018 - 2030 (USD Billion)
- 6.8. Rectum
- 6.8.1. Rectum Market, 2018 - 2030 (USD Billion)
- 6.9. Stomach
- 6.9.1. Stomach Market, 2018 - 2030 (USD Billion)
- 6.10. Others
- 6.10.1. Others Market, 2018 - 2030 (USD Billion)
Chapter 7. Neuroendocrine Tumor Treatment Market: End Use Business Analysis
- 7.1. End Use Market Share, 2024 & 2030
- 7.2. End Use Segment Dashboard
- 7.3. Market Size & Forecasts and Trend Analysis, by End Use, 2018 to 2030 (USD Billion)
- 7.4. Hospitals
- 7.4.1. Hospitals Market, 2018 - 2030 (USD Billion)
- 7.5. Clinics
- 7.5.1. Clinics Market, 2018 - 2030 (USD Billion)
- 7.6. Others
- 7.6.1. Others Market, 2018 - 2030 (USD Billion)
Chapter 8. Neuroendocrine Tumor Treatment Market: Regional Estimates & Trend Analysis
- 8.1. Regional Market Share Analysis, 2024 & 2030
- 8.2. Regional Market Dashboard
- 8.3. Market Size & Forecasts Trend Analysis, 2018 to 2030:
- 8.4. North America
- 8.4.1. North America Neuroendocrine Tumor Treatment Market Estimates and Forecasts, by Country, 2018 - 2030 (USD Billion)
- 8.4.2. U.S.
- 8.4.2.1. Key Country Dynamics
- 8.4.2.2. Regulatory Framework
- 8.4.2.3. Competitive Insights
- 8.4.2.4. U.S. Neuroendocrine Tumor Treatment Market Estimates and Forecasts, 2018 - 2030 (USD Billion)
- 8.4.3. Canada
- 8.4.3.1. Key Country Dynamics
- 8.4.3.2. Regulatory Framework
- 8.4.3.3. Competitive Insights
- 8.4.3.4. Canada Neuroendocrine Tumor Treatment Market Estimates and Forecasts, 2018 - 2030 (USD Billion)
- 8.4.4. Mexico
- 8.4.4.1. Key Country Dynamics
- 8.4.4.2. Regulatory Framework
- 8.4.4.3. Competitive Insights
- 8.4.4.4. Mexico Neuroendocrine Tumor Treatment Market Estimates and Forecasts, 2018 - 2030 (USD Billion)
- 8.5. Europe
- 8.5.1. Europe Neuroendocrine Tumor Treatment Market Estimates and Forecasts, by Country, 2018 - 2030 (USD Billion)
- 8.5.2. UK
- 8.5.2.1. Key Country Dynamics
- 8.5.2.2. Regulatory Framework
- 8.5.2.3. Competitive Insights
- 8.5.2.4. UK Neuroendocrine Tumor Treatment Market Estimates and Forecasts, 2018 - 2030 (USD Billion)
- 8.5.3. Germany
- 8.5.3.1. Key Country Dynamics
- 8.5.3.2. Regulatory Framework
- 8.5.3.3. Competitive Insights
- 8.5.3.4. Germany Neuroendocrine Tumor Treatment Market Estimates and Forecasts, 2018 - 2030 (USD Billion)
- 8.5.4. France
- 8.5.4.1. Key Country Dynamics
- 8.5.4.2. Regulatory Framework
- 8.5.4.3. Competitive Insights
- 8.5.4.4. France Neuroendocrine Tumor Treatment Market Estimates and Forecasts, 2018 - 2030 (USD Billion)
- 8.5.5. Italy
- 8.5.5.1. Key Country Dynamics
- 8.5.5.2. Regulatory Framework
- 8.5.5.3. Competitive Insights
- 8.5.5.4. Italy Neuroendocrine Tumor Treatment Market Estimates and Forecasts, 2018 - 2030 (USD Billion)
- 8.5.6. Spain
- 8.5.6.1. Key Country Dynamics
- 8.5.6.2. Regulatory Framework
- 8.5.6.3. Competitive Insights
- 8.5.6.4. Spain Neuroendocrine Tumor Treatment Market Estimates and Forecasts, 2018 - 2030 (USD Billion)
- 8.5.7. Norway
- 8.5.7.1. Key Country Dynamics
- 8.5.7.2. Regulatory Framework
- 8.5.7.3. Competitive Insights
- 8.5.7.4. Norway Neuroendocrine Tumor Treatment Market Estimates and Forecasts, 2018 - 2030 (USD Billion)
- 8.5.8. Denmark
- 8.5.8.1. Key Country Dynamics
- 8.5.8.2. Regulatory Framework
- 8.5.8.3. Competitive Insights
- 8.5.8.4. Denmark Neuroendocrine Tumor Treatment Market Estimates and Forecasts, 2018 - 2030 (USD Billion)
- 8.5.9. Sweden
- 8.5.9.1. Key Country Dynamics
- 8.5.9.2. Regulatory Framework
- 8.5.9.3. Competitive Insights
- 8.5.9.4. Sweden Neuroendocrine Tumor Treatment Market Estimates and Forecasts, by Country, 2018 - 2030 (USD Billion)
- 8.6. Asia Pacific
- 8.6.1. Asia Pacific Neuroendocrine Tumor Treatment Market Estimates and Forecasts, 2018 - 2030 (USD Billion)
- 8.6.2. Japan
- 8.6.2.1. Key Country Dynamics
- 8.6.2.2. Regulatory Framework
- 8.6.2.3. Competitive Insights
- 8.6.2.4. Japan Neuroendocrine Tumor Treatment Market Estimates and Forecasts, 2018 - 2030 (USD Billion)
- 8.6.3. China
- 8.6.3.1. Key Country Dynamics
- 8.6.3.2. Regulatory Framework
- 8.6.3.3. Competitive Insights
- 8.6.3.4. China Neuroendocrine Tumor Treatment Market Estimates and Forecasts, 2018 - 2030 (USD Billion)
- 8.6.4. India
- 8.6.4.1. Key Country Dynamics
- 8.6.4.2. Regulatory Framework
- 8.6.4.3. Competitive Insights
- 8.6.4.4. India Neuroendocrine Tumor Treatment Market Estimates and Forecasts, 2018 - 2030 (USD Billion)
- 8.6.5. South Korea
- 8.6.5.1. Key Country Dynamics
- 8.6.5.2. Regulatory Framework
- 8.6.5.3. Competitive Insights
- 8.6.5.4. South Korea Neuroendocrine Tumor Treatment Market Estimates and Forecasts, 2018 - 2030 (USD Billion)
- 8.6.6. Australia
- 8.6.6.1. Key Country Dynamics
- 8.6.6.2. Regulatory Framework
- 8.6.6.3. Competitive Insights
- 8.6.6.4. Australia Neuroendocrine Tumor Treatment Market Estimates and Forecasts, 2018 - 2030 (USD Billion)
- 8.6.7. Singapore
- 8.6.7.1. Key Country Dynamics
- 8.6.7.2. Regulatory Framework
- 8.6.7.3. Competitive Insights
- 8.6.7.4. Singapore Neuroendocrine Tumor Treatment Market Estimates and Forecasts, 2018 - 2030 (USD Billion)
- 8.7. Latin America
- 8.7.1. Latin America Neuroendocrine Tumor Treatment Market Estimates and Forecasts, by Country, 2018 - 2030 (USD Billion)
- 8.7.2. Brazil
- 8.7.2.1. Key Country Dynamics
- 8.7.2.2. Regulatory Framework
- 8.7.2.3. Competitive Insights
- 8.7.2.4. Brazil Neuroendocrine Tumor Treatment Market Estimates and Forecasts, 2018 - 2030 (USD Billion)
- 8.7.3. Argentina
- 8.7.3.1. Key Country Dynamics
- 8.7.3.2. Regulatory Framework
- 8.7.3.3. Competitive Insights
- 8.7.3.4. Argentina Neuroendocrine Tumor Treatment Market Estimates and Forecasts, 2018 - 2030 (USD Billion)
- 8.8. MEA
- 8.8.1. MEA Neuroendocrine Tumor Treatment Market Estimates and Forecasts, by Country, 2018 - 2030 (USD Billion)
- 8.8.2. South Africa
- 8.8.2.1. Key Country Dynamics
- 8.8.2.2. Regulatory Framework
- 8.8.2.3. Competitive Insights
- 8.8.2.4. South Africa Neuroendocrine Tumor Treatment Market Estimates and Forecasts, 2018 - 2030 (USD Billion)
- 8.8.3. Saudi Arabia
- 8.8.3.1. Key Country Dynamics
- 8.8.3.2. Regulatory Framework
- 8.8.3.3. Competitive Insights
- 8.8.3.4. Saudi Arabia Neuroendocrine Tumor Treatment Market Estimates and Forecasts, 2018 - 2030 (USD Billion)
- 8.8.4. UAE
- 8.8.4.1. Key Country Dynamics
- 8.8.4.2. Regulatory Framework
- 8.8.4.3. Competitive Insights
- 8.8.4.4. UAE Neuroendocrine Tumor Treatment Market Estimates and Forecasts, 2018 - 2030 (USD Billion)
- 8.8.5. Kuwait
- 8.8.5.1. Key Country Dynamics
- 8.8.5.2. Regulatory Framework
- 8.8.5.3. Competitive Insights
- 8.8.5.4. Kuwait Neuroendocrine Tumor Treatment Market Estimates and Forecasts, 2018 - 2030 (USD Billion)
Chapter 9. Competitive Landscape
- 9.1. Participant Overview
- 9.2. Company Market Position Analysis
- 9.3. Company Categorization
- 9.4. Strategy Mapping
- 9.5. Company Profiles/Listing
- 9.5.1. Novartis AG
- 9.5.1.1. Overview
- 9.5.1.2. Financial Performance
- 9.5.1.3. Type Benchmarking
- 9.5.1.4. Strategic Initiatives
- 9.5.2. Bristol-Myers Squibb Company
- 9.5.2.1. Overview
- 9.5.2.2. Financial Performance
- 9.5.2.3. Type Benchmarking
- 9.5.2.4. Strategic Initiatives
- 9.5.3. Pfizer Inc.
- 9.5.3.1. Overview
- 9.5.3.2. Financial Performance
- 9.5.3.3. Type Benchmarking
- 9.5.3.4. Strategic Initiatives
- 9.5.4. Boehringer Ingelheim International GmbH
- 9.5.4.1. Overview
- 9.5.4.2. Financial Performance
- 9.5.4.3. Type Benchmarking
- 9.5.4.4. Strategic Initiatives
- 9.5.5. Hutchison MediPharma Limited.
- 9.5.5.1. Overview
- 9.5.5.2. Financial Performance
- 9.5.5.3. Type Benchmarking
- 9.5.5.4. Strategic Initiatives
- 9.5.6. AVEO Pharmaceuticals, Inc.
- 9.5.6.1. Overview
- 9.5.6.2. Financial Performance
- 9.5.6.3. Type Benchmarking
- 9.5.6.4. Strategic Initiatives
- 9.5.7. Ipsen Pharma.
- 9.5.7.1. Overview
- 9.5.7.2. Financial Performance
- 9.5.7.3. Type Benchmarking
- 9.5.7.4. Strategic Initiatives
- 9.5.8. Eli Lilly and Company.
- 9.5.8.1. Overview
- 9.5.8.2. Financial Performance
- 9.5.8.3. Type Benchmarking
- 9.5.8.4. Strategic Initiatives
- 9.5.9. Exelixis, Inc.
- 9.5.9.1. Overview
- 9.5.9.2. Financial Performance
- 9.5.9.3. Type Benchmarking
- 9.5.9.4. Strategic Initiatives
- 9.5.10. Jubilant Pharmova Limited
- 9.5.10.1. Overview
- 9.5.10.2. Financial Performance
- 9.5.10.3. Type Benchmarking
- 9.5.10.4. Strategic Initiatives
- 9.5.1. Novartis AG
