|
|
市場調査レポート
商品コード
1611784
米国のボトル入り飲料水市場規模、シェア、動向分析レポート:製品別、流通チャネル別、パッケージ別、セグメント別予測、2025年~2030年U.S. Bottled Water Market Size, Share & Trends Analysis Report By Product (Spring Water, Sparkling Water), By Distribution Channel (On-Trade, Off-Trade), By Packaging, And Segment Forecasts, 2025 - 2030 |
||||||
|
|||||||
カスタマイズ可能
|
|||||||

| 米国のボトル入り飲料水市場規模、シェア、動向分析レポート:製品別、流通チャネル別、パッケージ別、セグメント別予測、2025年~2030年 |
|
出版日: 2024年11月19日
発行: Grand View Research
ページ情報: 英文 100 Pages
納期: 2~10営業日
|

全表示
- 概要
- 図表
- 目次
米国のボトル入り飲料水市場の成長と動向:
Grand View Research, Inc.の最新レポートによると、米国のボトル入り飲料水市場規模は2030年に664億1,000万米ドルに達すると予測され、2025年から2030年にかけて5.7%のCAGRで成長すると予測されています。
米国におけるボトル入り飲料水の需要と消費の増加は、健康志向の消費者行動、利便性、水分補給の嗜好の変化によるところが大きいです。消費者は、砂糖の大量摂取に伴う健康リスクへの意識の高まりから、ソーダのような砂糖入り飲料よりもボトル入り飲料水を好むようになっています。ボトル入り飲料水は、より健康的なライフスタイルをサポートするカロリーゼロ、糖分ゼロの代替品とみなされており、フィットネスを重視する若い消費者から、より健康的な選択をしたい高齢者まで、幅広い層にとって魅力的な選択肢となっています。
利便性は、ボトル入り飲料水の消費を促進するもう一つの大きな要因です。ペースの速いアメリカ人のライフスタイルでは、多くの人が外出時の日課に合う、簡単に手に入る水分補給の選択肢を求めています。持ち運び可能で再密封可能な容器で入手できるボトル入り飲料水は、このニーズに完璧に応えます。この動向は、消費者が職場でもジムでも旅行中でも、いつでも好みの水ブランドを楽しめるようにするシングルサーブ包装の拡大と一致しています。
環境意識も米国のボトル入り飲料水業界に影響を与えています。プラスチック廃棄物への懸念がある一方で、多くのブランドは、リサイクル素材の使用や環境に優しいパッケージの導入など、持続可能な慣行で対応しています。また、アルミやガラス製のボトルに投資したり、BPAフリーであることをアピールしたりする企業もあり、環境負荷の少ない、より健康的な水分補給の選択肢を求める環境意識の高い消費者の共感を呼んでいます。
米国のボトル入り飲料水市場は、製品の革新によりさらに拡大しており、各ブランドはフレーバーや電解質、さらにはビタミンやミネラルといった機能性成分を配合した強化飲料水を提供しています。この動向は、付加価値のある水分補給を求める消費者に対応し、単なる水以上のものを求める人々にアピールしています。その結果、フレーバーウォーターや機能性ボトルドウォーターが人気を博し、この分野の成長をさらに後押ししています。
米国ボトル入り飲料水市場レポート・ハイライト:
- スパークリングボトル入り飲料水は2025年から2030年にかけてCAGR 6.5%の成長が見込まれます。スパークリングウォーターには幅広いフレーバーとカスタマイズオプションがあるため、飲料にバラエティを求める消費者にとって魅力的であり、人気の高まりに寄与しています。
- 外食時にボトル入り飲料水を求める消費者が増えており、レストランやバーも顧客に爽やかな飲み物を提供する便利な方法として喜んでそれに応えているためです。
- 缶入りボトル入り飲料水セグメントは、2025年から2030年にかけてCAGR 7.0%で成長すると予想されます。これは主に、環境の持続可能性に対する消費者の意識の高まりに起因しています。
目次
第1章 調査手法と範囲
第2章 エグゼクティブサマリー
第3章 米国のボトル入り飲料水市場の変数、動向、範囲
- 市場系統の見通し
- 米国のボトル入り飲料水市場規模、2018年-2030年
- 浸透と成長の見込みマッピング
- 業界バリューチェーン分析
- 原材料の動向見通し
- 製造と技術の動向
- 販売/小売チャネル分析
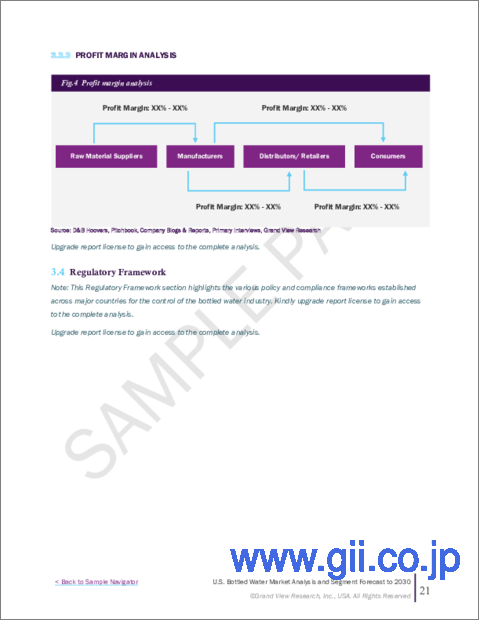
- 利益率分析
- 市場力学
- 市場 促進要因分析
- 市場抑制要因分析
- 市場機会
- 市場の課題
- 業界分析- ポーターのファイブフォース分析
- 市場参入戦略
第4章 米国のボトル入り飲料水市場: 消費者行動分析
- 人口統計分析
- 消費者の動向と嗜好
- 購買行動に影響を与える要因
- 消費者向けサービス導入動向
- 主な観察と発見
第5章 米国のボトル入り飲料水市場:製品推定・動向分析
- 米国のボトル入り飲料水市場、製品別:主なポイント
- 製品変動分析と市場シェア、2024年と2030年
- 製品別、2018年-2030年
- 湧き水
- スパークリングウォーター
- 精製水
- ミネラルウォーター
- その他
第6章 米国のボトル入り飲料水市場:流通チャネルの推定・動向分析
- 米国のボトル入り飲料水市場、流通チャネル別:主なポイント
- 流通チャネル変動分析と市場シェア、2024年と2030年
- 流通チャネル別、2018年-2030年
- オントレード
- オフトレード
第7章 米国のボトル入り飲料水市場:パッケージの推定・動向分析
- 米国のボトル入り飲料水市場、パッケージ別:主なポイント
- パッケージ変動分析と市場シェア、2024年と2030年
- パッケージ別、2018年-2030年
- ペット
- 缶
- その他
第8章 競合分析
- 主要市場参入企業による最近の開発と影響分析
- 企業分類
- 参入企業の概要
- 財務実績
- Product Portfolios
- 企業市場シェア分析、2024年(%)
- 企業ヒートマップ分析
- 戦略マッピング
- 企業プロファイル
- Nestle
- PepsiCo
- The Coca-Cola Company
- DANONE
- Primo Water Corporation
- FIJI Water Company LLC
- Gerolsteiner Brunnen GmbH &Co. KG
- Skechers USA, Inc.
- VOSS WATER
- Nongfu Spring
- Keurig Dr Pepper Inc.
- National Beverage Corp.
List of Tables
- Table 1. U.S. bottled water market - Key market driver analysis
- Table 2. U.S. bottled water market - Key market restraint analysis
- Table 3. U.S. bottled water market estimates & forecast, by product (USD Million)
- Table 4. U.S. bottled water market estimates & forecast, by distribution channel (USD Million)
- Table 5. U.S. bottled water market estimates & forecast, by packaging (USD Million)
- Table 6. Recent developments & impact analysis by key market participants
- Table 7. Company market share, 2024
- Table 8. Company heat map analysis
- Table 9. Companies undergoing key strategies
List of Figures
- Fig. 1 Bottled water market segmentation
- Fig. 2 Information procurement
- Fig. 3 Primary research pattern
- Fig. 4 Primary research approaches
- Fig. 5 Primary research process
- Fig. 6 Market snapshot
- Fig. 7 Product snapshot
- Fig. 8 Distribution channel snapshot
- Fig. 9 Packaging snapshot
- Fig. 10 Regional snapshot
- Fig. 11 Competitive landscape snapshot
- Fig. 12 U.S. bottled water market size, 2018 to 2030 (USD Million)
- Fig. 13 U.S. bottled water market: Penetration & growth prospect mapping
- Fig. 14 U.S. bottled water market: Value chain analysis
- Fig. 15 U.S. bottled water market: Profit margin analysis
- Fig. 16 U.S. bottled water market: Market dynamics
- Fig. 17 U.S. bottled water market: Porter's five forces analysis
- Fig. 18 Factors influencing buying decisions for US bottled water
- Fig. 19 U.S. bottled water market, by product: Key Takeaways
- Fig. 20 U.S. bottled water market: Product movement analysis, 2024 & 2030 (%)
- Fig. 21 Spring bottled water market estimates and forecast, 2018 - 2030 (USD Million)
- Fig. 22 Sparkling bottled water market estimates and forecast, 2018 - 2030 (USD Million)
- Fig. 23 Purified bottled water market estimates and forecast, 2018 - 2030 (USD Million)
- Fig. 24 Mineral bottled water market estimates and forecast, 2018 - 2030 (USD Million)
- Fig. 25 Other bottled water market estimates and forecast, 2018 - 2030 (USD Million)
- Fig. 26 U.S. bottled water market, by distribution channel: Key Takeaways
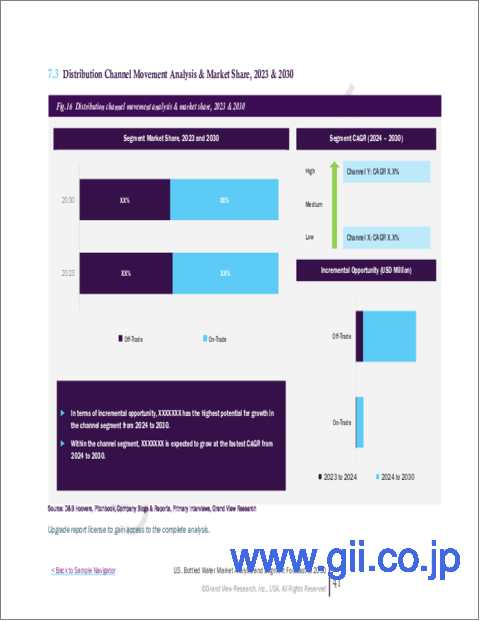
- Fig. 27 U.S. bottled water market: Distribution channel movement analysis, 2024 & 2030 (%)
- Fig. 28 U.S. bottled water market estimates and forecast through on-trade, 2018 - 2030 (USD Million)
- Fig. 29 U.S. bottled water market estimates and forecast through off-trade, 2018 - 2030 (USD Million)
- Fig. 30 U.S. bottled water market, by packaging: Key Takeaways
- Fig. 31 U.S. bottled water market: Packaging movement analysis, 2024 & 2030 (%)
- Fig. 32 PET bottled water market estimates and forecast, 2018 - 2030 (USD Million)
- Fig. 33 Canned bottled water market estimates and forecast, 2018 - 2030 (USD Million)
- Fig. 34 Other bottled water market estimates and forecast, 2018 - 2030 (USD Million)
- Fig. 35 Key company categorization
- Fig. 36 Company market share analysis, 2024
- Fig. 37 Strategic framework of the bottled water market
U.S. Bottled Water Market Growth & Trends:
The U.S. bottled water market size is estimated to reach USD 66.41 billion in 2030 and is projected to grow at a CAGR of 5.7% from 2025 to 2030, according to a new report by Grand View Research, Inc. The rising demand and consumption of bottled water in the U.S. are largely driven by health-conscious consumer behavior, convenience, and changing preferences for hydration. Consumers are increasingly favoring bottled water over sugary drinks like soda due to the growing awareness of health risks associated with high sugar intake. Bottled water is seen as a calorie-free, sugar-free alternative that supports healthier lifestyles, making it an attractive choice for a broad demographic, from younger consumers focused on fitness to older adults looking to make healthier choices.
Convenience is another major factor driving bottled water consumption. In the fast-paced American lifestyle, many people seek easily accessible hydration options that fit into their on-the-go routines. Bottled water, available in portable and resealable containers, meets this need perfectly. This trend aligns with the expansion of single-serve packaging, which allows consumers to enjoy their preferred water brand anytime, whether at work, the gym, or during travel.
Environmental awareness has also influenced the U.S. bottled water industry. While there are concerns about plastic waste, many brands are responding with sustainable practices, such as using recycled materials and introducing eco-friendly packaging. Some companies are also investing in aluminum and glass bottles or promoting their products as BPA-free, which resonates with eco-conscious consumers who want healthier hydration options with less environmental impact.
The U.S. market for bottled water is further expanding due to product innovation, with brands offering enhanced waters infused with flavors, electrolytes, and even functional ingredients like vitamins and minerals. This trend caters to consumers seeking hydration with added benefits, appealing to people who want more than just plain water. As a result, flavored and functional bottled water varieties have gained popularity, further driving growth in the sector.
U.S. Bottled Water Market Report Highlights:
- Sparkling bottled water is expected to grow at a CAGR of 6.5% from 2025 to 2030. The broad range of flavors and customization options in sparkling water has made it more appealing to consumers who enjoy variety in their beverages, contributing to its growing popularity.
- Sales through on-trade channels are expected to grow at a CAGR of 5.8% from 2025 to 2030, owing to increasing consumers demanding bottled water when they eat out, and restaurants and bars are happy to oblige, as it is a convenient way to provide their customers with a refreshing drink.
- The canned bottled water segment is expected to grow at a CAGR of 7.0% from 2025 to 2030. This can be primarily attributed to increasing consumer awareness towards environmental sustainability.
Table of Contents
Chapter 1. Methodology and Scope
- 1.1. Market Segmentation & Scope
- 1.2. Market Definition
- 1.3. Information Procurement
- 1.3.1. Purchased Database
- 1.3.2. GVR's Internal Database
- 1.3.3. Secondary Sources & Third-Party Perspectives
- 1.3.4. Primary Research
- 1.4. Information Analysis
- 1.4.1. Data Analysis Models
- 1.5. Market Formulation & Data Visualization
- 1.6. Data Validation & Publishing
Chapter 2. Executive Summary
- 2.1. Market Outlook
- 2.2. Product Outlook
- 2.3. Distribution Channel Outlook
- 2.4. Packaging Outlook
- 2.5. Competitive Landscape Outlook
Chapter 3. U.S. Bottled Water Market Variables, Trends & Scope
- 3.1. Market Lineage Outlook
- 3.1.1. U.S. Bottled Water Market Size, 2018 - 2030 (USD Million)
- 3.2. Penetration & Growth Prospect Mapping
- 3.3. Industry Value Chain Analysis
- 3.3.1. Raw Material Trends Outlooks
- 3.3.2. Manufacturing and Technology Trends
- 3.3.3. Sales/ Retail Channel Analysis
- 3.3.4. Profit Margin Analysis
- 3.4. Market Dynamics
- 3.4.1. Market Driver Analysis
- 3.4.2. Market Restraint Analysis
- 3.4.3. Market Opportunities
- 3.4.4. Market Challenges
- 3.5. Industry Analysis - Porter's Five Forces Analysis
- 3.6. Market Entry Strategies
Chapter 4. U.S. Bottled Water Market: Consumer Behavior Analysis
- 4.1. Demographic Analysis
- 4.2. Consumer Trends & Preferences
- 4.3. Factors Influencing Buying Behavior
- 4.4. Consumer Service Adoption Trends
- 4.5. Key Observations & Findings
Chapter 5. U.S. Bottled Water Market: Product Estimates & Trend Analysis
- 5.1. U.S. Bottled Water Market, by Product: Key Takeaways
- 5.2. Product Movement Analysis & Market Share, 2024 & 2030
- 5.3. Market Estimates & Forecasts, by Product, 2018 - 2030 (USD Million)
- 5.3.1. Spring Water
- 5.3.1.1. Market estimates and forecast, 2018 - 2030 (USD Million)
- 5.3.2. Sparkling Water
- 5.3.2.1. Market estimates and forecast, 2018 - 2030 (USD Million)
- 5.3.3. Purified Water
- 5.3.3.1. Market estimates and forecast, 2018 - 2030 (USD Million)
- 5.3.4. Mineral Water
- 5.3.4.1. Market estimates and forecast, 2018 - 2030 (USD Million)
- 5.3.5. Others
- 5.3.5.1. Market estimates and forecast, 2018 - 2030 (USD Million)
- 5.3.1. Spring Water
Chapter 6. U.S. Bottled Water Market: Distribution Channel Estimates & Trend Analysis
- 6.1. U.S. Bottled Water Market, by Distribution Channel: Key Takeaways
- 6.2. Distribution Channel Movement Analysis & Market Share, 2024 & 2030
- 6.3. Market Estimates & Forecasts, by Distribution Channel, 2018 - 2030 (USD Million)
- 6.3.1. On-Trade
- 6.3.1.1. Market estimates and forecast, 2018 - 2030 (USD Million)
- 6.3.2. Off-Trade
- 6.3.2.1. Market estimates and forecast, 2018 - 2030 (USD Million)
- 6.3.1. On-Trade
Chapter 7. U.S. Bottled Water Market: Packaging Estimates & Trend Analysis
- 7.1. U.S. Bottled Water Market, by Packaging: Key Takeaways
- 7.2. Packaging Movement Analysis & Market Share, 2024 & 2030
- 7.3. Market Estimates & Forecasts, by Packaging, 2018 - 2030 (USD Million)
- 7.3.1. PET
- 7.3.1.1. Market estimates and forecast, 2018 - 2030 (USD Million)
- 7.3.2. Cans
- 7.3.2.1. Market estimates and forecast, 2018 - 2030 (USD Million)
- 7.3.3. Others
- 7.3.3.1. Market estimates and forecast, 2018 - 2030 (USD Million)
- 7.3.1. PET
Chapter 8. Competitive Analysis
- 8.1. Recent Development & Impact Analysis, by Key Market Participants
- 8.2. Company Categorization
- 8.3. Participant's Overview
- 8.4. Financial Performance
- 8.5. Product Portfolios
- 8.6. Company Market Share Analysis, 2024 (%)
- 8.7. Company Heat Map Analysis
- 8.8. Strategy Mapping
- 8.9. Company Profiles
- 8.9.1. Nestle
- 8.9.1.1. Company Overview
- 8.9.1.2. Financial Performance
- 8.9.1.3. Product Portfolios
- 8.9.1.4. Strategic Initiatives
- 8.9.2. PepsiCo
- 8.9.2.1. Company Overview
- 8.9.2.2. Financial Performance
- 8.9.2.3. Product Portfolios
- 8.9.2.4. Strategic Initiatives
- 8.9.3. The Coca-Cola Company
- 8.9.3.1. Company Overview
- 8.9.3.2. Financial Performance
- 8.9.3.3. Product Portfolios
- 8.9.3.4. Strategic Initiatives
- 8.9.4. DANONE
- 8.9.4.1. Company Overview
- 8.9.4.2. Financial Performance
- 8.9.4.3. Product Portfolios
- 8.9.4.4. Strategic Initiatives
- 8.9.5. Primo Water Corporation
- 8.9.5.1. Company Overview
- 8.9.5.2. Financial Performance
- 8.9.5.3. Product Portfolios
- 8.9.5.4. Strategic Initiatives
- 8.9.6. FIJI Water Company LLC
- 8.9.6.1. Company Overview
- 8.9.6.2. Financial Performance
- 8.9.6.3. Product Portfolios
- 8.9.6.4. Strategic Initiatives
- 8.9.7. Gerolsteiner Brunnen GmbH & Co. KG
- 8.9.7.1. Company Overview
- 8.9.7.2. Financial Performance
- 8.9.7.3. Product Portfolios
- 8.9.7.4. Strategic Initiatives
- 8.9.8. Skechers U.S.A., Inc.
- 8.9.8.1. Company Overview
- 8.9.8.2. Financial Performance
- 8.9.8.3. Product Portfolios
- 8.9.8.4. Strategic Initiatives
- 8.9.9. VOSS WATER
- 8.9.9.1. Company Overview
- 8.9.9.2. Financial Performance
- 8.9.9.3. Product Portfolios
- 8.9.9.4. Strategic Initiatives
- 8.9.10. Nongfu Spring
- 8.9.10.1. Company Overview
- 8.9.10.2. Financial Performance
- 8.9.10.3. Product Portfolios
- 8.9.10.4. Strategic Initiatives
- 8.9.11. Keurig Dr Pepper Inc.
- 8.9.11.1. Company Overview
- 8.9.11.2. Financial Performance
- 8.9.11.3. Product Portfolios
- 8.9.11.4. Strategic Initiatives
- 8.9.12. National Beverage Corp.
- 8.9.12.1. Company Overview
- 8.9.12.2. Financial Performance
- 8.9.12.3. Product Portfolios
- 8.9.12.4. Strategic Initiatives
- 8.9.1. Nestle
