|
|
市場調査レポート
商品コード
1587836
キトサンの市場規模、シェア、動向分析レポート:用途別、地域別、セグメント予測、2024年~2030年Chitosan Market Size, Share & Trends Analysis Report By Application (Water Treatment, Medical & Pharmaceutical, Cosmetics, Food & Beverages, Agrochemicals, Others), By Region, And Segment Forecasts, 2024 - 2030 |
||||||
カスタマイズ可能
|
|||||||
| キトサンの市場規模、シェア、動向分析レポート:用途別、地域別、セグメント予測、2024年~2030年 |
|
出版日: 2024年10月18日
発行: Grand View Research
ページ情報: 英文 150 Pages
納期: 2~10営業日
|
全表示
- 概要
- 図表
- 目次
キトサン市場の成長と動向:
Grand View Research, Inc.の最新レポートによると、世界のキトサン市場は2024年から2030年にかけて20.3%のCAGRを記録し、2030年までに470億6,000万米ドルに達すると予測されています。
農業用途だけでなく、栄養補助食品における天然由来製品の需要の増加は、予測期間中の市場成長にプラスの影響を与えると予想されます。さらに、豊富な原料の入手可能性と、応用範囲を広げるための継続的な研究開発活動が、今後数年間のキトサン需要を促進すると予想される要因です。
キトサンは最も豊富に入手可能なバイオポリマーであり、主に甲殻類の廃棄物から得られます。乾燥エビの廃棄物は、キチンを合成するための最も一般的な原料であり、さらに脱アセチル化されてキトサンが生成されます。そのほか、カニ、ザリガニ、ロブスター、オキアミの殻など、さまざまな甲殻類もキトサンの製造に使われます。さらに、ベルギーに本拠を置くKitozyme社は、キトサンの製造に植物性原料を使用する新技術を開発しました。
商業的には、この製品は化学プロセスとバイオテクノロジー・プロセスを用いて製造されます。このうち、化学的プロセスは現在、実験室生産だけでなく工業規模でのキトサン製造にも最も広く使われている方法です。化学プロセスでは、アセトン、塩酸、硝酸、硫酸などの強酸や強塩基を使用します。しかし、塩酸はミネラルの除去効率が高いため、キトサン製造業者によって他のものに比べて大規模に使用されています。
キトサンは、ケラチン層の保水力を高めることができるため、セットローション、シャンプー、カラーリング製品、ヘアスプレーなど、さまざまなヘアケア製品での需要増加が見込まれています。さらに、マウスウォッシュ、歯磨き粉、歯用ジェルなどのデンタルケア製品の製造におけるキトサンの応用範囲の拡大は、市場の成長をさらに押し上げる可能性が高いです。さらに、消臭剤やフットパウダーの製造におけるキトサンの需要の高まりも、市場成長に好影響を与えると予想されます。
家庭用および工業用の廃水処理に使用されるバイオベースポリマーの需要は、過去数年間で増加しています。さらに、水の純度や安全性に関する消費者の関心の高まりと水処理分野の技術革新が相まって、予測期間中の市場成長にプラスの影響を与えると予想されます。
キトサン市場レポートハイライト
- バイオメディカルが市場を独占し、2023年の収益シェアは31.0%で最高となった。これは、医薬品製造におけるバイオベース成分の需要増に起因します。
- 洗口液、歯磨き粉、歯用ジェルなどのデンタルケア製品の製造におけるキトサンの応用範囲の拡大は、これらの製品の需要を増加させるであろう。
- アジア太平洋地域は、2023年に44.5%近くの最も高い売上高シェアで市場を独占しました。これは、アジア太平洋地域が、世界の景観の中でその地位を高める様々な要因の組み合わせに牽引され、市場で支配的な勢力として台頭したことに起因します。
目次
第1章 調査手法と範囲
第2章 エグゼクティブサマリー
第3章 キトサン市場の変数、動向、範囲
- 世界のキトサン市場の見通し
- 業界バリューチェーン分析
- 原材料の見通し
- 製造と技術の概要
- 販売チャネル分析
- 価格動向分析
- 規制の枠組み
- 市場力学
- 市場 促進要因分析
- 市場抑制要因分析
- 業界の課題
- ポーターのファイブフォース分析
- サプライヤーの力
- 買い手の力
- 代替の脅威
- 新規参入の脅威
- 競争企業間の敵対関係
- マクロ経済分析
- 政治情勢
- 経済情勢
- 社会情勢
- 技術的情勢
- 環境情勢
- 法的な情勢
第4章 キトサン市場:用途展望の推定と予測
- キトサン市場:用途変動分析、2023年および2030年
- 水処理
- 製薬
- バイオメディカル
- 化粧品
- 飲食品
- その他
第5章 キトサン市場:地域展望の推定と予測
- 地域スナップショット
- キトサン市場:地域変動分析、2023年および2030年
- 北米
- 北米市場推計・予測、2018年-2030年
- 米国
- カナダ
- メキシコ
- 欧州
- 欧州市場推計・予測、2018年-2030年
- ドイツ
- フランス
- 英国
- イタリア
- スペイン
- アジア太平洋
- アジア太平洋市場推計・予測、2018年-2030年
- 中国
- インド
- 韓国
- 日本
- 中南米
- 中南米市場推計・予測、2018年-2030年
- ブラジル
- 中東・アフリカ
- 中東およびアフリカ市場推計・予測、2018年-2030年
- サウジアラビア
- 南アフリカ
第6章 競合情勢
- 主要市場参入企業による最近の動向と影響分析
- 企業分類
- ヒートマップ分析
- 市場戦略
- 企業プロファイル
- Qingdao Yunzhou Biochemistry Co.
- Panvo Organics Pvt. Ltd.
- Advanced Biopolymers AS
- Meron
- Heppe Medical Chitosan GmbH
- KitoZyme SA
- Kraeber &Co. GmbH
- Golden-Shell Pharmaceutical
- PRIMEX EHF
- Dainichiseika Color &Chemicals Mfg. Co., Ltd.
- GTC Bio Corporation
- Marshall Marine Products
- SFly
- Asiamerica Group, Inc.
List of Tables
- Table 1 List of Potential End Users
- Table 2 Regulatory Framework, by regions
- Table 3 List of Raw Material Suppliers
- Table 4 U.S. Macroeconomic Outlay
- Table 5 Canada Macroeconomic Outlay
- Table 6 Mexico Macroeconomic Outlay
- Table 7 Germany Macroeconomic Outlay
- Table 8 UK Macroeconomic Outlay
- Table 9 France Macroeconomic Outlay
- Table 10 Italy Macroeconomic Outlay
- Table 11 Spain Macroeconomic Outlay
- Table 12 China Macroeconomic Outlay
- Table 13 India Macroeconomic Outlay
- Table 14 Japan Macroeconomic Outlay
- Table 15 South Korea Macroeconomic Outlay
- Table 16 Brazil Macroeconomic Outlay
- Table 17 Argentina Macroeconomic Outlay
- Table 18 Saudi Arabia Macroeconomic Outlay
- Table 19 South Africa Macroeconomic Outlay
- Table 20 Participant's Overview
- Table 21 Financial Performance
- Table 22 Product Benchmarking
- Table 23 Company Heat Map Analysis
- Table 24 Key Strategy Mapping
List of Figures
- Fig. 1 Market segmentation
- Fig. 2 Information procurement
- Fig. 3 Data Analysis Models
- Fig. 4 Market Formulation and Validation
- Fig. 5 Market snapshot
- Fig. 6 Segmental outlook- application
- Fig. 7 Competitive outlook
- Fig. 8 Chitosan market, 2018 - 2030 (USD Million) (Tons)
- Fig. 9 Value chain analysis
- Fig. 10 Market dynamics
- Fig. 11 Porter's Analysis
- Fig. 12 PESTEL Analysis
- Fig. 13 Chitosan market, by application: Key takeaways
- Fig. 14 Chitosan market, by application: Market share, 2023 & 2030
- Fig. 15 Chitosan market, by region: Key takeaways
- Fig. 16 Chitosan market, by region: Market share, 2023 & 2030
Chitosan Market Growth & Trends:
The global chitosan market is expected to reach USD 47.06 billion by 2030, registering a CAGR of 20.3% from 2024 to 2030, as per the new report by Grand View Research, Inc. The increasing demand for naturally derived products in dietary supplements, as well as agricultural applications, is expected to have a positive impact on the market growth during the forecasted period. Additionally, abundant raw material availability and ongoing R&D activities, to broaden its application scope, are the factors expected to propel the demand for chitosan during the next few years.
Chitosan is the most abundant available bio-polymer and is obtained primarily from crustacean waste. Dried shrimp waste is the most common raw material for the synthesis of chitin, which further is deacetylated to produce chitosan. In addition, various other crustacean animals including crabs, crayfish, lobsters, and krill shells are also used to manufacture chitosan. Furthermore, Belgium-based Kitozyme has developed a new technology that uses vegetable sources to produce chitosan.
Commercially, the product is manufactured using chemical and biotechnological processes. Among these, chemical processes are currently the most widely used methods for chitosan manufacturing at an industrial scale as well as in laboratory production. The chemical process involves using strong acids and bases such as acetone, hydrochloric acid, nitric acid, and sulfuric acid. However, hydrochloric acid, owing to its high efficiency in the removal of minerals, is used on a larger scale as compared to others by the chitosan manufacturers.
Chitosan can increase the water-holding capacity of the keratin layer; thus, its demand is expected to increase in various hair care products including setting lotions, shampoos, coloring products, and hairspray. Furthermore, the rising application scope of chitosan in manufacturing dental care products including mouthwash, toothpaste, and tooth gels is further likely to boost the market growth. Moreover, the rising demand for chitosan in manufacturing deodorants and foot powders is also expected to have a positive impact on market growth.
The demand for bio-based polymers used for domestic and industrial wastewater treatment has increased during the past few years. Additionally, rising consumer concerns regarding water purity and safety coupled with innovations in the field of water treatment are expected to have a positive impact on the market growth during the forecasted period.
Chitosan Market Report Highlights:
- Biomedical dominated the market, with the highest revenue share of 31.0% in 2023. This is attributed to the increasing demand for bio-based ingredients in drug manufacturing.
- The rising application scope of chitosan for manufacturing dental care products, including mouthwash, toothpaste, and tooth gels, will likely increase demand for these products.
- Asia Pacific dominated the market with the highest revenue share of nearly 44.5% in 2023.This is attributed to the Asia Pacific region having emerged as a dominant force in the market, driven by a combination of factors that enhance its position in the global landscape.
Table of Contents
Chapter 1. Methodology and Scope
- 1.1. Market Segmentation & Scope
- 1.2. Market Definition
- 1.3. Information Procurement
- 1.3.1. Purchased Database
- 1.3.2. GVR's Internal Database
- 1.3.3. Secondary Sources & Third-Party Perspectives
- 1.3.4. Primary Research
- 1.4. Information Analysis
- 1.4.1. Data Analysis Models
- 1.5. Market Formulation & Data Visualization
- 1.6. Data Validation & Publishing
Chapter 2. Executive Summary
- 2.1. Market Insights
- 2.2. Segmental Outlook
- 2.3. Competitive Outlook
Chapter 3. Chitosan Market Variables, Trends & Scope
- 3.1. Global Chitosan Market Outlook
- 3.2. Industry Value Chain Analysis
- 3.2.1. Raw Material Outlook
- 3.2.2. Manufacturing & Technology Overview
- 3.2.3. Sales Channel Analysis
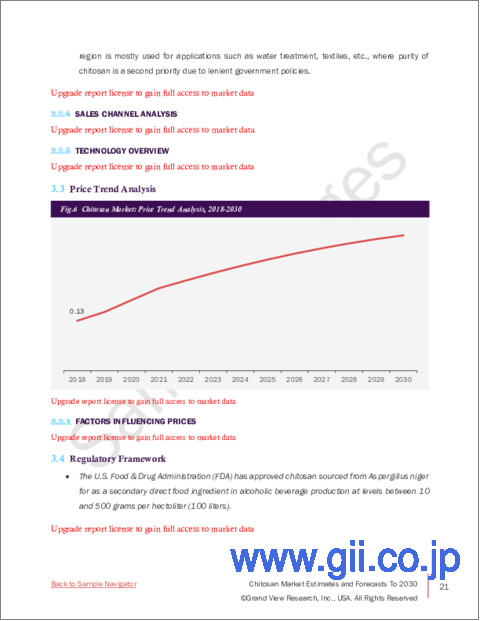
- 3.3. Price Trend Analysis
- 3.4. Regulatory Framework
- 3.5. Market Dynamics
- 3.5.1. Market Driver Analysis
- 3.5.2. Market Restraint Analysis
- 3.5.3. Industry Challenges
- 3.6. Porter's Five Forces Analysis
- 3.6.1. Supplier Power
- 3.6.2. Buyer Power
- 3.6.3. Substitution Threat
- 3.6.4. Threat from New Entrant
- 3.6.5. Competitive Rivalry
- 3.7. Macroeconomic Analysis
- 3.7.1. Political Landscape
- 3.7.2. Economic Landscape
- 3.7.3. Social Landscape
- 3.7.4. Technological Landscape
- 3.7.5. Environmental Landscape
- 3.7.6. Legal Landscape
Chapter 4. Chitosan Market: Application Outlook Estimates & Forecasts
- 4.1. Chitosan Market: Application Movement Analysis, 2023 & 2030
- 4.2. Water Treatment
- 4.2.1. Market estimates and forecast, 2018 - 2030 (Tons) (USD Million)
- 4.3. Pharmaceutical
- 4.3.1. Chitosan Market estimates and forecast, by Pharmaceutical, 2018 - 2030 (Tons) (USD Million)
- 4.4. Biomedical
- 4.4.1. Chitosan Market estimates and forecast, by Biomedical, 2018 - 2030 (Tons) (USD Million)
- 4.5. Cosmetics
- 4.5.1. Chitosan Market estimates and forecast, by Cosmetics, 2018 - 2030 (Tons) (USD Million)
- 4.6. Food & Beverage
- 4.6.1. Chitosan Market estimates and forecast, by Food & Beverage 2018 - 2030 (Tons) (USD Million)
- 4.7. Others
- 4.7.1. Chitosan Market estimates and forecast, by Others, 2018 - 2030 (Tons) (USD Million)
Chapter 5. Chitosan Market Regional Outlook Estimates & Forecasts
- 5.1. Regional Snapshot
- 5.2. Chitosan Market: Regional Movement Analysis, 2023 & 2030
- 5.3. North America
- 5.3.1. North America Market estimates and forecast, 2018 - 2030 (Tons) (USD Million)
- 5.3.2. U.S.
- 5.3.2.1. U.S. Market estimates and forecast, 2018 - 2030 (Tons) (USD Million)
- 5.3.3. Canada
- 5.3.3.1. Canada Market estimates and forecast, 2018 - 2030 (Tons) (USD Million)
- 5.3.4. Mexico
- 5.3.4.1. Mexico Market estimates and forecast, 2018 - 2030 (Tons) (USD Million)
- 5.4. Europe
- 5.4.1. Europe Market estimates and forecast, 2018 - 2030 (Tons) (USD Million)
- 5.4.2. Germany
- 5.4.2.1. Germany Market estimates and forecast, 2018 - 2030 (Tons) (USD Million)
- 5.4.3. France
- 5.4.3.1. France Market estimates and forecast, 2018 - 2030 (Tons) (USD Million)
- 5.4.4. UK
- 5.4.4.1. UK Market estimates and forecast, 2018 - 2030 (Tons) (USD Million)
- 5.4.5. Italy
- 5.4.5.1. Italy Market estimates and forecast, 2018 - 2030 (Tons) (USD Million)
- 5.4.6. Spain
- 5.4.6.1. Spain Market estimates and forecast, 2018 - 2030 (Tons) (USD Million)
- 5.5. Asia Pacific
- 5.5.1. Asia Pacific Market estimates and forecast, 2018 - 2030 (Tons) (USD Million)
- 5.5.2. China
- 5.5.2.1. China Market estimates and forecast, 2018 - 2030 (Tons) (USD Million)
- 5.5.3. India
- 5.5.3.1. India Market estimates and forecast, 2018 - 2030 (Tons) (USD Million)
- 5.5.4. South Korea
- 5.5.4.1. Market estimates and forecast, 2018 - 2030 (Tons) (USD Million)
- 5.5.5. Japan
- 5.5.5.1. Japan Market estimates and forecast, 2018 - 2030 (Tons) (USD Million)
- 5.6. Central & South America
- 5.6.1. Central & South America Market estimates and forecast, 2018 - 2030 (Tons) (USD Million)
- 5.6.2. Brazil
- 5.6.2.1. Brazil Market estimates and forecast, 2018 - 2030 (Tons) (USD Million)
- 5.7. Middle East & Africa
- 5.7.1. Middle East & Africa Market estimates and forecast, 2018 - 2030 (Tons) (USD Million)
- 5.7.2. Saudi Arabia
- 5.7.2.1. Saudi Arabia Market estimates and forecast, 2018 - 2030 (Tons) (USD Million)
- 5.7.3. South Africa
- 5.7.3.1. South Africa Market estimates and forecast, 2018 - 2030 (Tons) (USD Million)
Chapter 6. Competitive Landscape
- 6.1. Recent Developments & Impact Analysis, By Key Market Participants
- 6.2. Company Categorization
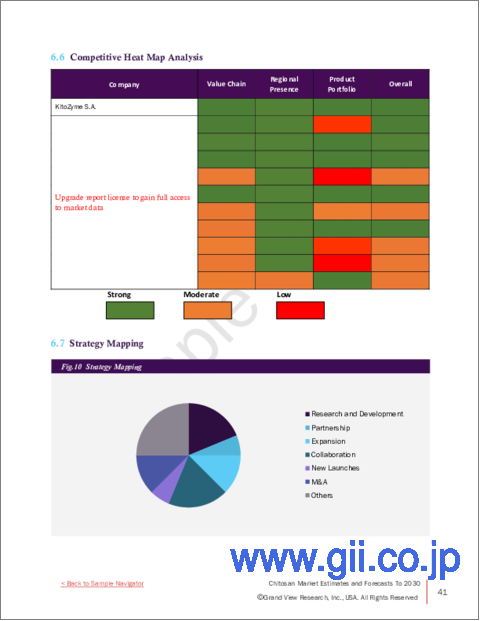
- 6.3. Heat Map Analysis
- 6.4. Market Strategies
- 6.5. Company Profiles/Listing
- 6.5.1. Qingdao Yunzhou Biochemistry Co.
- 6.5.1.1. Company Overview
- 6.5.1.2. Financial Performance
- 6.5.1.3. Product Benchmarking
- 6.5.2. Panvo Organics Pvt. Ltd.
- 6.5.2.1. Company Overview
- 6.5.2.2. Financial Performance
- 6.5.2.3. Product Benchmarking
- 6.5.3. Advanced Biopolymers AS
- 6.5.3.1. Company Overview
- 6.5.3.2. Financial Performance
- 6.5.3.3. Product Benchmarking
- 6.5.4. Meron
- 6.5.4.1. Company Overview
- 6.5.4.2. Financial Performance
- 6.5.4.3. Product Benchmarking
- 6.5.5. Heppe Medical Chitosan GmbH
- 6.5.5.1. Company Overview
- 6.5.5.2. Financial Performance
- 6.5.5.3. Product Benchmarking
- 6.5.6. KitoZyme S.A
- 6.5.6.1. Company Overview
- 6.5.6.2. Financial Performance
- 6.5.6.3. Product Benchmarking
- 6.5.7. Kraeber & Co. GmbH
- 6.5.7.1. Company Overview
- 6.5.7.2. Financial Performance
- 6.5.7.3. Product Benchmarking
- 6.5.8. Golden-Shell Pharmaceutical
- 6.5.8.1. Company Overview
- 6.5.8.2. Financial Performance
- 6.5.8.3. Product Benchmarking
- 6.5.9. PRIMEX EHF
- 6.5.9.1. Company Overview
- 6.5.9.2. Financial Performance
- 6.5.9.3. Product Benchmarking
- 6.5.10. Dainichiseika Color & Chemicals Mfg. Co., Ltd.
- 6.5.10.1. Company Overview
- 6.5.10.2. Financial Performance
- 6.5.10.3. Product Benchmarking
- 6.5.11. G.T.C. Bio Corporation
- 6.5.11.1. Company Overview
- 6.5.11.2. Financial Performance
- 6.5.11.3. Product Benchmarking
- 6.5.12. Marshall Marine Products
- 6.5.12.1. Company Overview
- 6.5.12.2. Financial Performance
- 6.5.12.3. Product Benchmarking
- 6.5.13. SFly
- 6.5.13.1. Company Overview
- 6.5.13.2. Financial Performance
- 6.5.13.3. Product Benchmarking
- 6.5.14. Asiamerica Group, Inc.
- 6.5.14.1. Company Overview
- 6.5.14.2. Financial Performance
- 6.5.14.3. Product Benchmarking
- 6.5.1. Qingdao Yunzhou Biochemistry Co.


