|
|
市場調査レポート
商品コード
1571750
エチレングリコールの市場規模、シェア、動向分析レポート:誘導体別、用途別、最終用途別、地域別、セグメント別予測、2024年~2030年Ethylene Glycols Market Size, Share & Trends Analysis Report By Derivative (MEG, DEG, TEG), By Application (Polyester Fibers, PET, Antifreeze & Coolants), By End Use (Automotive, Textile), By Region, And Segment Forecasts, 2024 - 2030 |
||||||
|
|||||||
カスタマイズ可能
|
|||||||

| エチレングリコールの市場規模、シェア、動向分析レポート:誘導体別、用途別、最終用途別、地域別、セグメント別予測、2024年~2030年 |
|
出版日: 2024年09月27日
発行: Grand View Research
ページ情報: 英文 100 Pages
納期: 2~10営業日
|

全表示
- 概要
- 目次
エチレングリコール市場の成長と動向
Grand View Research, Inc.の最新レポートによると、エチレングリコールの世界市場規模は、2024年から2030年にかけてCAGR 5.3%を記録し、2030年には235億6,000万米ドルに達する見込みです。
主にアジア太平洋とラテンアメリカにおける包装用途のポリエチレンテレフタレート(PET)需要の増加が、引き続き市場の主要な牽引要因になると予想されます。また、世界の繊維産業からの成長も、予測期間中のエチレングリコール市場の発展を支えるものと予想されます。原油価格の頻繁な変動を理由とする不安定な価格と逼迫した原料供給が、今後6年間の市場成長を阻害すると予想されます。
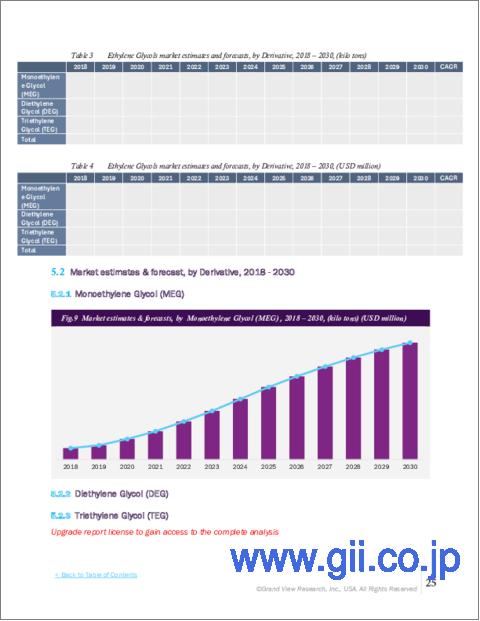
モノエチレングリコール(MEG)が主要製品セグメントとして台頭し、2023年には市場総量の32.67%を占めました。MEGは最大の製品セグメントであることに加え、2024年から2030年までの推定CAGRは4.5%で、エチレングリコールの中で最も急成長すると予想されます。MEGは主にPETの製造に使用され、世界の飲料市場の成長が予測期間中のMEG需要を牽引すると予想されます。ジ-エチレングリコール(DEG)の世界市場は、2030年までに62億3,000万米ドルに達すると予想されます。
エチレングリコール市場のレポートハイライト
- エチレングリコールの世界市場規模は2023年に177億6,000万米ドルとなり、2024年から2030年にかけてCAGR 5.3%で成長すると予測されます。
- PETがエチレングリコールの主要用途市場に浮上し、2023年の総市場量の44.1%を占めました。主にアジア太平洋とラテンアメリカにおける飲料産業の成長が、今後6年間この市場を牽引すると予想されます。ポリエステル繊維は、2024年から2030年までの推定CAGRが4.1%で、エチレングリコールで最も急成長する市場になると予想されます。
- 北米のエチレングリコール市場は、2023年に40.5%の収益シェアで世界のエチレングリコール市場を独占しました。
- エチレングリコールの世界市場はかなり集中しており、SABIC、Dow Chemical Company、Sinopec、Shell Chemicalの上位4社が2013年の市場全体の50%以上を占めています。その他、Formosa Plastics Group、Honam Petrochemicals、Ineosなどがあります。
目次
第1章 調査手法と範囲
第2章 エグゼクティブサマリー
第3章 エチレングリコール市場の変数、動向、範囲
- 市場イントロダクション/系統展望
- 市場規模と成長見通し
- 市場力学
- 市場促進要因分析
- 市場抑制要因分析
- エチレングリコール市場分析ツール
- ポーターの分析
- PESTEL分析
第4章 エチレングリコール市場:誘導体別の推定・動向分析
- セグメントダッシュボード
- エチレングリコール市場:誘導体別の変動分析、2023年および2030年
- モノエチレングリコール(MEG)
- ジエチレングリコール(DEG)
- トリエチレングリコール(TEG)
第5章 エチレングリコール市場:用途別の推定・動向分析
- セグメントダッシュボード
- エチレングリコール市場:用途別の変動分析、2023年および2030年
- ポリエステル繊維
- PET
- 不凍液と冷却剤
- フィルム
- その他
第6章 エチレングリコール市場:最終用途別の推定・動向分析
- セグメントダッシュボード
- エチレングリコール市場:最終用途別の変動分析、2023年および2030年
- 繊維
- 自動車
- パッケージ
- その他
第7章 エチレングリコール市場:地域別の推定・動向分析
- エチレングリコール市場シェア:地域別、2023年および2030年
- 北米
- 米国
- カナダ
- メキシコ
- 欧州
- 英国
- ドイツ
- フランス
- イタリア
- スペイン
- アジア太平洋
- 中国
- 日本
- インド
- 韓国
- ラテンアメリカ
- ブラジル
- アルゼンチン
- 中東・アフリカ
- 南アフリカ
- サウジアラビア
第8章 競合情勢
- 主要市場参入企業による最近の動向と影響分析
- 企業分類
- 企業ヒートマップ分析
- 企業プロファイル
- Exxon Mobil Corporation
- Dow Inc.
- SABIC
- China Petrochemical Corporation
- Shell Chemicals
- Reliance Industries Limited
- Huntsman International LLC
- LOTTE Chemical CORPORATION
- KUWAIT PETROLEUM CORPORATION
- LyondellBasell Industries Holdings BV
Ethylene Glycols Market Growth & Trends:
The global ethylene glycols market size is expected to reach USD 23.56 billion by 2030, registering a CAGR of 5.3% from 2024 to 2030, according to a new report by Grand View Research, Inc. Growing demand for polyethylene terephthalate (PET) for packaging applications, primarily in Asia Pacific and Latin America is expected to remain a key driving factor for the market. In addition, growth from the global textiles industry is also expected to support the ethylene glycol market development over the forecast period. Volatile prices and tight supply of raw materials, on account of frequent fluctuations in crude oil prices, are expected to inhibit the market growth over the next six years.
Monoethylene glycol (MEG) emerged as the leading product segment and accounted for 32.67% of total market volume in 2023. MEG in addition to being the largest product segment is also expected to be the fastest-growing ethylene glycol at an estimated CAGR of 4.5% from 2024 to 2030. MEG is mainly used for manufacturing PET and growth of the global beverages market is expected to drive the demand for MEG over the forecast period. Global market for di-ethylene glycol (DEG) is expected to reach USD 6.23 billion by 2030.
Ethylene Glycols Market Report Highlights:
- The global ethylene glycols market size was valued at USD 17.76 billion in 2023 and is projected to grow at a CAGR of 5.3% from 2024 to 2030.
- PET emerged as the leading application market for ethylene glycols and accounted for 44.1% of total market volume in 2023. Growth of the beverages industry mainly in Asia Pacific and Latin America is expected to drive this market over the next six years. Polyester fibers are expected to be the fastest-growing market for ethylene glycols at an estimated CAGR of 4.1% from 2024 to 2030.
- North America ethylene glycols market dominated the global ethylene glycols market with a revenue share of 40.5% in 2023.
- The global market for ethylene glycol is fairly concentrated with the top four companies operating in the market including SABIC, Dow Chemical Company, Sinopec and Shell Chemical accounted for over 50% of the total market in 2013. Other companies operating in the market include Formosa Plastics Group, Honam Petrochemicals, and Ineos.
Table of Contents
Chapter 1. Methodology and Scope
- 1.1. Market Segmentation and Scope
- 1.2. Market Definitions
- 1.3. Research Methodology
- 1.3.1. Information Procurement
- 1.3.2. Information or Data Analysis
- 1.3.3. Market Formulation & Data Visualization
- 1.3.4. Data Validation & Publishing
- 1.4. Research Scope and Assumptions
- 1.4.1. List of Data Sources
Chapter 2. Executive Summary
- 2.1. Market Outlook
- 2.2. Segment Outlook
- 2.3. Competitive Insights
Chapter 3. Ethylene Glycols Market Variables, Trends, & Scope
- 3.1. Market Introduction/Lineage Outlook
- 3.2. Market Size and Growth Prospects (Kilotons) (USD Million)
- 3.3. Market Dynamics
- 3.3.1. Market Drivers Analysis
- 3.3.2. Market Restraints Analysis
- 3.4. Ethylene Glycols Market Analysis Tools
- 3.4.1. Porter's Analysis
- 3.4.1.1. Bargaining power of the suppliers
- 3.4.1.2. Bargaining power of the buyers
- 3.4.1.3. Threats of substitution
- 3.4.1.4. Threats from new entrants
- 3.4.1.5. Competitive rivalry
- 3.4.2. PESTEL Analysis
- 3.4.2.1. Political landscape
- 3.4.2.2. Economic and Social landscape
- 3.4.2.3. Technological landscape
- 3.4.2.4. Environmental landscape
- 3.4.2.5. Legal landscape
- 3.4.1. Porter's Analysis
Chapter 4. Ethylene Glycols Market: Derivative Type Estimates & Trend Analysis
- 4.1. Segment Dashboard
- 4.2. Ethylene Glycols Market: Derivative Type Movement Analysis, 2023 & 2030 (USD Million)
- 4.3. Monoethylene Glycol (MEG)
- 4.3.1. Monoethylene Glycol (MEG) Market Revenue Estimates and Forecasts, 2018 - 2030 (Kilotons) (USD Million)
- 4.4. Diethylene Glycol (DEG)
- 4.4.1. Diethylene Glycol (DEG) Market Revenue Estimates and Forecasts, 2018 - 2030 (Kilotons) (USD Million)
- 4.5. Triethylene Glycol (TEG)
- 4.5.1. Triethylene Glycol (TEG) Market Revenue Estimates and Forecasts, 2018 - 2030 (Kilotons) (USD Million)
Chapter 5. Ethylene Glycols Market: Application Estimates & Trend Analysis
- 5.1. Segment Dashboard
- 5.2. Ethylene Glycols Market: Application Movement Analysis, 2023 & 2030 (USD Million)
- 5.3. Polyester Fibers
- 5.3.1. Polyester Fibers Market Revenue Estimates and Forecasts, 2018 - 2030 (Kilotons) (USD Million)
- 5.4. PET
- 5.4.1. PET Market Revenue Estimates and Forecasts, 2018 - 2030 (Kilotons) (USD Million)
- 5.5. Antifreeze and Coolants
- 5.5.1. Antifreeze and Coolants Market Revenue Estimates and Forecasts, 2018 - 2030 (Kilotons) (USD Million)
- 5.6. Films
- 5.6.1. Films Market Revenue Estimates and Forecasts, 2018 - 2030 (Kilotons) (USD Million)
- 5.7. Others
- 5.7.1. Others Market Revenue Estimates and Forecasts, 2018 - 2030 (Kilotons) (USD Million)
Chapter 6. Ethylene Glycols Market: End Use Estimates & Trend Analysis
- 6.1. Segment Dashboard
- 6.2. Ethylene Glycols Market: End Use Movement Analysis, 2023 & 2030 (USD Million)
- 6.3. Textile
- 6.3.1. Textile Market Revenue Estimates and Forecasts, 2018 - 2030 (Kilotons) (USD Million)
- 6.4. Automotive
- 6.4.1. Automotive Market Revenue Estimates and Forecasts, 2018 - 2030 (Kilotons) (USD Million)
- 6.5. Packaging
- 6.5.1. Packaging Market Revenue Estimates and Forecasts, 2018 - 2030 (Kilotons) (USD Million)
- 6.6. Others
- 6.6.1. Others Market Revenue Estimates and Forecasts, 2018 - 2030 (Kilotons) (USD Million)
Chapter 7. Ethylene Glycols Market: Regional Estimates & Trend Analysis
- 7.1. Ethylene Glycols Market Share, By Region, 2023 & 2030, USD Million
- 7.2. North America
- 7.2.1. North America Ethylene Glycols Market Estimates and Forecasts, 2018 - 2030 (Kilotons) (USD Million)
- 7.2.2. U.S.
- 7.2.2.1. U.S. Ethylene Glycols Market Estimates and Forecasts, 2018 - 2030 (Kilotons) (USD Million)
- 7.2.3. Canada
- 7.2.3.1. Canada Ethylene Glycols Market Estimates and Forecasts, 2018 - 2030 (Kilotons) (USD Million)
- 7.2.4. Mexico
- 7.2.4.1. Mexico Ethylene Glycols Market Estimates and Forecasts, 2018 - 2030 (Kilotons) (USD Million)
- 7.3. Europe
- 7.3.1. Europe Ethylene Glycols Market Estimates and Forecasts, 2018 - 2030 (Kilotons) (USD Million)
- 7.3.2. UK
- 7.3.2.1. UK Ethylene Glycols Market Estimates and Forecasts, 2018 - 2030 (Kilotons) (USD Million)
- 7.3.3. Germany
- 7.3.3.1. Germany Ethylene Glycols Market Estimates and Forecasts, 2018 - 2030 (Kilotons) (USD Million)
- 7.3.4. France
- 7.3.4.1. France Ethylene Glycols Market Estimates and Forecasts, 2018 - 2030 (Kilotons) (USD Million)
- 7.3.5. Italy
- 7.3.5.1. Italy Ethylene Glycols Market Estimates and Forecasts, 2018 - 2030 (Kilotons) (USD Million)
- 7.3.6. Spain
- 7.3.6.1. Spain Ethylene Glycols Market Estimates and Forecasts, 2018 - 2030 (Kilotons) (USD Million)
- 7.4. Asia Pacific
- 7.4.1. Asia Pacific Ethylene Glycols Market Estimates and Forecasts, 2018 - 2030 (Kilotons) (USD Million)
- 7.4.2. China
- 7.4.2.1. China Ethylene Glycols Market Estimates and Forecasts, 2018 - 2030 (Kilotons) (USD Million)
- 7.4.3. Japan
- 7.4.3.1. Japan Ethylene Glycols Market Estimates and Forecasts, 2018 - 2030 (Kilotons) (USD Million)
- 7.4.4. India
- 7.4.4.1. India Ethylene Glycols Market Estimates and Forecasts, 2018 - 2030 (Kilotons) (USD Million)
- 7.4.5. South Korea
- 7.4.5.1. South Korea Ethylene Glycols Market Estimates and Forecasts, 2018 - 2030 (Kilotons) (USD Million)
- 7.5. Latin America
- 7.5.1. Latin America Ethylene Glycols Market Estimates and Forecasts, 2018 - 2030 (Kilotons) (USD Million)
- 7.5.2. Brazil
- 7.5.2.1. Brazil Ethylene Glycols Market Estimates and Forecasts, 2018 - 2030 (Kilotons) (USD Million)
- 7.5.3. Argentina
- 7.5.3.1. Argentina Ethylene Glycols Market Estimates and Forecasts, 2018 - 2030 (Kilotons) (USD Million)
- 7.6. Middle East and Africa
- 7.6.1. Middle East and Africa Ethylene Glycols Market Estimates and Forecasts, 2018 - 2030 (Kilotons) (USD Million)
- 7.6.2. South Africa
- 7.6.2.1. South Africa Ethylene Glycols Market Estimates and Forecasts, 2018 - 2030 (Kilotons) (USD Million)
- 7.6.3. Saudi Arabia
- 7.6.3.1. Saudi Arabia Ethylene Glycols Market Estimates and Forecasts, 2018 - 2030 (Kilotons) (USD Million)
Chapter 8. Competitive Landscape
- 8.1. Recent Developments & Impact Analysis by Key Market Participants
- 8.2. Company Categorization
- 8.3. Company Heat Map Analysis
- 8.4. Company Profiles
- 8.4.1. Exxon Mobil Corporation
- 8.4.1.1. Participant's Overview
- 8.4.1.2. Financial Performance
- 8.4.1.3. Product Benchmarking
- 8.4.1.4. Recent Developments/Strategic Initiatives
- 8.4.2. Dow Inc.
- 8.4.2.1. Participant's Overview
- 8.4.2.2. Financial Performance
- 8.4.2.3. Product Benchmarking
- 8.4.2.4. Recent Developments/Strategic Initiatives
- 8.4.3. SABIC
- 8.4.3.1. Participant's Overview
- 8.4.3.2. Financial Performance
- 8.4.3.3. Product Benchmarking
- 8.4.3.4. Recent Developments/Strategic Initiatives
- 8.4.4. China Petrochemical Corporation
- 8.4.4.1. Participant's Overview
- 8.4.4.2. Financial Performance
- 8.4.4.3. Product Benchmarking
- 8.4.4.4. Recent Developments/Strategic Initiatives
- 8.4.5. Shell Chemicals
- 8.4.5.1. Participant's Overview
- 8.4.5.2. Financial Performance
- 8.4.5.3. Product Benchmarking
- 8.4.5.4. Recent Developments/Strategic Initiatives
- 8.4.6. Reliance Industries Limited
- 8.4.6.1. Participant's Overview
- 8.4.6.2. Financial Performance
- 8.4.6.3. Product Benchmarking
- 8.4.6.4. Recent Developments/Strategic Initiatives
- 8.4.7. Huntsman International LLC
- 8.4.7.1. Participant's Overview
- 8.4.7.2. Financial Performance
- 8.4.7.3. Product Benchmarking
- 8.4.7.4. Recent Developments/Strategic Initiatives
- 8.4.8. LOTTE Chemical CORPORATION
- 8.4.8.1. Participant's Overview
- 8.4.8.2. Financial Performance
- 8.4.8.3. Product Benchmarking
- 8.4.8.4. Recent Developments/Strategic Initiatives
- 8.4.9. KUWAIT PETROLEUM CORPORATION
- 8.4.9.1. Participant's Overview
- 8.4.9.2. Financial Performance
- 8.4.9.3. Product Benchmarking
- 8.4.9.4. Recent Developments/Strategic Initiatives
- 8.4.10. LyondellBasell Industries Holdings B.V.
- 8.4.10.1. Participant's Overview
- 8.4.10.2. Financial Performance
- 8.4.10.3. Product Benchmarking
- 8.4.10.4. Recent Developments/Strategic Initiatives
- 8.4.1. Exxon Mobil Corporation
