|
|
市場調査レポート
商品コード
1530501
リチウム硫黄電池の市場規模、シェア、動向分析レポート:タイプ別、電池容量別、用途別、地域別、セグメント予測、2024年~2030年Lithium-Sulfur Battery Market Size, Share & Trends Analysis Report By Type (Low Energy Density, High Energy Density), By Battery Capacity (Below 500 mAh, 500-1000 mAh), By Application, By Region, And Segment Forecasts, 2024 - 2030 |
||||||
|
|||||||
カスタマイズ可能
|
|||||||

| リチウム硫黄電池の市場規模、シェア、動向分析レポート:タイプ別、電池容量別、用途別、地域別、セグメント予測、2024年~2030年 |
|
出版日: 2024年07月25日
発行: Grand View Research
ページ情報: 英文 150 Pages
納期: 2~10営業日
|

全表示
- 概要
- 図表
- 目次
リチウム硫黄電池の市場規模と動向
世界のリチウム硫黄電池市場規模は、2023年に3,380万米ドルと推定され、2024~2030年にかけてCAGR 25.5%で成長すると予測されています。リチウム-硫黄(Li-S)電池市場は、様々なセグメント、特に電気自動車(EV)や携帯電子機器における高エネルギー密度の蓄電ソリューションに対する需要の増加が主要要因となっています。
Li-S電池は、理論上のエネルギー密度が従来のリチウムイオン電池の最大5倍であり、EVの航続距離を延ばし、モバイル機器の電池寿命を改善する有望な技術となっています。例えば、Oxis EnergyやSion Powerといった企業は、より長寿命で軽量な電源を提供することを目指し、自動車産業や航空宇宙産業向けにリチウムイオン電池を開発しています。
もう一つの重要な促進要因は、Li-S電池の潜在的な費用対効果です。主要な正極材料である硫黄は、従来のリチウムイオン電池に使用されているコバルトやニッケルに比べ、豊富に入手可能で安価です。このコスト優位性は、特にグリッド・ストレージのような大規模用途において、より手頃なエネルギー貯蔵ソリューションにつながる可能性があります。さらに、石油精製の製品別である硫黄を使用することによる環境上の利点は、持続可能で環境に優しい技術への注目の高まりと一致しています。
しかし、リチウム硫黄電池市場は、その市場開拓に影響を及ぼす課題にも直面しています。主要技術的障害には、シャトル効果(多硫化物が溶解して電極間を移動し、容量低下を引き起こす)があります。また、サイクル中に硫黄正極が膨張し、構造劣化につながることもあります。研究者や企業は、先進的な材料やセル設計を通じて、これらの問題への対処に積極的に取り組んでいます。例えば、スタンフォード大学の科学者は、シャトル効果の防止に役立つ新しいコーティングを開発し、リチウム硫黄電池の寿命を延ばす可能性があります。
世界のリチウム硫黄電池市場レポートセグメンテーション
このレポートは、2018~2030年にかけての収益成長を世界、地域、国レベルで予測し、各サブセグメントにおける最新の業界動向の分析を提供しています。この調査において、Grand View Research, Inc.はリチウム硫黄電池市場レポートを電池容量、タイプ、用途、地域に基づいてセグメント化しています。
目次
第1章 調査手法と範囲
第2章 エグゼクティブサマリー
第3章 リチウム硫黄電池市場の変数、動向、範囲
- 市場系統の展望
- 浸透と成長の展望のマッピング
- 業界バリューチェーン分析
- 価格動向分析、2018~2030年
- 価格設定に影響を与える主要要因
- 規制の枠組み
- 標準とコンプライアンス
- 安全性
- 市場力学
- 市場促進要因分析
- 市場抑制要因分析
- 市場課題分析
- 市場機会分析
- ビジネス環境分析
- 業界分析-ポーターのファイブフォース分析
- PESTEL分析
第4章 リチウム硫黄電池市場: 電池容量、推定・動向分析
- 定義と範囲
- 電池容量変動分析と市場シェア、2023年と2030年
- 500mAh以下
- 500~1,000mAh
- 1,000mAh以上
第5章 リチウム硫黄電池市場:タイプ、推定・動向分析
- 定義と範囲
- タイプ変動分析と市場シェア、2023年と2030年
- 低エネルギー密度
- 高エネルギー密度
第6章 リチウム硫黄電池市場:用途、推定・動向分析
- 定義と範囲
- 用途変動分析と市場シェア、2023年と2030年
- 自動車
- 航空宇宙
- 民生用電子機器
- エネルギー貯蔵システム
- 医療機器
- 軍事防衛
第7章 リチウム硫黄電池市場:地域別、推定・動向分析
- 主要ポイント
- 地域変動分析と市場シェア、2023年と2030年
- 北米
- 市場推定・予測、2018~2030年
- 米国
- カナダ
- メキシコ
- 欧州
- 市場推定・予測、2018~2030年
- ドイツ
- 英国
- フランス
- イタリア
- スペイン
- アジア太平洋
- 市場推定・予測、2018~2030年
- 中国
- インド
- 日本
- 韓国
- オーストラリア
- 中南米
- 市場推定・予測、2018~2030年
- ブラジル
- 中東・アフリカ
- 市場推定・予測、2018~2030年
- アラブ首長国連邦
第8章 競合情勢
- 主要参入企業と最近の動向、そして業界への影響
- 主要企業/競合の分類
- 主要コンポーネントのサプライヤーおよびチャネルパートナーの一覧
- 企業の市場シェアとポジション分析、2023年
- 企業ヒートマップ分析
- 競合ダッシュボード分析
- 戦略マッピング
- コラボレーション/パートナーシップ/契約
- 新製品の発売
- 合併と買収
- 研究開発
- その他
- 企業リスト/プロファイル
- PolyPlus Battery Company
- NexTech Batteries Inc.
- Li-S Energy Limited
- Zeta Energy LLC
- GS Yuasa Corporation
- LG Energy Solutions Ltd.
- Saft Groupe SA
- Gelion PLC
- Sion Power Corporation
- Johnson Matthey
- Giner, Inc.
- Lynntech, Inc.
- Ilika Technologies
- Williams Advanced Engineering
- Guang Dong Xiaowei New Energy Technology Co., Ltd.
List of Tables
- Table 1. Lithium-Sulfur Battery market estimates and forecasts, 2018 - 2030 (USD Million)
- Table 2. Lithium-Sulfur Battery market estimates and forecasts, by Below 500 mAh, 2018 - 2030 (USD Million)
- Table 3. Lithium-Sulfur Battery market estimates and forecasts, by 500-1000 mAh, 2018 - 2030 (USD Million)
- Table 4. Lithium-Sulfur Battery market estimates and forecasts, by Above 1000 mAh, 2018 - 2030 (USD Million)
- Table 5. Lithium-Sulfur Battery market estimates and forecasts, 2018 - 2030 (USD Million)
- Table 6. Lithium-Sulfur Battery market estimates and forecasts, by Low Energy Density, 2018 - 2030 (USD Million)
- Table 7. Lithium-Sulfur Battery market estimates and forecasts, by High Energy Density, 2018 - 2030 (USD Million)
- Table 8. Lithium-Sulfur Battery market estimates and forecasts, 2018 - 2030 (USD Million)
- Table 9. Lithium-Sulfur Battery market estimates and forecasts, in Automotive, 2018 - 2030 (USD Million)
- Table 10. Lithium-Sulfur Battery market estimates and forecasts, in Aerospace, 2018 - 2030 (USD Million)
- Table 11. Lithium-Sulfur Battery market estimates and forecasts, in Consumer Electronics, 2018 - 2030 (USD Million)
- Table 12. Lithium-Sulfur Battery market estimates and forecasts, in Energy Storage Systems, 2018 - 2030 (USD Million)
- Table 13. Lithium-Sulfur Battery market estimates and forecasts, in Medical Devices, 2018 - 2030 (USD Million)
- Table 14. Lithium-Sulfur Battery market estimates and forecasts, in Military Defense, 2018 - 2030 (USD Million)
- Table 15. Lithium-Sulfur Battery market estimates and forecasts, 2018 - 2030 (USD Million)
- Table 16. North America Lithium-Sulfur Battery market estimates and forecasts, 2018 - 2030 (USD Million)
- Table 17. North America Lithium-Sulfur Battery market estimates and forecasts, by battery capacity, 2018 - 2030 (USD Million)
- Table 18. North America Lithium-Sulfur Battery market estimates and forecasts, by type, 2018 - 2030 (USD Million)
- Table 19. North America Lithium-Sulfur Battery market estimates and forecasts, by application, 2018 - 2030 (USD Million)
- Table 20. U.S. Lithium-Sulfur Battery market estimates and forecasts, 2018 - 2030 (USD Million)
- Table 21. U.S. Lithium-Sulfur Battery market estimates and forecasts, by battery capacity, 2018 - 2030 (Units) (USD Million)
- Table 22. U.S. Lithium-Sulfur Battery market estimates and forecasts, by type, 2018 - 2030 (Units) (USD Million)
- Table 23. U.S. Lithium-Sulfur Battery market estimates and forecasts, by application, 2018 - 2030 (USD Million)
- Table 24. Canada Lithium-Sulfur Battery market estimates and forecasts, 2018 - 2030 (USD Million)
- Table 25. Canada Lithium-Sulfur Battery market estimates and forecasts, by battery capacity, 2018 - 2030 (USD Million)
- Table 26. Canada Lithium-Sulfur Battery market estimates and forecasts, by type, 2018 - 2030 (USD Million)
- Table 27. Canada Lithium-Sulfur Battery market estimates and forecasts, by application, 2018 - 2030 (USD Million)
- Table 28. Mexico Lithium-Sulfur Battery market estimates and forecasts, 2018 - 2030 (USD Million)
- Table 29. Mexico Lithium-Sulfur Battery market estimates and forecasts, by battery capacity, 2018 - 2030 (USD Million)
- Table 30. Mexico Lithium-Sulfur Battery market estimates and forecasts, by type, 2018 - 2030 (USD Million)
- Table 31. Mexico Lithium-Sulfur Battery market estimates and forecasts, by application, 2018 - 2030 (USD Million)
- Table 32. Europe Lithium-Sulfur Battery market estimates and forecasts, 2018 - 2030 (USD Million)
- Table 33. Europe Lithium-Sulfur Battery market estimates and forecasts, by battery capacity, 2018 - 2030 (USD Million)
- Table 34. Europe Lithium-Sulfur Battery market estimates and forecasts, by type, 2018 - 2030 (USD Million)
- Table 35. Europe Lithium-Sulfur Battery market estimates and forecasts, by application, 2018 - 2030 (USD Million)
- Table 36. Germany Lithium-Sulfur Battery market estimates and forecasts, 2018 - 2030 (USD Million)
- Table 37. Germany Lithium-Sulfur Battery market estimates and forecasts, by battery capacity, 2018 - 2030 (USD Million)
- Table 38. Germany Lithium-Sulfur Battery market estimates and forecasts, by type, 2018 - 2030 (USD Million)
- Table 39. Germany Lithium-Sulfur Battery market estimates and forecasts, by application, 2018 - 2030 (USD Million)
- Table 40. UK Lithium-Sulfur Battery market estimates and forecasts, 2018 - 2030 (USD Million)
- Table 41. UK Lithium-Sulfur Battery market estimates and forecasts, by battery capacity, 2018 - 2030 (USD Million)
- Table 42. UK Lithium-Sulfur Battery market estimates and forecasts, by type, 2018 - 2030 (USD Million)
- Table 43. UK Lithium-Sulfur Battery market estimates and forecasts, by application, 2018 - 2030 (USD Million)
- Table 44. France Lithium-Sulfur Battery market estimates and forecasts, 2018 - 2030 (USD Million)
- Table 45. France Lithium-Sulfur Battery market estimates and forecasts, by battery capacity, 2018 - 2030 (USD Million)
- Table 46. France Lithium-Sulfur Battery market estimates and forecasts, by type, 2018 - 2030 (USD Million)
- Table 47. France Lithium-Sulfur Battery market estimates and forecasts, by application, 2018 - 2030 (USD Million)
- Table 48. Italy Lithium-Sulfur Battery market estimates and forecasts, 2018 - 2030 (USD Million)
- Table 49. Italy Lithium-Sulfur Battery market estimates and forecasts, by battery capacity, 2018 - 2030 (USD Million)
- Table 50. Italy Lithium-Sulfur Battery market estimates and forecasts, by type, 2018 - 2030 (USD Million)
- Table 51. Italy Lithium-Sulfur Battery market estimates and forecasts, by application, 2018 - 2030 (USD Million)
- Table 52. Spain Lithium-Sulfur Battery market estimates and forecasts, 2018 - 2030 (USD Million)
- Table 53. Spain Lithium-Sulfur Battery market estimates and forecasts, by battery capacity, 2018 - 2030 (USD Million)
- Table 54. Spain Lithium-Sulfur Battery market estimates and forecasts, by type, 2018 - 2030 (USD Million)
- Table 55. Spain Lithium-Sulfur Battery market estimates and forecasts, by application, 2018 - 2030 (USD Million)
- Table 56. Asia Pacific Lithium-Sulfur Battery market estimates and forecasts, 2018 - 2030 (USD Million)
- Table 57. Asia Pacific Lithium-Sulfur Battery market estimates and forecasts, by battery capacity, 2018 - 2030 (USD Million)
- Table 58. Asia Pacific Lithium-Sulfur Battery market estimates and forecasts, by type, 2018 - 2030 (USD Million)
- Table 59. Asia Pacific Lithium-Sulfur Battery market estimates and forecasts, by application, 2018 - 2030 (USD Million)
- Table 60. China Lithium-Sulfur Battery market estimates and forecasts, 2018 - 2030 (USD Million)
- Table 61. China Lithium-Sulfur Battery market estimates and forecasts, by battery capacity, 2018 - 2030 (USD Million)
- Table 62. China Lithium-Sulfur Battery market estimates and forecasts, by type, 2018 - 2030 (USD Million)
- Table 63. China Lithium-Sulfur Battery market estimates and forecasts, by application, 2018 - 2030 (USD Million)
- Table 64. Japan Lithium-Sulfur Battery market estimates and forecasts, 2018 - 2030 (USD Million)
- Table 65. Japan Lithium-Sulfur Battery market estimates and forecasts, by battery capacity, 2018 - 2030 (USD Million)
- Table 66. Japan Lithium-Sulfur Battery market estimates and forecasts, by type, 2018 - 2030 (USD Million)
- Table 67. Japan Lithium-Sulfur Battery market estimates and forecasts, by application, 2018 - 2030 (USD Million)
- Table 68. India Lithium-Sulfur Battery market estimates and forecasts, 2018 - 2030 (USD Million)
- Table 69. India Lithium-Sulfur Battery market estimates and forecasts, by battery capacity, 2018 - 2030 (USD Million)
- Table 70. India Lithium-Sulfur Battery market estimates and forecasts, by type, 2018 - 2030 (USD Million)
- Table 71. India Lithium-Sulfur Battery market estimates and forecasts, by application, 2018 - 2030 (USD Million)
- Table 72. South Korea Lithium-Sulfur Battery market estimates and forecasts, 2018 - 2030 (USD Million)
- Table 73. South Korea Lithium-Sulfur Battery market estimates and forecasts, by battery capacity, 2018 - 2030 (USD Million)
- Table 74. South Korea Lithium-Sulfur Battery market estimates and forecasts, by type, 2018 - 2030 (USD Million)
- Table 75. South Korea Lithium-Sulfur Battery market estimates and forecasts, by application, 2018 - 2030 (USD Million)
- Table 76. Australia Lithium-Sulfur Battery market estimates and forecasts, 2018 - 2030 (USD Million)
- Table 77. Australia Lithium-Sulfur Battery market estimates and forecasts, by battery capacity, 2018 - 2030 (USD Million)
- Table 78. Australia Lithium-Sulfur Battery market estimates and forecasts, by type, 2018 - 2030 (USD Million)
- Table 79. Australia Lithium-Sulfur Battery market estimates and forecasts, by application, 2018 - 2030 (USD Million)
- Table 80. Central & South America Lithium-Sulfur Battery market estimates and forecasts, 2018 - 2030 (USD Million)
- Table 81. Central & South America Lithium-Sulfur Battery market estimates and forecasts, by battery capacity, 2018 - 2030 (USD Million)
- Table 82. Central & South America Lithium-Sulfur Battery market estimates and forecasts, by type, 2018 - 2030 (USD Million)
- Table 83. Central & South America Lithium-Sulfur Battery market estimates and forecasts, by application, 2018 - 2030 (USD Million)
- Table 84. Brazil Lithium-Sulfur Battery market estimates and forecasts, 2018 - 2030 (USD Million)
- Table 85. Brazil Lithium-Sulfur Battery market estimates and forecasts, by battery capacity, 2018 - 2030 (USD Million)
- Table 86. Brazil Lithium-Sulfur Battery market estimates and forecasts, by type, 2018 - 2030 (USD Million)
- Table 87. Brazil Lithium-Sulfur Battery market estimates and forecasts, by application, 2018 - 2030 (USD Million)
- Table 88. Middle East & Africa Lithium-Sulfur Battery market estimates and forecasts, 2018 - 2030 (USD Million)
- Table 89. Middle East & Africa Lithium-Sulfur Battery market estimates and forecasts, by battery capacity, 2018 - 2030 (USD Million)
- Table 90. Middle East & Africa Lithium-Sulfur Battery market estimates and forecasts, by type, 2018 - 2030 (USD Million)
- Table 91. Middle East & Africa Lithium-Sulfur Battery market estimates and forecasts, by application, 2018 - 2030 (USD Million)
- Table 92. UAE Lithium-Sulfur Battery market estimates and forecasts, 2018 - 2030 (USD Million)
- Table 93. UAE Lithium-Sulfur Battery market estimates and forecasts, by battery capacity, 2018 - 2030 (USD Million)
- Table 94. UAE Lithium-Sulfur Battery market estimates and forecasts, by type, 2018 - 2030 (USD Million)
- Table 95. UAE Lithium-Sulfur Battery market estimates and forecasts, by application, 2018 - 2030 (USD Million)
List of Figures
- Fig. 1 Information Procurement
- Fig. 2 Primary Research Pattern
- Fig. 3 Primary Research Process
- Fig. 4 Market Research Approaches - Bottom-Up Approach
- Fig. 5 Market Research Approaches - Top-Down Approach
- Fig. 6 Market Research Approaches - Combined Approach
- Fig. 7 Lithium-Sulfur Battery Market- Market Snapshot
- Fig. 8 Lithium-Sulfur Battery Market- Segment Snapshot (1/2)
- Fig. 9 Lithium-Sulfur Battery Market- Segment Snapshot (2/2)
- Fig. 10 Lithium-Sulfur Battery Market- Competitive Landscape Snapshot
- Fig. 11 Lithium-Sulfur Battery Market: Penetration & Growth Prospect Mapping
- Fig. 12 Lithium-Sulfur Battery Market: Value Chain Analysis
- Fig. 13 Lithium-Sulfur Battery Market: Porter's Five Force Analysis
- Fig. 14 Lithium-Sulfur Battery Market: PESTEL Analysis
- Fig. 15 Lithium-Sulfur Battery market: Battery Capacity Movement Analysis, 2023 & 2030
- Fig. 16 Lithium-Sulfur Battery market: Type Movement Analysis, 2023 & 2030
- Fig. 17 Lithium-Sulfur Battery market: Application Movement Analysis, 2023 & 2030
- Fig. 18 Lithium-Sulfur Battery market: Regional Movement Analysis, 2023 & 2030
- Fig. 19 Lithium-Sulfur Battery Market: Competitive Dashboard Analysis
- Fig. 20 Lithium-Sulfur Battery Market: Market Share Analysis
- Fig. 21 Lithium-Sulfur Battery Market: Market Positioning Analysis
Lithium-Sulfur Battery Market Size & Trends
The global lithium-sulfur battery market size was estimated at USD 33.80 million in 2023 and is expected to grow at a CAGR of 25.5% from 2024 to 2030. The lithium-sulfur (Li-S) battery market is primarily driven by the increasing demand for high-energy-density storage solutions in various sectors, particularly in electric vehicles (EVs) and portable electronics.
Li-S batteries offer theoretical energy densities up to five times higher than traditional lithium-ion batteries, making them a promising technology for extending the range of EVs and improving the battery life of mobile devices. For example, companies such as Oxis Energy and Sion Power have been developing Li-S batteries specifically for the automotive and aerospace industries, aiming to provide longer-lasting and lighter-weight power sources.
Another significant driving factor is the potential cost-effectiveness of Li-S batteries. Sulfur, the primary cathode material, is abundantly available and inexpensive compared to the cobalt and nickel used in conventional lithium-ion batteries. This cost advantage could lead to more affordable energy storage solutions, particularly for large-scale applications such as grid storage. Additionally, the environmental benefits of using sulfur, a byproduct of petroleum refining, align with the growing focus on sustainable and eco-friendly technologies.
However, the Li-S battery market also faces challenges that are influencing its development. The main technical hurdles include the shuttle effect, where polysulfides dissolve and migrate between electrodes, causing capacity loss. Also, the expansion of the sulfur cathode during cycling, which can lead to structural degradation. Researchers and companies are actively working on addressing these issues through advanced materials and cell designs. For instance, Stanford University scientists developed a novel coating that helps prevent the shuttle effect, potentially increasing the lifespan of Li-S batteries.
Global Lithium-Sulfur Battery Market Report Segmentation
This report forecasts revenue growth at global, regional, and country levels and provides an analysis of the latest industry trends in each of the sub-segments from 2018 to 2030. For this study, Grand View Research has segmented the lithium-sulfur battery market report based on battery capacity, type, application, and region:
- Battery Capacity Outlook (Revenue, USD Million, 2018 - 2030)
- Below 500 mAh
- 500-1000 mAh
- Above 1000 mAh
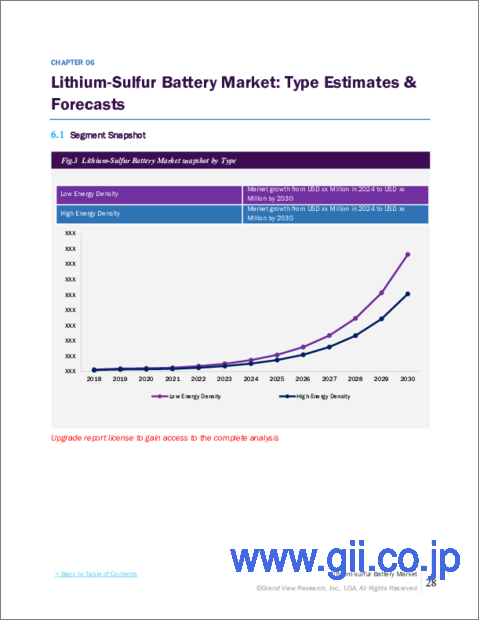
- Type Outlook (Revenue, USD Million, 2018 - 2030)
- Low Energy Density
- High Energy Density
- Application Outlook (Revenue, USD Million, 2018 - 2030)
- Automotive
- Aerospace
- Consumer Electronics
- Energy Storage Systems
- Medical Devices
- Military and Defense
- Regional Outlook (Revenue, USD Million, 2018 - 2030)
- North America
U.S.
Canada
Mexico
- Europe
Germany
UK
France
Italy
Spain
- Asia Pacific
China
India
Japan
South Korea
Australia
- Central & South America
Brazil
- Middle East & Africa
UAE
Table of Contents
Chapter 1. Methodology and Scope
- 1.1. Market Segmentation & Scope
- 1.2. Market Definition
- 1.3. Information Procurement
- 1.3.1. Purchased Database
- 1.3.2. GVR's Internal Database
- 1.3.3. Secondary Materials & Third-Party Perspectives
- 1.3.4. Primary Research
- 1.4. Information Analysis
- 1.4.1. Data Analysis Models
- 1.5. Market Formulation & Data Visualization
- 1.6. Data Validation & Publishing
- 1.7. List of Abbreviations
Chapter 2. Executive Summary
- 2.1. Market Outlook, 2023 (USD Million)
- 2.2. Segmental Outlook
- 2.3. Competitive Landscape Snapshot
Chapter 3. Lithium-Sulfur Battery Market Variables, Trends, and Scope
- 3.1. Market Lineage Outlook
- 3.2. Penetration and Growth Prospect Mapping
- 3.3. Industry Value Chain Analysis
- 3.4. Price Trend Analysis, 2018 to 2030 (USD/Unit)
- 3.4.1. Key Factors Influencing Pricing
- 3.5. Regulatory Framework
- 3.5.1. Standard & Compliance
- 3.5.2. Safety
- 3.6. Market Dynamics
- 3.6.1. Market Driver Analysis
- 3.6.2. Market Restraint Analysis
- 3.6.3. Market Challenges Analysis
- 3.6.4. Market Opportunity Analysis
- 3.7. Business Environment Analysis
- 3.7.1. Industry Analysis - Porter's Five Forces Analysis
- 3.7.2. PESTEL Analysis
Chapter 4. Lithium-Sulfur Battery Market: Battery Capacity Estimates & Trend Analysis
- 4.1. Definition & Scope
- 4.2. Battery Capacity Movement Analysis & Market Share, 2023 & 2030
- 4.3. Below 500 mAh
- 4.3.1. Market estimates and forecasts, 2018 - 2030 (USD Million)
- 4.4. 500-1000 mAh
- 4.4.1. Market estimates and forecasts, 2018 - 2030 (USD Million)
- 4.5. Above 1000 mAh
- 4.5.1. Market estimates and forecasts, 2018 - 2030 (USD Million)
Chapter 5. Lithium-Sulfur Battery Market: Type Estimates & Trend Analysis
- 5.1. Definition & Scope
- 5.2. Type Movement Analysis & Market Share, 2023 & 2030
- 5.3. Low Energy Density
- 5.3.1. Market estimates and forecasts, 2018 - 2030 (USD Million)
- 5.4. High Energy Density
- 5.4.1. Market estimates and forecasts, 2018 - 2030 (USD Million)
Chapter 6. Lithium-Sulfur Battery Market: Application Estimates & Trend Analysis
- 6.1. Definition & Scope
- 6.2. Application Movement Analysis & Market Share, 2023 & 2030
- 6.3. Automotive
- 6.3.1. Market estimates and forecasts, 2018 - 2030 (USD Million)
- 6.4. Aerospace
- 6.4.1. Market estimates and forecasts, 2018 - 2030 (USD Million)
- 6.5. Consumer Electronics
- 6.5.1. Market estimates and forecasts, 2018 - 2030 (USD Million)
- 6.6. Energy Storage Systems
- 6.6.1. Market estimates and forecasts, 2018 - 2030 (USD Million)
- 6.7. Medical Devices
- 6.7.1. Market estimates and forecasts, 2018 - 2030 (USD Million)
- 6.8. Military Defense
- 6.8.1. Market estimates and forecasts, 2018 - 2030 (USD Million)
Chapter 7. Lithium-Sulfur Battery Market: Regional Estimates & Trend Analysis
- 7.1. Key Takeaways
- 7.2. Regional Movement Analysis & Market Share, 2023 & 2030
- 7.3. North America
- 7.3.1. market estimates and forecasts, 2018 - 2030 (USD Million)
- 7.3.2. market estimates and forecasts, by battery capacity, 2018 - 2030 (USD Million)
- 7.3.3. market estimates and forecasts, by type, 2018 - 2030 (USD Million)
- 7.3.4. market estimates and forecasts, by application, 2018 - 2030 (USD Million)
- 7.3.5. U.S.
- 7.3.5.1. market estimates and forecasts, 2018 - 2030 (USD Million)
- 7.3.5.2. market estimates and forecasts, by battery capacity, 2018 - 2030 (USD Million)
- 7.3.5.3. market estimates and forecasts, by type, 2018 - 2030 (USD Million)
- 7.3.5.4. market estimates and forecasts, by application, 2018 - 2030 (USD Million)
- 7.3.6. Canada
- 7.3.6.1. market estimates and forecasts, 2018 - 2030 (USD Million)
- 7.3.6.2. market estimates and forecasts, by battery capacity, 2018 - 2030 (USD Million)
- 7.3.6.3. market estimates and forecasts, by type, 2018 - 2030 (USD Million)
- 7.3.6.4. market estimates and forecasts, by application, 2018 - 2030 (USD Million)
- 7.3.7. Mexico
- 7.3.7.1. market estimates and forecasts, 2018 - 2030 (USD Million)
- 7.3.7.2. market estimates and forecasts, by battery capacity, 2018 - 2030 (USD Million)
- 7.3.7.3. market estimates and forecasts, by type, 2018 - 2030 (USD Million)
- 7.3.7.4. market estimates and forecasts, by application, 2018 - 2030 (USD Million)
- 7.4. Europe
- 7.4.1. market estimates and forecasts, 2018 - 2030 (USD Million)
- 7.4.2. market estimates and forecasts, by battery capacity, 2018 - 2030 (USD Million)
- 7.4.3. market estimates and forecasts, by type, 2018 - 2030 (USD Million)
- 7.4.4. market estimates and forecasts, by application, 2018 - 2030 (USD Million)
- 7.4.5. Germany
- 7.4.5.1. market estimates and forecasts, 2018 - 2030 (USD Million)
- 7.4.5.2. market estimates and forecasts, by battery capacity, 2018 - 2030 (USD Million)
- 7.4.5.3. market estimates and forecasts, by type, 2018 - 2030 (USD Million)
- 7.4.5.4. market estimates and forecasts, by application, 2018 - 2030 (USD Million)
- 7.4.6. U.K.
- 7.4.6.1. market estimates and forecasts, 2018 - 2030 (USD Million)
- 7.4.6.2. market estimates and forecasts, by battery capacity, 2018 - 2030 (USD Million)
- 7.4.6.3. market estimates and forecasts, by type, 2018 - 2030 (USD Million)
- 7.4.6.4. market estimates and forecasts, by application, 2018 - 2030 (USD Million)
- 7.4.7. France
- 7.4.7.1. market estimates and forecasts, 2018 - 2030 (USD Million)
- 7.4.7.2. market estimates and forecasts, by battery capacity, 2018 - 2030 (USD Million)
- 7.4.7.3. market estimates and forecasts, by type, 2018 - 2030 (USD Million)
- 7.4.7.4. market estimates and forecasts, by application, 2018 - 2030 (USD Million)
- 7.4.8. Italy
- 7.4.8.1. market estimates and forecasts, 2018 - 2030 (USD Million)
- 7.4.8.2. market estimates and forecasts, by battery capacity, 2018 - 2030 (USD Million)
- 7.4.8.3. market estimates and forecasts, by type, 2018 - 2030 (USD Million)
- 7.4.8.4. market estimates and forecasts, by application, 2018 - 2030 (USD Million)
- 7.4.9. Spain
- 7.4.9.1. market estimates and forecasts, 2018 - 2030 (USD Million)
- 7.4.9.2. market estimates and forecasts, by battery capacity, 2018 - 2030 (USD Million)
- 7.4.9.3. market estimates and forecasts, by type, 2018 - 2030 (USD Million)
- 7.4.9.4. market estimates and forecasts, by application, 2018 - 2030 (USD Million)
- 7.5. Asia Pacific
- 7.5.1. market estimates and forecasts, 2018 - 2030 (USD Million)
- 7.5.2. market estimates and forecasts, by battery capacity, 2018 - 2030 (USD Million)
- 7.5.3. market estimates and forecasts, by type, 2018 - 2030 (USD Million)
- 7.5.4. market estimates and forecasts, by application, 2018 - 2030 (USD Million)
- 7.5.5. China
- 7.5.5.1. market estimates and forecasts, 2018 - 2030 (USD Million)
- 7.5.5.2. market estimates and forecasts, by battery capacity, 2018 - 2030 (USD Million)
- 7.5.5.3. market estimates and forecasts, by type, 2018 - 2030 (USD Million)
- 7.5.5.4. market estimates and forecasts, by application, 2018 - 2030 (USD Million)
- 7.5.6. India
- 7.5.6.1. market estimates and forecasts, 2018 - 2030 (USD Million)
- 7.5.6.2. market estimates and forecasts, by battery capacity, 2018 - 2030 (USD Million)
- 7.5.6.3. market estimates and forecasts, by type, 2018 - 2030 (USD Million)
- 7.5.6.4. market estimates and forecasts, by application, 2018 - 2030 (USD Million)
- 7.5.7. Japan
- 7.5.7.1. market estimates and forecasts, 2018 - 2030 (USD Million)
- 7.5.7.2. market estimates and forecasts, by battery capacity, 2018 - 2030 (USD Million)
- 7.5.7.3. market estimates and forecasts, by type, 2018 - 2030 (USD Million)
- 7.5.7.4. market estimates and forecasts, by application, 2018 - 2030 (USD Million)
- 7.5.8. South Korea
- 7.5.8.1. market estimates and forecasts, 2018 - 2030 (USD Million)
- 7.5.8.2. market estimates and forecasts, by battery capacity, 2018 - 2030 (USD Million)
- 7.5.8.3. market estimates and forecasts, by type, 2018 - 2030 (USD Million)
- 7.5.8.4. market estimates and forecasts, by application, 2018 - 2030 (USD Million)
- 7.5.9. Australia
- 7.5.9.1. market estimates and forecasts, 2018 - 2030 (USD Million)
- 7.5.9.2. market estimates and forecasts, by battery capacity, 2018 - 2030 (USD Million)
- 7.5.9.3. market estimates and forecasts, by type, 2018 - 2030 (USD Million)
- 7.5.9.4. market estimates and forecasts, by application, 2018 - 2030 (USD Million)
- 7.6. Central & South America
- 7.6.1. market estimates and forecasts, 2018 - 2030 (USD Million)
- 7.6.2. market estimates and forecasts, by battery capacity, 2018 - 2030 (USD Million)
- 7.6.3. market estimates and forecasts, by type, 2018 - 2030 (USD Million)
- 7.6.4. market estimates and forecasts, by application, 2018 - 2030 (USD Million)
- 7.6.5. Brazil
- 7.6.5.1. market estimates and forecasts, 2018 - 2030 (USD Million)
- 7.6.5.2. market estimates and forecasts, by battery capacity, 2018 - 2030 (USD Million)
- 7.6.5.3. market estimates and forecasts, by type, 2018 - 2030 (USD Million)
- 7.6.5.4. market estimates and forecasts, by application, 2018 - 2030 (USD Million)
- 7.7. Middle East & Africa
- 7.7.1. market estimates and forecasts, 2018 - 2030 (USD Million)
- 7.7.2. market estimates and forecasts, by battery capacity, 2018 - 2030 (USD Million)
- 7.7.3. market estimates and forecasts, by type, 2018 - 2030 (USD Million)
- 7.7.4. market estimates and forecasts, by application, 2018 - 2030 (USD Million)
- 7.7.5. UAE
- 7.7.5.1. market estimates and forecasts, 2018 - 2030 (USD Million)
- 7.7.5.2. market estimates and forecasts, by battery capacity, 2018 - 2030 (USD Million)
- 7.7.5.3. market estimates and forecasts, by type, 2018 - 2030 (USD Million)
- 7.7.5.4. market estimates and forecasts, by application, 2018 - 2030 (USD Million)
Chapter 8. Competitive Landscape
- 8.1. Key Players & Recent Developments & Their Impact on the Industry
- 8.2. Key Company/Competition Categorization
- 8.3. List of key Components Suppliers and Channel Partners
- 8.4. Company Market Share & Position Analysis, 2023
- 8.5. Company Heat Map Analysis
- 8.6. Competitive Dashboard Analysis
- 8.7. Strategy Mapping
- 8.7.1. Collaboration/ Partnerships/ Agreements
- 8.7.2. New Product launches
- 8.7.3. Mergers & Acquisitions
- 8.7.4. Research & Development
- 8.7.5. Others
- 8.8. Company Listing/Profiles
- 8.8.1. PolyPlus Battery Company
- 8.8.1.1. Company Overview
- 8.8.1.2. Financial Performance
- 8.8.1.3. Product Benchmarking
- 8.8.2. NexTech Batteries Inc.
- 8.8.2.1. Company Overview
- 8.8.2.2. Financial Performance
- 8.8.2.3. Product Benchmarking
- 8.8.3. Li-S Energy Limited
- 8.8.3.1. Company Overview
- 8.8.3.2. Financial Performance
- 8.8.3.3. Product Benchmarking
- 8.8.4. Zeta Energy LLC
- 8.8.4.1. Company Overview
- 8.8.4.2. Financial Performance
- 8.8.4.3. Product Benchmarking
- 8.8.5. GS Yuasa Corporation
- 8.8.5.1. Company Overview
- 8.8.5.2. Financial Performance
- 8.8.5.3. Product Benchmarking
- 8.8.6. LG Energy Solutions Ltd.
- 8.8.6.1. Company Overview
- 8.8.6.2. Financial Performance
- 8.8.6.3. Product Benchmarking
- 8.8.7. Saft Groupe SA
- 8.8.7.1. Company Overview
- 8.8.7.2. Financial Performance
- 8.8.7.3. Product Benchmarking
- 8.8.8. Gelion PLC
- 8.8.8.1. Company Overview
- 8.8.8.2. Financial Performance
- 8.8.8.3. Product Benchmarking
- 8.8.9. Sion Power Corporation
- 8.8.9.1. Company Overview
- 8.8.9.2. Financial Performance
- 8.8.9.3. Product Benchmarking
- 8.8.10. Johnson Matthey
- 8.8.10.1. Company Overview
- 8.8.10.2. Financial Performance
- 8.8.10.3. Product Benchmarking
- 8.8.11. Giner, Inc.
- 8.8.11.1. Company Overview
- 8.8.11.2. Financial Performance
- 8.8.11.3. Product Benchmarking
- 8.8.12. Lynntech, Inc.
- 8.8.12.1. Company Overview
- 8.8.12.2. Financial Performance
- 8.8.12.3. Product Benchmarking
- 8.8.13. Ilika Technologies
- 8.8.13.1. Company Overview
- 8.8.13.2. Financial Performance
- 8.8.13.3. Product Benchmarking
- 8.8.14. Williams Advanced Engineering
- 8.8.14.1. Company Overview
- 8.8.14.2. Financial Performance
- 8.8.14.3. Product Benchmarking
- 8.8.15. Guang Dong Xiaowei New Energy Technology Co., Ltd.
- 8.8.15.1. Company Overview
- 8.8.15.2. Financial Performance
- 8.8.15.3. Product Benchmarking
- 8.8.1. PolyPlus Battery Company

