|
|
市場調査レポート
商品コード
1446559
外来血圧モニタリング機器市場規模、シェア、動向分析レポート:製品タイプ別、最終用途別、地域別、セグメント別予測、2024年~2030年Ambulatory Blood Pressure Monitoring Devices Market Size, Share & Trends Analysis Report By Product, By Type, By End-use, By Region, And Segment Forecasts, 2024 - 2030 |
||||||
|
|||||||
カスタマイズ可能
|
|||||||

| 外来血圧モニタリング機器市場規模、シェア、動向分析レポート:製品タイプ別、最終用途別、地域別、セグメント別予測、2024年~2030年 |
|
出版日: 2024年02月28日
発行: Grand View Research
ページ情報: 英文 60 Pages
納期: 2~10営業日
|

全表示
- 概要
- 図表
- 目次
外来血圧モニタリング機器市場の成長と動向:
Grand View Research, Inc.の最新調査によると、世界の外来血圧モニタリング機器市場規模は2024年から2030年にかけてCAGR 8.45%で拡大し、2030年には18億7,000万米ドルに達する見込みです。
この市場の成長を加速させる原動力には、老人人口の増加、高血圧などの慢性疾患の蔓延、世界の技術進歩などがあります。WHOが発表した統計によると、約11億3,000万人が高血圧に罹患しているとみられ、年間760万人が死亡しています。
さらに、高血圧はこの10年間で、出血性脳卒中や冠状動脈性心臓病の主要な危険因子となっています。例えば、WHOによれば、全世界で30~79歳の推定12億8,000万人の成人が高血圧を患っているが、高血圧を患っている成人の42.0%は、自分が高血圧であることに気づいていないです。高血圧は、最も有病率が高いだけでなく、心血管疾患、早期死亡、身体障害の主な原因でもあります。経済的にも大きな負担となっています。
高齢化も市場の成長を加速させる要因です。2022年10月に発表されたWHOの最新統計データによると、2030年までに世界で6人に1人が60歳以上になり、この数は2050年までに倍増します。さらに、心血管疾患は高齢者人口に非常に多く見られます。
また、外来血圧モニタリング(ABPM)装置の技術的進歩が、予測期間中に市場を押し上げる可能性が高いです。デジタル技術をベースとしたモバイル血圧計の製造が消費者の需要を煽っています。新興国市場の主なプレーヤーは、コストに優しく、革新的で使いやすい機器の開発に一貫して注力しており、これが市場の需要を強化するものと思われます。
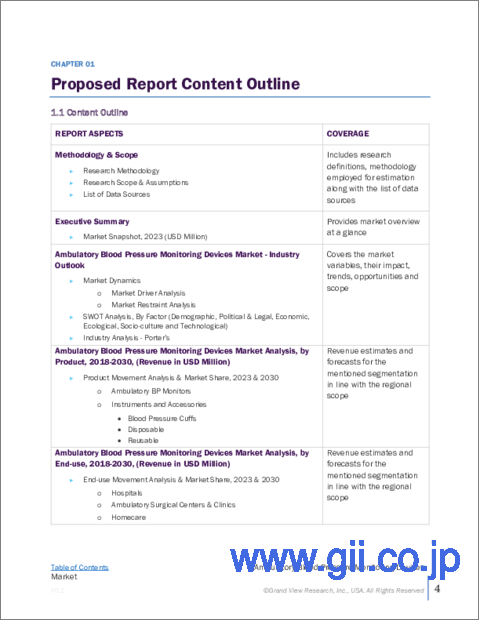
外来血圧モニタリング機器市場レポートハイライト
- 製品別では、ウェアラブル技術、アプリ、モバイルの改善などの絶え間ない技術的進歩、アクセスのしやすさ、使用の簡便性により、機器および付属品が市場を独占し、2023年の世界収益の67.5%を占めました。
- タイプ別では、血圧カフが提供する高い精度、データ収集の信頼性、使用の柔軟性により、血圧カフセグメントが2023年に56.3%の収益シェアで市場を独占しました。
- 最終用途別では、外来手術センター&クリニックが、滞在時間の短さとコスト削減による外来手術件数の増加により、2023年のABPM機器市場で63.7%の最大シェアを占めました。
- 地域別では、主要企業による製品上市の増加、全体的なヘルスケア支出の増加、複数の規制承認の増加により、北米が2023年に39.5%の収益シェアを占めてABPMデバイスの世界市場を独占しました。
目次
第1章 調査手法と範囲
第2章 エグゼクティブサマリー
第3章 外来血圧モニタリング機器の市場変数、動向および範囲
- 市場系統の見通し
- 親市場の見通し
- 関連/付随市場の見通し
- 市場力学
- 市場促進要因分析
- 市場抑制要因分析
- 市場機会分析
- 外来血圧モニタリング機器市場分析ツール
- 業界分析- ポーターのファイブフォース分析
- PESTEL分析
- 外来血圧モニタリング機器市場:地域別の普及率データ
- 北米
- 欧州
- アジア太平洋地域
- ラテンアメリカ
- 中東およびアフリカ(MEA)
第4章 外来血圧モニタリング機器市場:製品推定・動向分析
- 製品市場シェア、2023年と2030年
- セグメントダッシュボード
- 製品別の世界の外来血圧モニタリング機器市場の見通し
- 市場規模、予測および動向分析、2018年から2030年まで
第5章 外来血圧モニタリング機器市場:タイプの推定・動向分析
- タイプ市場シェア、2023年および2030年
- セグメントダッシュボード
- タイプ別の世界の外来血圧モニタリング機器市場の見通し
- 市場規模、予測および動向分析、2018年から2030年まで
第6章 外来血圧モニタリング機器市場:最終用途の推定・動向分析
- 最終用途市場シェア、2023年および2030年
- セグメントダッシュボード
- 最終用途別の世界の外来血圧モニタリング機器市場の見通し
- 市場規模、予測および動向分析、2018年から2030年まで
第7章 外来血圧モニタリング機器市場:地域推定・動向分析
- 地域市場シェア分析、2023年および2030年
- 地域市場ダッシュボード
- 世界の地域市場のスナップショット
- 市場規模と予測トレンド分析、2018年から2030年:
- 北米
- 米国
- カナダ
- 欧州
- 英国
- ドイツ
- フランス
- イタリア
- スペイン
- ノルウェー
- スウェーデン
- デンマーク
- アジア太平洋地域
- 日本
- 中国
- インド
- オーストラリア
- 韓国
- タイ
- ラテンアメリカ
- ブラジル
- メキシコ
- アルゼンチン
- 中東・アフリカ
- 南アフリカ
- サウジアラビア
- アラブ首長国連邦
- クウェート
第8章 競合情勢
- 主要市場参入企業による最近の動向と影響分析
- 会社/競合の分類
- ベンダー情勢
- List of key distributors and channel partners
- Key customers
- Key company market share analysis, 2023
- Omron Healthcare Welch Allyn, Inc.
- A&D Medical Inc.
- Microlife Corporation
- Daray Medical
- Withings
- Briggs Healthcare
- GE Healthcare
- Rossmax International Ltd.
- GF Health Products Inc
- Spacelabs Healthcare Inc.
- Philips Healthcare
- Biobeat
- Spacelabs Healthcare Inc
- Bosch &Sohn GmbH &Co. KG
- GE Company,
- Schiller AG
- DAIFUKU CO. LTD
List of Tables
- Table 1. List of abbreviation
- Table 2. North America Ambulatory Blood Pressure Monitoring Devices Market, by country, 2018 - 2030 (USD Million) (Number of Patients Treated in Thousands)
- Table 3. North America Ambulatory Blood Pressure Monitoring Devices Market, by Product , 2018 - 2030 (USD Million)
- Table 4. North America Ambulatory Blood Pressure Monitoring Devices Market, by treatment, 2018 - 2030 (USD Million)
- Table 5. North America Ambulatory Blood Pressure Monitoring Devices Market, by end-use, 2018 - 2030 (USD Million)
- Table 6. U.S. Ambulatory Blood Pressure Monitoring Devices Market, by Product , 2018 - 2030 (USD Million)
- Table 7. U.S. Ambulatory Blood Pressure Monitoring Devices Market, by treatment, 2018 - 2030 (USD Million)
- Table 8. U.S. Ambulatory Blood Pressure Monitoring Devices Market, by end-use, 2018 - 2030 (USD Million)
- Table 9. Canada Ambulatory Blood Pressure Monitoring Devices Market, by Product , 2018 - 2030 (USD Million)
- Table 10. Canada Ambulatory Blood Pressure Monitoring Devices Market, by treatment, 2018 - 2030 (USD Million)
- Table 11. Canada Ambulatory Blood Pressure Monitoring Devices Market, by end-use, 2018 - 2030 (USD Million)
- Table 12. Europe Ambulatory Blood Pressure Monitoring Devices Market, by country, 2018 - 2030 (USD Million) (Number of Patients Treated in Thousands)
- Table 13. Europe Ambulatory Blood Pressure Monitoring Devices Market, by Product , 2018 - 2030 (USD Million)
- Table 14. Europe Ambulatory Blood Pressure Monitoring Devices Market, by treatment, 2018 - 2030 (USD Million)
- Table 15. Europe Ambulatory Blood Pressure Monitoring Devices Market, by end-use, 2018 - 2030 (USD Million)
- Table 16. Germany Ambulatory Blood Pressure Monitoring Devices Market, by Product , 2018 - 2030 (USD Million)
- Table 17. Germany Ambulatory Blood Pressure Monitoring Devices Market, by treatment, 2018 - 2030 (USD Million)
- Table 18. Germany Ambulatory Blood Pressure Monitoring Devices Market, by end-use, 2018 - 2030 (USD Million)
- Table 19. UK Ambulatory Blood Pressure Monitoring Devices Market, by Product , 2018 - 2030 (USD Million)
- Table 20. UK Ambulatory Blood Pressure Monitoring Devices Market, by treatment, 2018 - 2030 (USD Million)
- Table 21. UK Ambulatory Blood Pressure Monitoring Devices Market, by end-use, 2018 - 2030 (USD Million)
- Table 22. France Ambulatory Blood Pressure Monitoring Devices Market, by Product , 2018 - 2030 (USD Million)
- Table 23. France Ambulatory Blood Pressure Monitoring Devices Market, by treatment, 2018 - 2030 (USD Million)
- Table 24. France Ambulatory Blood Pressure Monitoring Devices Market, by end-use, 2018 - 2030 (USD Million)
- Table 25. Italy Ambulatory Blood Pressure Monitoring Devices Market, by Product , 2018 - 2030 (USD Million)
- Table 26. Italy Ambulatory Blood Pressure Monitoring Devices Market, by treatment, 2018 - 2030 (USD Million)
- Table 27. Italy Ambulatory Blood Pressure Monitoring Devices Market, by end-use, 2018 - 2030 (USD Million)
- Table 28. Spain Ambulatory Blood Pressure Monitoring Devices Market, by Product , 2018 - 2030 (USD Million)
- Table 29. Spain Ambulatory Blood Pressure Monitoring Devices Market, by treatment, 2018 - 2030 (USD Million)
- Table 30. Spain Ambulatory Blood Pressure Monitoring Devices Market, by end-use, 2018 - 2030 (USD Million)
- Table 31. Denmark Ambulatory Blood Pressure Monitoring Devices Market, by Product , 2018 - 2030 (USD Million)
- Table 32. Denmark Ambulatory Blood Pressure Monitoring Devices Market, by treatment, 2018 - 2030 (USD Million)
- Table 33. Denmark Ambulatory Blood Pressure Monitoring Devices Market, by end-use, 2018 - 2030 (USD Million)
- Table 34. Sweden Ambulatory Blood Pressure Monitoring Devices Market, by Product , 2018 - 2030 (USD Million)
- Table 35. Sweden Ambulatory Blood Pressure Monitoring Devices Market, by treatment, 2018 - 2030 (USD Million)
- Table 36. Sweden Ambulatory Blood Pressure Monitoring Devices Market, by end-use, 2018 - 2030 (USD Million)
- Table 37. Norway Ambulatory Blood Pressure Monitoring Devices Market, by Product , 2018 - 2030 (USD Million)
- Table 38. Norway Ambulatory Blood Pressure Monitoring Devices Market, by treatment, 2018 - 2030 (USD Million)
- Table 39. Norway Ambulatory Blood Pressure Monitoring Devices Market, by end-use, 2018 - 2030 (USD Million)
- Table 40. Asia Pacific Ambulatory Blood Pressure Monitoring Devices Market, by country, 2018 - 2030 (USD Million) (Number of Patients Treated in Thousands)
- Table 41. Asia Pacific Ambulatory Blood Pressure Monitoring Devices Market, by Product , 2018 - 2030 (USD Million)
- Table 42. Asia Pacific Ambulatory Blood Pressure Monitoring Devices Market, by treatment, 2018 - 2030 (USD Million)
- Table 43. Asia Pacific Ambulatory Blood Pressure Monitoring Devices Market, by end-use, 2018 - 2030 (USD Million)
- Table 44. China Ambulatory Blood Pressure Monitoring Devices Market, by Product , 2018 - 2030 (USD Million)
- Table 45. China Ambulatory Blood Pressure Monitoring Devices Market, by treatment, 2018 - 2030 (USD Million)
- Table 46. China Ambulatory Blood Pressure Monitoring Devices Market, by end-use, 2018 - 2030 (USD Million)
- Table 47. Japan Ambulatory Blood Pressure Monitoring Devices Market, by Product , 2018 - 2030 (USD Million)
- Table 48. Japan Ambulatory Blood Pressure Monitoring Devices Market, by treatment, 2018 - 2030 (USD Million)
- Table 49. Japan Ambulatory Blood Pressure Monitoring Devices Market, by end-use, 2018 - 2030 (USD Million)
- Table 50. India Ambulatory Blood Pressure Monitoring Devices Market, by Product , 2018 - 2030 (USD Million)
- Table 51. India Ambulatory Blood Pressure Monitoring Devices Market, by treatment, 2018 - 2030 (USD Million)
- Table 52. India Ambulatory Blood Pressure Monitoring Devices Market, by end-use, 2018 - 2030 (USD Million)
- Table 53. South Korea Ambulatory Blood Pressure Monitoring Devices Market, by Product , 2018 - 2030 (USD Million)
- Table 54. South Korea Ambulatory Blood Pressure Monitoring Devices Market, by treatment, 2018 - 2030 (USD Million)
- Table 55. South Korea Ambulatory Blood Pressure Monitoring Devices Market, by end-use, 2018 - 2030 (USD Million)
- Table 56. Australia Ambulatory Blood Pressure Monitoring Devices Market, by Product , 2018 - 2030 (USD Million)
- Table 57. Australia Ambulatory Blood Pressure Monitoring Devices Market, by treatment, 2018 - 2030 (USD Million)
- Table 58. Australia Ambulatory Blood Pressure Monitoring Devices Market, by end-use, 2018 - 2030 (USD Million)
- Table 59. Thailand Ambulatory Blood Pressure Monitoring Devices Market, by Product , 2018 - 2030 (USD Million)
- Table 60. Thailand Ambulatory Blood Pressure Monitoring Devices Market, by treatment, 2018 - 2030 (USD Million)
- Table 61. Thailand Ambulatory Blood Pressure Monitoring Devices Market, by end-use, 2018 - 2030 (USD Million)
- Table 62. Latin America Ambulatory Blood Pressure Monitoring Devices Market, by country, 2018 - 2030 (USD Million) (Number of Patients Treated in Thousands)
- Table 63. Latin America Ambulatory Blood Pressure Monitoring Devices Market, by Product , 2018 - 2030 (USD Million)
- Table 64. Latin America Ambulatory Blood Pressure Monitoring Devices Market, by treatment, 2018 - 2030 (USD Million)
- Table 65. Latin America Ambulatory Blood Pressure Monitoring Devices Market, by end-use, 2018 - 2030 (USD Million)
- Table 66. Brazil Ambulatory Blood Pressure Monitoring Devices Market, by Product , 2018 - 2030 (USD Million)
- Table 67. Brazil Ambulatory Blood Pressure Monitoring Devices Market, by treatment, 2018 - 2030 (USD Million)
- Table 68. Brazil Ambulatory Blood Pressure Monitoring Devices Market, by end-use, 2018 - 2030 (USD Million)
- Table 69. Mexico Ambulatory Blood Pressure Monitoring Devices Market, by Product , 2018 - 2030 (USD Million)
- Table 70. Mexico Ambulatory Blood Pressure Monitoring Devices Market, by treatment, 2018 - 2030 (USD Million)
- Table 71. Mexico Ambulatory Blood Pressure Monitoring Devices Market, by end-use, 2018 - 2030 (USD Million)
- Table 72. Argentina Ambulatory Blood Pressure Monitoring Devices Market, by Product , 2018 - 2030 (USD Million)
- Table 73. Argentina Ambulatory Blood Pressure Monitoring Devices Market, by treatment, 2018 - 2030 (USD Million)
- Table 74. Argentina Ambulatory Blood Pressure Monitoring Devices Market, by end-use, 2018 - 2030 (USD Million)
- Table 75. MEA Ambulatory Blood Pressure Monitoring Devices Market, by country, 2018 - 2030 (USD Million) (Number of Patients Treated in Thousands)
- Table 76. MEA Ambulatory Blood Pressure Monitoring Devices Market, by Product , 2018 - 2030 (USD Million)
- Table 77. MEA Ambulatory Blood Pressure Monitoring Devices Market, by treatment, 2018 - 2030 (USD Million)
- Table 78. MEA Ambulatory Blood Pressure Monitoring Devices Market, by end-use, 2018 - 2030 (USD Million)
- Table 79. South Africa Ambulatory Blood Pressure Monitoring Devices Market, by Product , 2018 - 2030 (USD Million)
- Table 80. South Africa Ambulatory Blood Pressure Monitoring Devices Market, by treatment, 2018 - 2030 (USD Million)
- Table 81. South Africa Ambulatory Blood Pressure Monitoring Devices Market, by end-use, 2018 - 2030 (USD Million)
- Table 82. Saudi Arabia Ambulatory Blood Pressure Monitoring Devices Market, by Product , 2018 - 2030 (USD Million)
- Table 83. Saudi Arabia Ambulatory Blood Pressure Monitoring Devices Market, by treatment, 2018 - 2030 (USD Million)
- Table 84. Saudi Arabia Ambulatory Blood Pressure Monitoring Devices Market, by end-use, 2018 - 2030 (USD Million)
- Table 85. UAE Ambulatory Blood Pressure Monitoring Devices Market, by Product , 2018 - 2030 (USD Million)
- Table 86. UAE Ambulatory Blood Pressure Monitoring Devices Market, by treatment, 2018 - 2030 (USD Million)
- Table 87. UAE Ambulatory Blood Pressure Monitoring Devices Market, by end-use, 2018 - 2030 (USD Million)
- Table 88. Kuwait Ambulatory Blood Pressure Monitoring Devices Market, by Product , 2018 - 2030 (USD Million)
- Table 89. Kuwait Ambulatory Blood Pressure Monitoring Devices Market, by treatment, 2018 - 2030 (USD Million)
- Table 90. Kuwait Ambulatory Blood Pressure Monitoring Devices Market, by end-use, 2018 - 2030 (USD Million)
List of Figures
- Fig. 1 Ambulatory Blood Pressure Monitoring Devices Market segmentation
- Fig. 2 Market research process
- Fig. 3 Data triangulation techniques
- Fig. 4 Primary research pattern
- Fig. 5 Value chain based sizing & forecasting
- Fig. 6 QFD modelling for market share assessment
- Fig. 7 Market formulation & validation
- Fig. 8 Market snapshot
- Fig. 9 Competitive landscape snapshot
- Fig. 10 Market dynamics
- Fig. 11 Prevalence of rheumatoid arthritis in 2022, by WHO regions
- Fig. 12 Porter's five forces analysis
- Fig. 13 PESTLE analysis
- Fig. 14 Ambulatory Blood Pressure Monitoring Devices Market: Products outlook and key takeaways
- Fig. 15 Ambulatory Blood Pressure Monitoring Devices Market: Product movement analysis
- Fig. 16 Ambulatory blood pressure monitors market estimates and forecast, 2018 - 2030 (USD Million)
- Fig. 17 Instrument & accessories market estimates and forecast, 2018 - 2030 (USD Million)
- Fig. 18 Ambulatory Blood Pressure Monitoring Devices Market: Type outlook and key takeaways
- Fig. 19 Ambulatory Blood Pressure Monitoring Devices Market: Type movement analysis
- Fig. 20 Blood Pressure Cuffs market estimates and forecast, 2018 - 2030 (USD Million)
- Fig. 21 Others market estimates and forecast, 2018 - 2030, USD Million
- Fig. 22 Ambulatory Blood Pressure Monitoring Devices Market: End-use outlook and key takeaways
- Fig. 23 Ambulatory Blood Pressure Monitoring Devices Market: End-use movement analysis
- Fig. 24 Hospitals market estimates and forecast, 2018 - 2030 (USD Million)
- Fig. 25 Ambulatory Surgical Centers & Clinics market estimates and forecast, 2018 - 2030 (USD Million)
- Fig. 26 Home-care settings market estimates and forecast, 2018 - 2030 (USD Million)
- Fig. 27 Provincial marketplace: Key takeaways (1/2)
- Fig. 28 Provincial marketplace: Key takeaways (2/2)
- Fig. 29 North America Ambulatory Blood Pressure Monitoring Devices Market estimates and forecasts, 2018 - 2030 (USD Million) (Number of Patients Treated in Thousands)
- Fig. 30 Key country dynamics
- Fig. 31 U.S. ambulatoryblood pressure monitoring market estimates and forecasts, 2018 - 2030 (USD Million) (Number of Patients Treated in Thousands)
- Fig. 32 Key country dynamics
- Fig. 33 Canada ambulatoryblood pressure monitoring market estimates and forecasts, 2018 - 2030 (USD Million) (Number of Patients Treated in Thousands)
- Fig. 34 Europe Ambulatory Blood Pressure Monitoring Devices Market estimates and forecasts, 2018 - 2030 (USD Million) (Number of Patients Treated in Thousands)
- Fig. 35 Key country dynamics
- Fig. 36 UK Ambulatory Blood Pressure Monitoring Devices Market estimates and forecasts, 2018 - 2030 (USD Million) (Number of Patients Treated in Thousands)
- Fig. 37 Key country dynamics
- Fig. 38 Germany Ambulatory Blood Pressure Monitoring Devices Market estimates and forecasts, 2018 - 2030 (USD Million) (Number of Patients Treated in Thousands)
- Fig. 39 Key country dynamics
- Fig. 40 France Ambulatory Blood Pressure Monitoring Devices Market estimates and forecasts, 2018 - 2030 (USD Million) (Number of Patients Treated in Thousands)
- Fig. 41 Key country dynamics
- Fig. 42 Spain Ambulatory Blood Pressure Monitoring Devices Market estimates and forecasts, 2018 - 2030 (USD Million) (Number of Patients Treated in Thousands)
- Fig. 43 Key country dynamics
- Fig. 44 Italy Ambulatory Blood Pressure Monitoring Devices Market estimates and forecasts, 2018 - 2030 (USD Million) (Number of Patients Treated in Thousands)
- Fig. 45 Key country dynamics
- Fig. 46 Denmark Ambulatory Blood Pressure Monitoring Devices Market estimates and forecasts, 2018 - 2030 (USD Million) (Number of Patients Treated in Thousands)
- Fig. 47 Key country dynamics
- Fig. 48 Sweden Ambulatory Blood Pressure Monitoring Devices Market estimates and forecasts, 2018 - 2030 (USD Million) (Number of Patients Treated in Thousands)
- Fig. 49 Key country dynamics
- Fig. 50 Norway Ambulatory Blood Pressure Monitoring Devices Market estimates and forecasts, 2018 - 2030 (USD Million) (Number of Patients Treated in Thousands)
- Fig. 51 Rest of Europe Ambulatory Blood Pressure Monitoring Devices Market estimates and forecasts, 2018 - 2030, (USD million) (Number of Patients Treated in Thousands)
- Fig. 52 Asia Pacific ambulatory blood pressure monitoring market estimates and forecasts, 2018 - 2030 (USD Million) (Number of Patients Treated in Thousands)
- Fig. 53 Key country dynamics
- Fig. 54 Reimbursement scenario
- Fig. 55 Japan Ambulatory Blood Pressure Monitoring Devices Market estimates and forecasts, 2018 - 2030 (USD Million) (Number of Patients Treated in Thousands)
- Fig. 56 Key country dynamics
- Fig. 57 Regulatory framework
- Fig. 58 Reimbursement scenario
- Fig. 59 China Ambulatory Blood Pressure Monitoring Devices Market estimates and forecasts, 2018 - 2030 (USD Million) (Number of Patients Treated in Thousands)
- Fig. 60 Key country dynamics
- Fig. 61 Reimbursement scenario
- Fig. 62 India ambulatory blood pressure monitoring market estimates and forecasts, 2018 - 2030 (USD Million) (Number of Patients Treated in Thousands)
- Fig. 63 Key country dynamics
- Fig. 64 Australia Ambulatory Blood Pressure Monitoring Devices Market estimates and forecasts, 2018 - 2030 (USD Million) (Number of Patients Treated in Thousands)
- Fig. 65 Key country dynamics
- Fig. 66 South Korea Ambulatory Blood Pressure Monitoring Devices Market estimates and forecasts, 2018 -2030, (USD million) (Number of Patients Treated in Thousands)
- Fig. 67 Key country dynamics
- Fig. 68 Thailand ambulatoryblood pressure monitoring market estimates and forecasts, 2018 - 2030 (USD Million) (Number of Patients Treated in Thousands)
- Fig. 69 Key country dynamics
- Fig. 70 Malaysia Ambulatory Blood Pressure Monitoring Devices Market estimates and forecasts, 2018 - 2030 (USD Million) (Number of Patients Treated in Thousands)
- Fig. 71 Key country dynamics
- Fig. 72 Vietnam Ambulatory Blood Pressure Monitoring Devices Market estimates and forecasts, 2018 - 2030 (USD Million) (Number of Patients Treated in Thousands)
- Fig. 73 Key country dynamics
- Fig. 74 Philippines Ambulatory Blood Pressure Monitoring Devices Market estimates and forecasts, 2018 - 2030 (USD Million) (Number of Patients Treated in Thousands)
- Fig. 75 Rest of Asia Pacific Ambulatory Blood Pressure Monitoring Devices Market estimates and forecasts, 2018 - 2030, (USD million) (Number of Patients Treated in Thousands)
- Fig. 76 Latin America Ambulatory Blood Pressure Monitoring Devices Market estimates and forecasts, 2018 - 2030 (USD Million) (Number of Patients Treated in Thousands)
- Fig. 77 Key country dynamics
- Fig. 78 Brazil regulation details
- Fig. 79 Reimbursement scenario
- Fig. 80 Brazil Ambulatory Blood Pressure Monitoring Devices Market estimates and forecasts, 2018 - 2030 (USD Million) (Number of Patients Treated in Thousands)
- Fig. 81 Key country dynamics
- Fig. 82 Argentina pharmaceuticals registration details
- Fig. 83 Argentina Ambulatory Blood Pressure Monitoring Devices Market estimates and forecasts, 2018 - 2030 (USD million) (Number of Patients Treated in Thousands)
- Fig. 84 Key country dynamics
- Fig. 85 Regulatory framework
- Fig. 86 Reimbursement scenario
- Fig. 87 Mexico Ambulatory Blood Pressure Monitoring Devices Market estimates and forecasts, 2018 - 2030 (USD Million) (Number of Patients Treated in Thousands)
- Fig. 88 Rest of Latin America Ambulatory Blood Pressure Monitoring Devices Market estimates and forecasts, 2018 - 2030, (USD million) (Number of Patients Treated in Thousands)
- Fig. 89 MEA Ambulatory Blood Pressure Monitoring Devices Market estimates and forecasts, 2018 - 2030, (USD million)
- Fig. 90 Key country dynamics
- Fig. 91 South Africa Ambulatory Blood Pressure Monitoring Devices Market estimates and forecasts, 2018 - 2030 (USD Million) (Number of Patients Treated in Thousands)
- Fig. 92 Key country dynamics
- Fig. 93 Saudi Arabia Ambulatory Blood Pressure Monitoring Devices Market estimates and forecasts, 2018 - 2030 (USD Million) (Number of Patients Treated in Thousands)
- Fig. 94 Key country dynamics
- Fig. 95 UAE Ambulatory Blood Pressure Monitoring Devices Market estimates and forecasts, 2018 - 2030 (USD Million) (Number of Patients Treated in Thousands)
- Fig. 96 Key country dynamics
- Fig. 97 Kuwait Ambulatory Blood Pressure Monitoring Devices Market estimates and forecasts, 2018 - 2030 (USD Million) (Number of Patients Treated in Thousands)
- Fig. 98 Key country dynamics
- Fig. 99 Turkey Ambulatory Blood Pressure Monitoring Devices Market estimates and forecasts, 2018 - 2030 (USD Million) (Number of Patients Treated in Thousands)
- Fig. 100 Rest of MEA Ambulatory Blood Pressure Monitoring Devices Market estimates and forecasts, 2018 - 2030 (USD Million) (Number of Patients Treated in Thousands)
- Fig. 101 Company market share analysis, 2023
- Fig. 102 Strategic framework
Ambulatory Blood Pressure Monitoring Devices Market Growth & Trends:
The global ambulatory blood pressure monitoring devices market size is expected to reach USD 1.87 billion by 2030, expanding at a CAGR of 8.45% from 2024 to 2030, according to a new study by Grand View Research, Inc. The driving factors accelerating the growth of this market include the increasing geriatric population, the prevalence of chronic disorders such as hypertension, and technological advancement worldwide. According to the statistics published by WHO, around 1.13 billion people are likely to suffer from hypertension and causing 7.6 million deaths annually.
In addition, high blood pressure is a major risk factor for hemorrhagic stroke and coronary heart disease in this decade. For instance, as per WHO, an estimated 1.28 billion adults who are aged between 30-79 years globally suffer from hypertension, whereas 42.0% of the adults having hypertension are not aware that they have the condition. Hypertension, besides being the most prevalent, is also the leading cause of cardiovascular disease, premature mortality, and disability. It poses a significant economic burden.
Aging population is another driving factor accelerating the growth of the market. As per the recent WHO statistical data published in October 2022, 1 in 6 people would be over 60 years of age worldwide by 2030 and this number would be doubled by 2050. Moreover, cardiovascular diseases are highly prevalent in the older age population.
Also, technological advancement in ambulatory blood pressure monitoring (ABPM) devices is likely to boost the market over the forecast period. Manufacturing of digital technology-based and mobile blood pressure devices fueling the demand of consumers. Key players in the market consistently focus on the development of cost-friendly, innovative, and easy-to-use devices is likely to strengthen the demand of the market.
Ambulatory Blood Pressure Monitoring Devices Market Report Highlights:
- Based on the product, instrument & accessories dominated the market and accounted for 67.5 % of global revenue in 2023 owing to constant technological advancements such as improvements in wearable technology, apps, & mobiles, their accessibility, and simplicity in usage
- Based on the type, the blood pressure cuff segment dominated the market with a revenue share of 56.3% in 2023 due to higher accuracy, reliability of data collection, and flexibility in usage provided by blood cuff
- Based on the end-use, ambulatory surgical centers & clinics accounted for largest share of 63.7 % of the ABPM devices market in 2023 owing to increasing number of ambulatory surgeries due to short duration of stay and cost savings
- Based on Based on the region, North America dominated the global ABPM devices market with a revenue share of 39.5 in 2023 owing to increase in product launches by key companies, rising overall healthcare expenditure, and an increase in several regulatory approvals
Table of Contents
Chapter 1. Methodology and Scope
- 1.1. Market Segmentation & Scope
- 1.2. Segment Definitions
- 1.2.1. Product
- 1.2.2. Type
- 1.2.3. End-use
- 1.2.4. Sales Channel
- 1.2.5. Regional scope
- 1.2.6. Estimates and forecasts timeline
- 1.3. Research Methodology
- 1.4. Information Procurement
- 1.4.1. Purchased database
- 1.4.2. GVR's internal database
- 1.4.3. Secondary sources
- 1.4.4. Primary research
- 1.4.5. Details of primary research
- 1.4.5.1. Data for primary interviews in Asia Pacific
- 1.5. Information or Data Analysis
- 1.5.1. Data analysis models
- 1.6. Market Formulation & Validation
- 1.7. Model Details
- 1.7.1. Commodity flow analysis (Model 1)
- 1.7.2. Approach 1: Commodity flow approach
- 1.7.3. Volume price analysis (Model 2)
- 1.7.4. Approach 2: Volume price analysis
- 1.8. List of Secondary Sources
- 1.9. List of Primary Sources
- 1.10. Objectives
Chapter 2. Executive Summary
- 2.1. Market Outlook
- 2.2. Segment Outlook
- 2.2.1. Product outlook
- 2.2.2. Typeoutlook
- 2.2.3. End-use outlook
- 2.2.4. Sales channel outlook
- 2.2.5. Regional outlook
- 2.3. Competitive Insights
Chapter 3. Ambulatory Blood Pressure Monitoring Devices Market Variables, Trends & Scope
- 3.1. Market Lineage Outlook
- 3.1.1. Parent market outlook
- 3.1.2. Related/ancillary market outlook
- 3.2. Market Dynamics
- 3.2.1. Market driver analysis
- 3.2.1.1. Increasing prevalence of androgenic alopecia
- 3.2.1.2. Technological advancements in androgenic alopecia
- 3.2.2. Market restraint analysis
- 3.2.2.1. Lack of reimbursement policies for androgenic alopecia
- 3.2.3. Market opportunity analysis
- 3.2.3.1. Increasing prevalence of chronic diseases
- 3.2.1. Market driver analysis
- 3.3. Ambulatory Blood Pressure Monitoring Devices Market Analysis Tools
- 3.3.1. Industry Analysis - Porter's
- 3.3.1.1. Supplier power
- 3.3.1.2. Buyer power
- 3.3.1.3. Substitution threat
- 3.3.1.4. Threat of new entrant
- 3.3.1.5. Competitive rivalry
- 3.3.2. PESTEL Analysis
- 3.3.2.1. Political landscape
- 3.3.2.2. Technological landscape
- 3.3.2.3. Economic landscape
- 3.3.1. Industry Analysis - Porter's
- 3.4. Ambulatory Blood Pressure Monitoring Devices Market: Prevalence Data, By Region
- 3.4.1. North America
- 3.4.1.1. U.S.
- 3.4.1.2. Canada
- 3.4.2. Europe
- 3.4.2.1. UK
- 3.4.2.2. Germany
- 3.4.2.3. France
- 3.4.2.4. Italy
- 3.4.2.5. Spain
- 3.4.2.6. Denmark
- 3.4.2.7. Sweden
- 3.4.2.8. Norway
- 3.4.3. Asia Pacific
- 3.4.3.1. Japan
- 3.4.3.2. China
- 3.4.3.3. India
- 3.4.3.4. South Korea
- 3.4.3.5. Australia
- 3.4.3.6. Thailand
- 3.4.4. Latin America
- 3.4.4.1. Brazil
- 3.4.4.2. Mexico
- 3.4.4.3. Argentina
- 3.4.5. Middle East and Africa (MEA)
- 3.4.5.1. South Africa
- 3.4.5.2. Saudi Arabia
- 3.4.5.3. UAE
- 3.4.5.4. Kuwait
- 3.4.1. North America
Chapter 4. Ambulatory Blood Pressure Monitoring Devices Market: Product Estimates & Trend Analysis
- 4.1. Product Market Share, 2023 & 2030
- 4.2. Segment Dashboard
- 4.3. Global Ambulatory Blood Pressure Monitoring Devices Market by Product Outlook
- 4.4. Market Size & Forecasts and Trend Analyses, 2018 to 2030 for the following
- 4.4.1. Ambulatory Blood Pressure Monitors
- 4.4.1.1. Market estimates and forecasts 2018 to 2030 (USD Million)
- 4.4.2. Instrument & Accessories
- 4.4.2.1. Market estimates and forecasts 2018 to 2030 (USD Million)
- 4.4.1. Ambulatory Blood Pressure Monitors
Chapter 5. Ambulatory Blood Pressure Monitoring Devices Market: Type Estimates & Trend Analysis
- 5.1. Type Market Share, 2023 & 2030
- 5.2. Segment Dashboard
- 5.3. Global Ambulatory Blood Pressure Monitoring Devices Market by Type Outlook
- 5.4. Market Size & Forecasts and Trend Analyses, 2018 to 2030 for the following
- 5.4.1. Blood Pressure Cuffs
- 5.4.1.1. Market estimates and forecasts 2018 to 2030 (USD Million)
- 5.4.2. Others Type
- 5.4.2.1. Market estimates and forecasts 2018 to 2030 (USD Million)
- 5.4.1. Blood Pressure Cuffs
Chapter 6. Ambulatory Blood Pressure Monitoring Devices Market: End-use Estimates & Trend Analysis
- 6.1. End-use Market Share, 2023 & 2030
- 6.2. Segment Dashboard
- 6.3. Global Ambulatory Blood Pressure Monitoring Devices Market by End-use Outlook
- 6.4. Market Size & Forecasts and Trend Analyses, 2018 to 2030 for the following
- 6.4.1. Hospitals
- 6.4.1.1. Market estimates and forecasts 2018 to 2030 (USD Million)
- 6.4.2. Homecare
- 6.4.2.1. Market estimates and forecasts 2018 to 2030 (USD Million)
- 6.4.1. Hospitals
Chapter 7. Ambulatory Blood Pressure Monitoring Devices Market: Regional Estimates & Trend Analysis
- 7.1. Regional Market Share Analysis, 2023 & 2030
- 7.2. Regional Market Dashboard
- 7.3. Global Regional Market Snapshot
- 7.4. Market Size, & Forecasts Trend Analysis, 2018 to 2030:
- 7.5. North America
- 7.5.1. U.S.
- 7.5.1.1. Key country dynamics
- 7.5.1.2. Regulatory framework/ reimbursement structure
- 7.5.1.3. Competitive scenario
- 7.5.1.4. U.S. market estimates and forecasts 2018 to 2030 (USD Million) (Number of Patients Treated in Thousands)
- 7.5.2. Canada
- 7.5.2.1. Key country dynamics
- 7.5.2.2. Regulatory framework/ reimbursement structure
- 7.5.2.3. Competitive scenario
- 7.5.2.4. Canada market estimates and forecasts 2018 to 2030 (USD Million) (Number of Patients Treated in Thousands)
- 7.5.1. U.S.
- 7.6. Europe
- 7.6.1. UK
- 7.6.1.1. Key country dynamics
- 7.6.1.2. Regulatory framework/ reimbursement structure
- 7.6.1.3. Competitive scenario
- 7.6.1.4. UK market estimates and forecasts 2018 to 2030 (USD Million) (Number of Patients Treated in Thousands)
- 7.6.2. Germany
- 7.6.2.1. Key country dynamics
- 7.6.2.2. Regulatory framework/ reimbursement structure
- 7.6.2.3. Competitive scenario
- 7.6.2.4. Germany market estimates and forecasts 2018 to 2030 (USD Million) (Number of Patients Treated in Thousands)
- 7.6.3. France
- 7.6.3.1. Key country dynamics
- 7.6.3.2. Regulatory framework/ reimbursement structure
- 7.6.3.3. Competitive scenario
- 7.6.3.4. France market estimates and forecasts 2018 to 2030 (USD Million) (Number of Patients Treated in Thousands)
- 7.6.4. Italy
- 7.6.4.1. Key country dynamics
- 7.6.4.2. Regulatory framework/ reimbursement structure
- 7.6.4.3. Competitive scenario
- 7.6.4.4. Italy market estimates and forecasts 2018 to 2030 (USD Million) (Number of Patients Treated in Thousands)
- 7.6.5. Spain
- 7.6.5.1. Key country dynamics
- 7.6.5.2. Regulatory framework/ reimbursement structure
- 7.6.5.3. Competitive scenario
- 7.6.5.4. Spain market estimates and forecasts 2018 to 2030 (USD Million) (Number of Patients Treated in Thousands)
- 7.6.6. Norway
- 7.6.6.1. Key country dynamics
- 7.6.6.2. Regulatory framework/ reimbursement structure
- 7.6.6.3. Competitive scenario
- 7.6.6.4. Norway market estimates and forecasts 2018 to 2030 (USD Million) (Number of Patients Treated in Thousands)
- 7.6.7. Sweden
- 7.6.7.1. Key country dynamics
- 7.6.7.2. Regulatory framework/ reimbursement structure
- 7.6.7.3. Competitive scenario
- 7.6.7.4. Sweden market estimates and forecasts 2018 to 2030 (USD Million) (Number of Patients Treated in Thousands)
- 7.6.8. Denmark
- 7.6.8.1. Key country dynamics
- 7.6.8.2. Regulatory framework/ reimbursement structure
- 7.6.8.3. Competitive scenario
- 7.6.8.4. Denmark market estimates and forecasts 2018 to 2030 (USD Million) (Number of Patients Treated in Thousands)
- 7.6.1. UK
- 7.7. Asia Pacific
- 7.7.1. Japan
- 7.7.1.1. Key country dynamics
- 7.7.1.2. Regulatory framework/ reimbursement structure
- 7.7.1.3. Competitive scenario
- 7.7.1.4. Japan market estimates and forecasts 2018 to 2030 (USD Million) (Number of Patients Treated in Thousands)
- 7.7.2. China
- 7.7.2.1. Key country dynamics
- 7.7.2.2. Regulatory framework/ reimbursement structure
- 7.7.2.3. Competitive scenario
- 7.7.2.4. China market estimates and forecasts 2018 to 2030 (USD Million) (Number of Patients Treated in Thousands)
- 7.7.3. India
- 7.7.3.1. Key country dynamics
- 7.7.3.2. Regulatory framework/ reimbursement structure
- 7.7.3.3. Competitive scenario
- 7.7.3.4. India market estimates and forecasts 2018 to 2030 (USD Million) (Number of Patients Treated in Thousands)
- 7.7.4. Australia
- 7.7.4.1. Key country dynamics
- 7.7.4.2. Regulatory framework/ reimbursement structure
- 7.7.4.3. Competitive scenario
- 7.7.4.4. Australia market estimates and forecasts 2018 to 2030 (USD Million) (Number of Patients Treated in Thousands)
- 7.7.5. South Korea
- 7.7.5.1. Key country dynamics
- 7.7.5.2. Regulatory framework/ reimbursement structure
- 7.7.5.3. Competitive scenario
- 7.7.5.4. South Korea market estimates and forecasts 2018 to 2030 (USD Million) (Number of Patients Treated in Thousands)
- 7.7.6. Thailand
- 7.7.6.1. Key country dynamics
- 7.7.6.2. Regulatory framework/ reimbursement structure
- 7.7.6.3. Competitive scenario
- 7.7.6.4. Thailand market estimates and forecasts 2018 to 2030 (USD Million) (Number of Patients Treated in Thousands)
- 7.7.1. Japan
- 7.8. Latin America
- 7.8.1. Brazil
- 7.8.1.1. Key country dynamics
- 7.8.1.2. Regulatory framework/ reimbursement structure
- 7.8.1.3. Competitive scenario
- 7.8.1.4. Brazil market estimates and forecasts 2018 to 2030 (USD Million) (Number of Patients Treated in Thousands)
- 7.8.2. Mexico
- 7.8.2.1. Key country dynamics
- 7.8.2.2. Regulatory framework/ reimbursement structure
- 7.8.2.3. Competitive scenario
- 7.8.2.4. Mexico market estimates and forecasts 2018 to 2030 (USD Million) (Number of Patients Treated in Thousands)
- 7.8.3. Argentina
- 7.8.3.1. Key country dynamics
- 7.8.3.2. Regulatory framework/ reimbursement structure
- 7.8.3.3. Competitive scenario
- 7.8.3.4. Argentina market estimates and forecasts 2018 to 2030 (USD Million) (Number of Patients Treated in Thousands)
- 7.8.1. Brazil
- 7.9. MEA
- 7.9.1. South Africa
- 7.9.1.1. Key country dynamics
- 7.9.1.2. Regulatory framework/ reimbursement structure
- 7.9.1.3. Competitive scenario
- 7.9.1.4. South Africa market estimates and forecasts 2018 to 2030 (USD Million) (Number of Patients Treated in Thousands)
- 7.9.2. Saudi Arabia
- 7.9.2.1. Key country dynamics
- 7.9.2.2. Regulatory framework/ reimbursement structure
- 7.9.2.3. Competitive scenario
- 7.9.2.4. Saudi Arabia market estimates and forecasts 2018 to 2030 (USD Million) (Number of Patients Treated in Thousands)
- 7.9.3. UAE
- 7.9.3.1. Key country dynamics
- 7.9.3.2. Regulatory framework/ reimbursement structure
- 7.9.3.3. Competitive scenario
- 7.9.3.4. UAE market estimates and forecasts 2018 to 2030 (USD Million) (Number of Patients Treated in Thousands)
- 7.9.4. Kuwait
- 7.9.4.1. Key country dynamics
- 7.9.4.2. Regulatory framework/ reimbursement structure
- 7.9.4.3. Competitive scenario
- 7.9.4.4. Kuwait market estimates and forecasts 2018 to 2030 (USD Million) (Number of Patients Treated in Thousands)
- 7.9.1. South Africa
Chapter 8. Competitive Landscape
- 8.1. Recent Developments & Impact Analysis, By Key Market Participants
- 8.2. Company/Competition Categorization
- 8.3. Vendor Landscape
- 8.3.1. List of key distributors and channel partners
- 8.3.2. Key customers
- 8.3.3. Key company market share analysis, 2023
- 8.3.4. Omron Healthcare Welch Allyn, Inc.
- 8.3.4.1. Company overview
- 8.3.4.2. Financial performance
- 8.3.4.3. Product benchmarking
- 8.3.4.4. Strategic initiatives
- 8.3.5. A&D Medical Inc.
- 8.3.5.1. Company overview
- 8.3.5.2. Financial performance
- 8.3.5.3. Product benchmarking
- 8.3.5.4. Strategic initiatives
- 8.3.6. Microlife Corporation
- 8.3.6.1. Company overview
- 8.3.6.2. Financial performance
- 8.3.6.3. Product benchmarking
- 8.3.6.4. Strategic initiatives
- 8.3.7. Daray Medical
- 8.3.7.1. Company overview
- 8.3.7.2. Financial performance
- 8.3.7.3. Product benchmarking
- 8.3.7.4. Strategic initiatives
- 8.3.8. Withings
- 8.3.8.1. Company overview
- 8.3.8.2. Financial performance
- 8.3.8.3. Product benchmarking
- 8.3.8.4. Strategic initiatives
- 8.3.9. Briggs Healthcare
- 8.3.9.1. Company overview
- 8.3.9.2. Financial performance
- 8.3.9.3. Product benchmarking
- 8.3.9.4. Strategic initiatives
- 8.3.10. GE Healthcare
- 8.3.10.1. Company overview
- 8.3.10.2. Financial performance
- 8.3.10.3. Product benchmarking
- 8.3.10.4. Strategic initiatives
- 8.3.11. Rossmax International Ltd.
- 8.3.11.1. Company overview
- 8.3.11.2. Financial performance
- 8.3.11.3. Product benchmarking
- 8.3.11.4. Strategic initiatives
- 8.3.12. GF Health Products Inc
- 8.3.12.1. Company overview
- 8.3.12.2. Financial performance
- 8.3.12.3. Product benchmarking
- 8.3.12.4. Strategic initiatives
- 8.3.13. Spacelabs Healthcare Inc.
- 8.3.13.1. Company overview
- 8.3.13.2. Financial performance
- 8.3.13.3. Product benchmarking
- 8.3.13.4. Strategic initiatives
- 8.3.14. Philips Healthcare
- 8.3.14.1. Company overview
- 8.3.14.2. Financial performance
- 8.3.14.3. Product benchmarking
- 8.3.14.4. Strategic initiatives
- 8.3.15. Biobeat
- 8.3.15.1. Company overview
- 8.3.15.2. Financial performance
- 8.3.15.3. Product benchmarking
- 8.3.15.4. Strategic initiatives
- 8.3.16. Spacelabs Healthcare Inc
- 8.3.16.1. Company overview
- 8.3.16.2. Financial performance
- 8.3.16.3. Product benchmarking
- 8.3.16.4. Strategic initiatives
- 8.3.17. Bosch & Sohn GmbH & Co. KG
- 8.3.17.1. Company overview
- 8.3.17.2. Financial performance
- 8.3.17.3. Product benchmarking
- 8.3.17.4. Strategic initiatives
- 8.3.18. GE Company,
- 8.3.18.1. Company overview
- 8.3.18.2. Financial performance
- 8.3.18.3. Product benchmarking
- 8.3.18.4. Strategic initiatives
- 8.3.19. Schiller AG
- 8.3.19.1. Company overview
- 8.3.19.2. Financial performance
- 8.3.19.3. Product benchmarking
- 8.3.19.4. Strategic initiatives
- 8.3.20. DAIFUKU CO. LTD
- 8.3.20.1. Company overview
- 8.3.20.2. Financial performance
- 8.3.20.3. Product benchmarking
- 8.3.20.4. Strategic initiative

