|
|
市場調査レポート
商品コード
1433672
トウモロコシの市場規模、シェア、動向分析レポート:産地別、用途別、地域別、セグメント予測、2024年~2030年Corn Market Size, Share & Trends Analysis Report By Nature (Organic Corn, Conventional Corn), By End-use (Food & Beverages, Animal Feed, Industrial Use, Ethanol Production), By Region, And Segment Forecasts, 2024 - 2030 |
||||||
|
|||||||
カスタマイズ可能
|
|||||||


| トウモロコシの市場規模、シェア、動向分析レポート:産地別、用途別、地域別、セグメント予測、2024年~2030年 |
|
出版日: 2024年01月02日
発行: Grand View Research
ページ情報: 英文 80 Pages
納期: 2~10営業日
|

全表示
- 概要
- 図表
- 目次
トウモロコシ市場の成長と動向:
Grand View Research, Inc.の新しいレポートによると、世界のトウモロコシ市場規模は2024年から2030年にかけて3.6%のCAGRを記録し、2030年には3,772億7,000万米ドルに達すると予測されています。
トウモロコシは家畜飼料の主原料です。食肉消費の増加による畜産業の成長は、飼料原料としてのトウモロコシの需要に貢献しています。トウモロコシはバイオ燃料、特にエタノール生産の主要原料です。化石燃料の代替としてバイオ燃料の利用を促進する政府の政策やインセンティブは、トウモロコシの需要に大きな影響を与えています。
さらに、再生可能エネルギー源の世界の推進と化石燃料への依存を減らす努力により、バイオ燃料の需要が増加しています。トウモロコシベースのエタノールは、従来のガソリンに代わるよりクリーンな代替燃料として使用され、市場の成長に貢献しています。トウモロコシは、コーンスターチ、コーン油、その他の誘導体の生産など、様々な産業用途に使用されています。例えばコーンスターチは、生分解性プラスチック、繊維、接着剤の生産に使用されます。トウモロコシベースの誘導体は汎用性が高いため、非食品工業用途での使用が魅力的であり、需要の増加に寄与しています。これらの製品に対する需要の増加は、トウモロコシの需要全体を牽引しています。
天然素材や植物由来の製品に対する需要など、消費者の嗜好の変化は市場の成長に影響を与えます。消費者の動向に沿ったコーンベースの製品は、需要が増加します。コーン油のような一部のコーンベースの誘導体は、他の特定の食用油に比べて比較的健康的な選択肢と考えられています。健康やウェルネスの動向が消費者の嗜好に影響を与えるにつれて、より健康的またはより自然であると認識されるトウモロコシ由来の製品に対する需要が高まっています。トウモロコシ農家を支援する政府の政策、補助金、インセンティブは、生産と市場の成長にプラスの影響を与える可能性があります。これには農業慣行、土地利用、価格設定に関する政策が含まれます。
とうもろこし業界におけるデジタル革命は、技術革新を通じて業界を再構築し、時代遅れの、手間のかかる、無駄の多いプロセスを、迅速で効率的な、持続可能な方法に置き換えることにつながった。技術革新には、スマート・コーン・システムのような、従来のハイブリッドよりも約30%小型でありながら同等の収量を維持する、背の低いトウモロコシのハイブリッドの開発が含まれます。これらの背の低い植物は、極端な風や厳しい気象条件に耐えるように設計されており、宿根やグリーンスナップ耐性を低減しています。このシステムにより、殺菌剤、殺虫剤、窒素などの作物投入のタイミングや地上施用がより柔軟に行えます。米国農務省は、この短稈トウモロコシは安全に栽培できると判断しており、気候変動や異常気象がもたらす課題に対する潜在的な解決策を提供しています。
さらに、遺伝子組換え種子品種と精密農業システムの採用は、より高い収量と新しい地域への拡大を支え、トウモロコシの作付面積と生産性の増加に貢献しています。新しい種子技術の採用は、農家がトウモロコシの種子をより密に、より早く植えることを可能にし、より高い収量につながることで、トウモロコシの生産量を大幅に増加させました。IoTの進歩に後押し精密農業が最前線にいます。IoTセンサーやモニタリング・デバイスは、土壌状態、天候パターン、作物健康状態に関するリアルタイムデータを提供しています。
この情報により、生産者は灌漑、施肥、害虫駆除に関して非常に正確な判断を下すことができます。さらに、ドローンと衛星画像統合は、トウモロコシ生産者に畑包括的なビューを提供し、効果的なモニタリング、病気検出、最適化畑管理方法を可能にします。デジタル農業プラットフォームは、現代農業に不可欠なもとなりつつあります。農場管理ソフトウェアは、作付けスケジュール、作物の健康状態、資源管理を監視するための包括的なソリューションを提供します。
トウモロコシ市場レポートハイライト
- アジア太平洋地域は、高い消費パターン、人口増加、重要な家畜・家禽産業により、市場を独占しています。有利な農業慣行、政府政策、多様な産業用途など要因が、こ地域世界市場における優位性をさらに高めています。
- 有機とうもろこしセグメントは、消費者の健康への関心の高まりと有機的に生産された食品作物への意識の高まりにより急速な成長を経験しています。
- 最終用途に基づくと、B2Bは予測期間中に高いCAGRで成長すると予測されます。B2Bセグメントの中で、トウモロコシは多様な産業用途を見つけ、バイオ燃料、プロセス用工業デンプン、医薬品の生産に役割を果たしています。この分野に従事する企業は、これらの特定の用途に合わせたトウモロコシの供給を確保するためにB2B取引に依存しています。
目次
第1章 調査手法と範囲
第2章 エグゼクティブサマリー
第3章 トウモロコシ市場の変数、動向、範囲
- 市場イントロダクション
- 業界のバリューチェーン分析
- 販売/小売チャネル分析
- 利益率分析
- 市場力学
- 市場促進要因分析
- 市場抑制要因分析
- 業界の機会
- 業界の課題
- 事業環境分析
- ポーターのファイブフォース分析
- 市場参入戦略
第4章 消費者行動分析
- 人口動向分析
- 消費者の動向と好み
- 購入決定に影響を与える要因
- 消費者の性質の採用
- 主な観察と調査結果
第5章 トウモロコシ市場:性質の推定・動向分析
- 自然の変動分析と市場シェア、2023年と2030年
- オーガニック
- 従来型
第6章 トウモロコシ市場: エンドユーザーの推定・動向分析
- エンドユーザーの変動分析と市場シェア、2023年と2030年
- B2B
- B2C
第7章 トウモロコシ市場:地域推定・動向分析
- 地域変動分析と市場シェア、2023年と2030年
- 北米
- 市場推計・予測、2018~2030年
- 自然別、2018~2030年
- 最終用途別、2018~2030年
- 米国
- カナダ
- メキシコ
- 欧州
- 市場推計・予測、2018~2030年
- 自然別、2018~2030年
- 最終用途別、2018~2030年
- 英国
- ドイツ
- フランス
- イタリア
- スペイン
- アジア太平洋地域
- 市場推計・予測、2018~2030年
- 自然別、2018~2030年
- 最終用途別、2018~2030年
- 中国
- 日本
- インド
- オーストラリア
- インドネシア
- 中南米
- 市場推計・予測、2018~2030年
- 自然別、2018~2030年
- 最終用途別、2018~2030年
- ブラジル
- 中東とアフリカ
- 市場推計・予測、2018~2030年
- 自然別、2018~2030年
- 最終用途別、2018~2030年
- 南アフリカ
第8章 競合分析
- 主要市場参入企業による最近の動向と影響分析
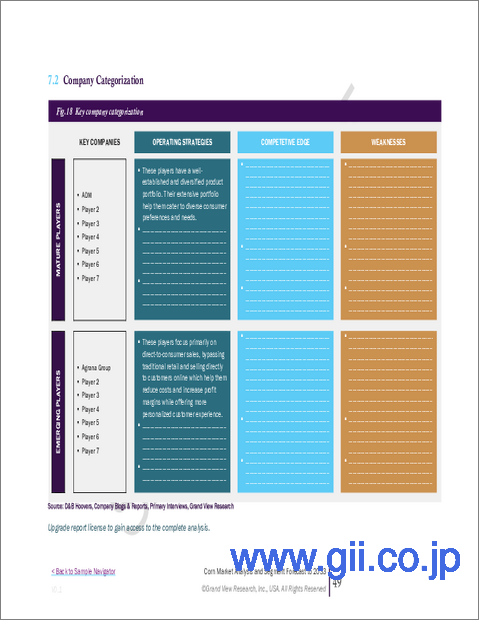
- 企業の分類
- 参入企業の概要
- 財務実績
- 自然のベンチマーク
- 企業の市場シェア分析、2023年(%)
- 企業ヒートマップ分析
- 戦略マッピング
- このセクションで分析される主要企業
- China National Cereals, Oils and Foodstuffs Corporation(COFCO)
- Archer-Daniels-Midland(ADM)
- Cargill, Inc.
- CHS Inc.
- Bunge Limited
- Monsanto
- Corteva Agriscience
- Adani Wilmar
- Agrium Inc.
- Scoular
List of Tables
- Table 1 Conventional corn market estimates and forecast, 2018 - 2030 (USD Million)
- Table 2 Organic corn market estimates and forecast, 2018 - 2030 (USD Million)
- Table 3 Corn market estimates and forecast through b2b, 2018 - 2030 (USD Million)
- Table 4 Corn market estimates and forecast through b2c, 2018 - 2030 (USD Million)
- Table 5 North America corn market estimates and forecast, 2018 - 2030 (USD Million)
- Table 6 North America corn market estimates and forecast, by nature, 2018 - 2030 (USD Million)
- Table 7 North America corn market estimates and forecast, by end-user, 2018 - 2030 (USD Million)
- Table 8 U.S. corn market estimates and forecast, 2018 - 2030 (USD Million)
- Table 9 U.S. corn market estimates and forecast, by nature, 2018 - 2030 (USD Million)
- Table 10 U.S. corn market estimates and forecast, by end-user, 2018 - 2030 (USD Million)
- Table 11 Canada corn market estimates and forecast, 2018 - 2030 (USD Million)
- Table 12 Canada corn market estimates and forecast, by nature, 2018 - 2030 (USD Million)
- Table 13 Canada corn market estimates and forecast, by end-user, 2018 - 2030 (USD Million)
- Table 14 Mexico corn market estimates and forecast, 2018 - 2030 (USD Million)
- Table 15 Mexico corn market estimates and forecast, by nature, 2018 - 2030 (USD Million)
- Table 16 Mexico corn market estimates and forecast, by end-user, 2018 - 2030 (USD Million)
- Table 17 Europe corn market estimates and forecast, 2018 - 2030 (USD Million)
- Table 18 Europe corn market estimates and forecast, by nature, 2018 - 2030 (USD Million)
- Table 19 Europe corn market estimates and forecast, by end-user, 2018 - 2030 (USD Million)
- Table 20 Germany corn market estimates and forecast, 2018 - 2030 (USD Million)
- Table 21 Germany corn market estimates and forecast, by nature, 2018 - 2030 (USD Million)
- Table 22 Germany corn market estimates and forecast, by end-user,, 2018 - 2030 (USD Million)
- Table 23 UK corn market estimates and forecast, 2018 - 2030 (USD Million)
- Table 24 UK corn market estimates and forecast, by nature, 2018 - 2030 (USD Million)
- Table 25 UK corn market estimates and forecast, by end-user, 2018 - 2030 (USD Million)
- Table 26 France corn market estimates and forecast, 2018 - 2030 (USD Million)
- Table 27 France corn market estimates and forecast, by nature, 2018 - 2030 (USD Million)
- Table 28 France corn market estimates and forecast, by end-user, 2018 - 2030 (USD Million)
- Table 29 Italy corn market estimates and forecast, 2018 - 2030 (USD Million)
- Table 30 Italy corn market estimates and forecast, by nature, 2018 - 2030 (USD Million)
- Table 31 Italy corn market estimates and forecast, by end-user, 2018 - 2030 (USD Million)
- Table 32 Spain corn market estimates and forecast, 2018 - 2030 (USD Million)
- Table 33 Spain corn market estimates and forecast, by nature, 2018 - 2030 (USD Million)
- Table 34 Spain corn market estimates and forecast, by end-user, 2018 - 2030 (USD Million)
- Table 35 Asia Pacific corn market estimates and forecast, 2018 - 2030 (USD Million)
- Table 36 Asia Pacific corn market estimates and forecast, by nature, 2018 - 2030 (USD Million)
- Table 37 Asia Pacific corn market estimates and forecast, by end-user, 2018 - 2030 (USD Million)
- Table 38 China corn market estimates and forecast, 2018 - 2030 (USD Million)
- Table 39 China corn market estimates and forecast, by nature, 2018 - 2030 (USD Million)
- Table 40 China corn market estimates and forecast, by end-user, 2018 - 2030 (USD Million)
- Table 41 India corn market estimates and forecast, 2018 - 2030 (USD Million)
- Table 42 India corn market estimates and forecast, by nature, 2018 - 2030 (USD Million)
- Table 43 India corn market estimates and forecast, by end-user, 2018 - 2030 (USD Million)
- Table 44 Japan corn market estimates and forecast, 2018 - 2030 (USD Million)
- Table 45 Japan corn market estimates and forecast, by nature, 2018 - 2030 (USD Million)
- Table 46 Japan corn market estimates and forecast, by end-user, 2018 - 2030 (USD Million)
- Table 47 Australia corn market estimates and forecast, 2018 - 2030 (USD Million)
- Table 48 Australia corn market estimates and forecast, by nature, 2018 - 2030 (USD Million)
- Table 49 Australia corn market estimates and forecast, by end-user, 2018 - 2030 (USD Million)
- Table 50 Indonesia corn market estimates and forecast, 2018 - 2030 (USD Million)
- Table 51 Indonesia corn market estimates and forecast, by nature, 2018 - 2030 (USD Million)
- Table 52 Indonesia corn market estimates and forecast, by end-user, 2018 - 2030 (USD Million)
- Table 53 Central & South America corn market estimates and forecast, 2018 - 2030 (USD Million)
- Table 54 Central & South America corn market estimates and forecast, by nature, 2018 - 2030 (USD Million)
- Table 55 Central & South America corn market estimates and forecast, by end-user, 2018 - 2030 (USD Million)
- Table 56 Brazil corn market estimates and forecast, 2018 - 2030 (USD Million)
- Table 57 Brazil corn market estimates and forecast, by nature, 2018 - 2030 (USD Million)
- Table 58 Brazil corn market estimates and forecast, by end-user, 2018 - 2030 (USD Million)
- Table 59 Middle East & Africa corn market estimates and forecast, 2018 - 2030 (USD Million)
- Table 60 Middle East & Africa corn market estimates and forecast, by nature, 2018 - 2030 (USD Million)
- Table 61 Middle East & Africa corn market estimates and forecast, by end-user, 2018 - 2030 (USD Million)
- Table 62 South Africa corn market estimates and forecast, 2018 - 2030 (USD Million)
- Table 63 South Africa corn market estimates and forecast, by nature, 2018 - 2030 (USD Million)
- Table 64 South Africa corn market estimates and forecast, by end-user, 2018 - 2030 (USD Million)
- Table 65 Corn market: Company Categorization
- Table 66 Corn market: Company market share (%) analysis, 2023
List of Figures
- Fig. 1 Corn market segmentation
- Fig. 2 Information procurement
- Fig. 3 Primary research pattern
- Fig. 4 Primary research approaches
- Fig. 5 Primary research process
- Fig. 6 Market Snapshot
- Fig. 7 Segment Snapshot
- Fig. 8 Competitive Landscape Snapshot
- Fig. 9 Global corn market - penetration & growth prospect mapping
- Fig. 10 Corn market- Industry value chain analysis
- Fig. 11 Corn market profit margin analysis
- Fig. 12 Corn market dynamics
- Fig. 13 Corn market: Porter's five forces analysis
- Fig. 14 Roadmap of corn market
- Fig. 15 Factors affecting buying decisions for corn
- Fig. 16 Corn market, by nature: Key takeaways
- Fig. 17 Corn market, by nature: Market share, 2023 & 2030
- Fig. 18 Corn market, by end-user: Key takeaways
- Fig. 19 Corn market, by end-user: Market share, 2023 & 2030
- Fig. 20 Corn market: Regional share (%) analysis, 2023 & 2030 (USD Million)
- Fig. 21 Corn market: Company market share (%) analysis, 2023
Corn Market Growth & Trends:
The global corn market size is expected to reach USD 377.27 billion in 2030, registering a CAGR of 3.6% from 2024 to 2030, according to a new report by Grand View Research, Inc. Corn is a primary ingredient in livestock feed. The growth of the livestock industry, driven by increasing meat consumption, contributes to the demand for corn as a feedstock. Corn is a major feedstock for biofuel production, particularly ethanol. Government policies and incentives promoting the use of biofuels as an alternative to fossil fuels significantly impact the demand for corn.
Furthermore, the global push for renewable energy sources and efforts to reduce reliance on fossil fuels has led to increased demand for biofuels. Corn-based ethanol is used as a cleaner alternative to traditional gasoline, contributing to the growth of the market. Corn is used in various industrial applications, such as in the production of cornstarch, corn oil, and other derivatives. Cornstarch, for example, is used in the production of biodegradable plastics, textiles, and adhesives. The versatility of corn-based derivatives makes them attractive for use in non-food industrial applications, contributing to increased demand. The increasing demand for these products drives the overall demand for corn.
Shifting consumer preferences, such as the demand for natural and plant-based products, influence the growth of the market. Corn-based products that align with consumer trends experience increased demand. Some corn-based derivatives, such as corn oil, are considered relatively healthier options compared to certain other cooking oils. As health and wellness trends influence consumer preferences, there is a growing demand for products derived from corn that are perceived as healthier or more natural. Supportive government policies, subsidies, and incentives for corn farmers can positively impact production and market growth. This includes policies related to agricultural practices, land use, and pricing.
The digital revolution in corn industry has led to reshaping the industry through technological innovation, replacing outdated, longwinded, and wasteful processes with fast, efficient, and sustainable methods. The innovations include the development of short-stature corn hybrids, such as the Smart Corn System, which are approximately 30% smaller than traditional hybrids but maintain similar yields. These shorter-statured plants are designed to withstand extreme winds and challenging weather conditions, reducing lodging and green snap tolerance. The system allows for more flexible timing and ground application of crop inputs, such as fungicides, insecticides, and nitrogen. The U.S. Department of Agriculture has determined that the short-stature corn can be safely grown, providing a potential solution to the challenges posed by climate change and extreme weather events.
Additionally, the adoption of genetically engineered seed varieties and precision farming systems has supported higher yields and expansion into new areas, contributing to increased corn acreage and productivity. The adoption of new seed technologies has significantly increased corn production by enabling farmers to plant corn seed more densely and earlier, leading to higher yields. Precision agriculture, propelled by advancements in the Internet of Things (IoT), is at the forefront. IoT sensors and monitoring devices provide real-time data on soil conditions, weather patterns, and crop health.
This information enables producers to make highly precise decisions regarding irrigation, fertilization, and pest control. Additionally, the integration of drones and satellite imaging offers corn producers a comprehensive view of their fields, allowing for effective monitoring, disease detection, and optimized field management practices. Digital farming platforms are becoming integral to modern agricultural practices. Farm management software provides comprehensive solutions for monitoring planting schedules, crop health, and resource management.
Major players in the market include China National Cereals, Oils and Foodstuffs Corporation (COFCO); Archer-Daniels-Midland (ADM); Cargill, Inc.; CHS Inc.; Bunge; Glencore; Louis Dreyfus Company; Ardent Mills. Various steps are adopted by these companies including new product launches, partnerships, mergers & acquisitions, global expansion, and others to gain more share of the market.
Corn Market Report Highlights:
- Asia Pacific dominated the market owing to high consumption patterns, growing population, and a significant livestock and poultry industry. Factors such as favorable agricultural practices, government policies, and diverse industrial uses further contribute to the region's prominence in the global market.
- Based on nature, the organic corn segment is estimated to grow with a substantial CAGR over the forecast period. The organic corn segment is experiencing rapid growth owing to increasing consumer health concerns and a growing awareness of organically produced food crops.
- Based on end-use, the B2B is expected to grow with a high CAGR over the forecast period. Within the B2B segment, corn finds diverse industrial applications, playing a role in the production of biofuels, industrial starch for processes, and pharmaceuticals. Companies engaged in this sector rely on B2B transactions to secure a supply of corn tailored for these specific applications.
Table of Contents
Chapter 1. Methodology and Scope
- 1.1. Market Segmentation & Scope
- 1.2. Market Definition
- 1.3. Information Procurement
- 1.3.1. Purchased Database
- 1.3.2. GVR's Internal Database
- 1.3.3. Secondary Natures & Third-Party Perspectives
- 1.3.4. Primary Research
- 1.4. Information Analysis
- 1.4.1. Data Analysis Models
- 1.5. Market Formulation & Data Visualization
- 1.6. Data Validation & Publishing
Chapter 2. Executive Summary
- 2.1. Market Outlook
- 2.2. Nature Outlook
- 2.3. End-user Outlook
- 2.4. Regional Outlook
- 2.5. Competition Outlook
Chapter 3. Corn Market Variables, Trends & Scope
- 3.1. Market Introduction
- 3.2. Industry Value Chain Analysis
- 3.2.1. Sales/Retail Channel Analysis
- 3.2.2. Profit Margin Analysis
- 3.3. Market Dynamics
- 3.3.1. Market Driver Analysis
- 3.3.2. Market Restraint Analysis
- 3.3.3. Industry Opportunities
- 3.3.4. Industry Challenges
- 3.4. Business Environment Analysis
- 3.4.1. PORTER'S Five Forces Analysis
- 3.5. Market Entry Strategies
Chapter 4. Consumer Behavior Analysis
- 4.1. Demographics Analysis
- 4.2. Consumer Trends and Preferences
- 4.3. Factors Affecting Buying Decision
- 4.4. Consumer Nature Adoption
- 4.5. Key Observations & Findings
Chapter 5. Corn Market: Nature Estimates & Trend Analysis
- 5.1. Nature Movement Analysis & Market Share, 2023 & 2030
- 5.2. Organic
- 5.2.1. Organic corn market estimates and forecast, 2018 - 2030 (USD Million)
- 5.3. Conventional
- 5.3.1. Conventional corn market estimates and forecast, 2018 - 2030 (USD Million)
Chapter 6. Corn Market: End-user Estimates & Trend Analysis
- 6.1. End-user Movement Analysis & Market Share, 2023 & 2030
- 6.2. B2B
- 6.2.1. Corn market estimates and forecast through b2b, 2018 - 2030 (USD Million)
- 6.2.2. Food & Beverages
- 6.2.2.1. Corn market estimates and forecast through food & beverages, 2018 - 2030
- 6.2.3. Animal Feed
- 6.2.3.1. Corn market estimates and forecast through animal feed, 2018 - 2030
- 6.2.4. Industrial Use
- 6.2.4.1. Corn market estimates and forecast through industrial use, 2018 - 2030
- 6.2.5. Food & Beverages
- 6.2.5.1. Corn market estimates and forecast through food & beverages, 2018 - 2030
- 6.2.6. Ethanol production
- 6.2.6.1. Corn market estimates and forecast through ethanol production, 2018 - 2030
- 6.2.7. Others
- 6.2.7.1. Corn market estimates and forecast through others, 2018 - 2030 (USD Million)
- 6.3. B2C
- 6.3.1. Corn market estimates and forecast through b2c, 2018 - 2030 (USD Million)
- 6.3.2. Online
- 6.3.2.1. Corn market estimates and forecast through online, 2018 - 2030
- 6.3.3. Offline
- 6.3.3.1. Corn market estimates and forecast through offline, 2018 - 2030
Chapter 7. Corn Market: Regional Estimates & Trend Analysis
- 7.1. Regional Movement Analysis & Market Share, 2023 & 2030
- 7.2. North America
- 7.2.1. Market estimates and forecast, 2018 - 2030 (USD Million)
- 7.2.2. Market estimates and forecast, by nature, 2018 - 2030 (USD Million)
- 7.2.3. Market estimates and forecast, by end-user, 2018 - 2030 (USD Million)
- 7.2.4. U.S.
- 7.2.4.1. Market estimates and forecast, 2018 - 2030 (USD Million)
- 7.2.4.2. Market estimates and forecast, by nature, 2018 - 2030 (USD Million)
- 7.2.4.3. Market estimates and forecast, by end-user, 2018 - 2030 (USD Million)
- 7.2.5. Canada
- 7.2.5.1. Market estimates and forecast, 2018 - 2030 (USD Million)
- 7.2.5.2. Market estimates and forecast, by nature, 2018 - 2030 (USD Million)
- 7.2.5.3. Market estimates and forecast, by end-user, 2018 - 2030 (USD Million)
- 7.2.6. Mexico
- 7.2.6.1. Market estimates and forecast, 2018 - 2030 (USD Million)
- 7.2.6.2. Market estimates and forecast, by nature, 2018 - 2030 (USD Million)
- 7.2.6.3. Market estimates and forecast, by end-user, 2018 - 2030 (USD Million)
- 7.3. Europe
- 7.3.1. Market estimates and forecast, 2018 - 2030 (USD Million)
- 7.3.2. Market estimates and forecast, by nature, 2018 - 2030 (USD Million)
- 7.3.3. Market estimates and forecast, by end-user, 2018 - 2030 (USD Million)
- 7.3.4. UK
- 7.3.4.1. Market estimates and forecast, 2018 - 2030 (USD Million)
- 7.3.4.2. Market estimates and forecast, by nature, 2018 - 2030 (USD Million)
- 7.3.4.3. Market estimates and forecast, by end-user, 2018 - 2030 (USD Million)
- 7.3.5. Germany
- 7.3.5.1. Market estimates and forecast, 2018 - 2030 (USD Million)
- 7.3.5.2. Market estimates and forecast, by nature, 2018 - 2030 (USD Million)
- 7.3.5.3. Market estimates and forecast, by end-user, 2018 - 2030 (USD Million)
- 7.3.6. France
- 7.3.6.1. Market estimates and forecast, 2018 - 2030 (USD Million)
- 7.3.6.2. Market estimates and forecast, by nature, 2018 - 2030 (USD Million)
- 7.3.6.3. Market estimates and forecast, by end-user, 2018 - 2030 (USD Million)
- 7.3.7. Italy
- 7.3.7.1. Market estimates and forecast, 2018 - 2030 (USD Million)
- 7.3.7.2. Market estimates and forecast, by nature, 2018 - 2030 (USD Million)
- 7.3.7.3. Market estimates and forecast, by end-user, 2018 - 2030 (USD Million)
- 7.3.8. Spain
- 7.3.8.1. Market estimates and forecast, 2018 - 2030 (USD Million)
- 7.3.8.2. Market estimates and forecast, by nature, 2018 - 2030 (USD Million)
- 7.3.8.3. Market estimates and forecast, by end-user, 2018 - 2030 (USD Million)
- 7.4. Asia Pacific
- 7.4.1. Market estimates and forecast, 2018 - 2030 (USD Million)
- 7.4.2. Market estimates and forecast, by nature, 2018 - 2030 (USD Million)
- 7.4.3. Market estimates and forecast, by end-user, 2018 - 2030 (USD Million)
- 7.4.4. China
- 7.4.4.1. Market estimates and forecast, 2018 - 2030 (USD Million)
- 7.4.4.2. Market estimates and forecast, by nature, 2018 - 2030 (USD Million)
- 7.4.4.3. Market estimates and forecast, by end-user, 2018 - 2030 (USD Million)
- 7.4.5. Japan
- 7.4.5.1. Market estimates and forecast, 2018 - 2030 (USD Million)
- 7.4.5.2. Market estimates and forecast, by nature, 2018 - 2030 (USD Million)
- 7.4.5.3. Market estimates and forecast, by end-user, 2018 - 2030 (USD Million)
- 7.4.6. India
- 7.4.6.1. Market estimates and forecast, 2018 - 2030 (USD Million)
- 7.4.6.2. Market estimates and forecast, by nature, 2018 - 2030 (USD Million)
- 7.4.6.3. Market estimates and forecast, by end-user, 2018 - 2030 (USD Million)
- 7.4.7. Australia
- 7.4.7.1. Market estimates and forecast, 2018 - 2030 (USD Million)
- 7.4.7.2. Market estimates and forecast, by nature, 2018 - 2030 (USD Million)
- 7.4.7.3. Market estimates and forecast, by end-user, 2018 - 2030 (USD Million)
- 7.4.8. Indonesia
- 7.4.8.1. Market estimates and forecast, 2018 - 2030 (USD Million)
- 7.4.8.2. Market estimates and forecast, by nature, 2018 - 2030 (USD Million)
- 7.4.8.3. Market estimates and forecast, by end-user, 2018 - 2030 (USD Million)
- 7.5. Central & South America
- 7.5.1. Market estimates and forecast, 2018 - 2030 (USD Million)
- 7.5.2. Market estimates and forecast, by nature, 2018 - 2030 (USD Million)
- 7.5.3. Market estimates and forecast, by end-user, 2018 - 2030 (USD Million)
- 7.5.4. Brazil
- 7.5.4.1. Market estimates and forecast, 2018 - 2030 (USD Million)
- 7.5.4.2. Market estimates and forecast, by nature, 2018 - 2030 (USD Million)
- 7.5.4.3. Market estimates and forecast, by end-user, 2018 - 2030 (USD Million)
- 7.6. Middle East & Africa
- 7.6.1. Market estimates and forecast, 2018 - 2030 (USD Million)
- 7.6.2. Market estimates and forecast, by nature, 2018 - 2030 (USD Million)
- 7.6.3. Market estimates and forecast, by end-user, 2018 - 2030 (USD Million)
- 7.6.4. South Africa
- 7.6.4.1. Market estimates and forecast, 2018 - 2030 (USD Million)
- 7.6.4.2. Market estimates and forecast, by nature, 2018 - 2030 (USD Million)
- 7.6.4.3. Market estimates and forecast, by application, 2018 - 2030 (USD Million)
- 7.6.4.4. Market estimates and forecast, By end-user, 2018 - 2030 (USD Million)
Chapter 8. Competitive Analysis
- 8.1. Recent developments & impact analysis, by key market participants
- 8.2. Company Categorization
- 8.3. Participant's Overview
- 8.4. Financial Performance
- 8.5. Nature Benchmarking
- 8.6. Company Market Share Analysis, 2023 (%)
- 8.7. Company Heat Map Analysis
- 8.8. Strategy Mapping
- 8.9. List of key companies analyzed in this section include:
- 8.9.1. China National Cereals, Oils and Foodstuffs Corporation (COFCO)
- 8.9.2. Archer-Daniels-Midland (ADM)
- 8.9.3. Cargill, Inc.
- 8.9.4. CHS Inc.
- 8.9.5. Bunge Limited
- 8.9.6. Monsanto
- 8.9.7. Corteva Agriscience
- 8.9.8. Adani Wilmar
- 8.9.9. Agrium Inc.
- 8.9.10. Scoular
