|
|
市場調査レポート
商品コード
1433550
ライブコマースプラットフォームの市場規模、シェア、動向分析レポート:カテゴリー別、地域別、セグメント予測、2024年~2030年Live Commerce Platforms Market Size, Share & Trends Analysis Report By Category (Apparel & Fashion, Cosmetics & Personal Care, Consumer Electronics, Furnishing), By Region (Asia Pacific, North America), And Segment Forecasts, 2024 - 2030 |
||||||
|
|
|||||||
カスタマイズ可能
|
|||||||


| ライブコマースプラットフォームの市場規模、シェア、動向分析レポート:カテゴリー別、地域別、セグメント予測、2024年~2030年 |
|
出版日: 2024年01月05日
発行: Grand View Research
ページ情報: 英文 125 Pages
納期: 2~10営業日
|

- 全表示
- 概要
- 図表
- 目次
ライブコマースプラットフォーム市場の成長と動向:
Grand View Research, Inc.の最新レポートによると、世界のライブコマースプラットフォーム市場規模は、2024年から2030年にかけて21.2%のCAGRを記録し、2030年には34億8,000万米ドルに達すると予測されています。
オンラインショッピングの需要増加や、より魅力的でインタラクティブなショッピング体験などの要因が、市場成長を促進すると予測されています。スマートフォンユーザーの急増と高速インターネットの利用可能性も市場成長に寄与しています。さらに、eコマース企業がパーソナライズされたショッピング体験を提供するためのファーストパーティデータの利用可能性や、ライブコマースプラットフォームへのZ世代人口のエンゲージメントの高まりも、業界の成長を支えています。ライブコマース・プラットフォームはeコマースの拡大に大きく貢献しています。アリババのタオバオ・ライブやアマゾンなどのプラットフォームは、ライブストリーム・コマースによる消費者のエンゲージメントの増加を示しています。
例えば、2020年にはアリババのタオバオがアプリケーションを立ち上げ、商品紹介とリアルタイムでの購入機能を統合したプラットフォームを提供しました。拡張現実/仮想現実(AR/VR)、人工知能(AI)、3D技術を取り入れることで、ライブストリーム体験を強化する機会が生まれます。バーチャル試着、AI対応パーソナライズド・レコメンデーション、革新的なインタラクティブ機能のためにAR/VRを導入することで、バーチャル試着、商品ビジュアライゼーション、インタラクティブな商品デモ、店舗内ナビゲーションツールの助けを借りて、ユーザーエンゲージメントを向上させることができます。さらに、安全なオンライン取引はライブコマースにとって極めて重要であるため、ピーク処理時間帯の取引をサポートする信頼性の高い決済システムが必要となります。スウェーデンのKTH王立工科大学が2023年6月に発表した調査論文によると、グーグルのARCoreデータでは、ARモバイル市場全体の中でモバイルARの採用率が40%であることが明らかになっています。
ライブコマース・プラットフォーム市場レポートのハイライト
- アパレル・ファッションカテゴリーは、ライブコマースの魅力的な属性とインタラクティブ性により、2023年に41.1%のシェアで業界を支配しました。2023年10月、AmazonのGreat Indian Festivalでは、Amazon Liveで1,000時間以上のライブ配信が行われました。300人以上のインフルエンサーが顧客の購買決定を支援し、18時間のライブストリーミングが行われたことで、同社は過去最高の視聴者数を達成しました。
- 家電セグメントは、2024年から2030年にかけて最も速いCAGRで成長すると予想されています。この分野で市場が拡大しているのは、リアルタイムのデモンストレーションや技術製品に関する深い洞察を提供できるためです。コネクテッド・ホームの動向の高まりが、世界のスマート家電の普及を支えています。音声アシストとインターネット接続を備えた電化製品は、便利な使い方のために広く採用されています。2021年8月、サムスンはインド初のライブ・オンライン・ショッピング・プラットフォーム「Samsung Now」を立ち上げ、Galaxy Z Fold3 5GやGalaxy Z Flip3 5Gなどのモバイル機器の事前予約イベントを開催しました。
- 2023年の市場はアジア太平洋地域が牽引しました。同地域はインターネット普及率が高く、スマートフォンが広く普及しているため、潜在的な顧客が複数生まれています。ソーシャルメディア・プラットフォームは日常生活に欠かせないものとなっており、ライブコマース・プラットフォームにターゲット・オーディエンスにリーチする直接的なチャネルを提供しています。中国のインターネット発展に関する統計報告」によると、2022年6月現在、中国のライブストリーミングのユーザー数は7億1,600万人に達し、2021年12月から1,290万人増加し、同国の全インターネットユーザーの68.1%を占めました。さらに、ライブストリーミングeコマースのユーザー数は4億6,900万人に達し、2021年末から533万人増加し、全インターネットユーザーの44.6%を占めました。
- 2023年8月、CommentSoldはTikTok Shopとの提携を発表し、米国におけるライブコマースの統合を可能にしました。CommentSoldの加盟店は、TikTok Shopとのライブストリーミングの制作、販売、コミュニケーション管理の完全な統合とともに、CommentSoldプラットフォームを使用してTikTokでライブイベントをスムーズに配信できるようになった。
目次
第1章 調査手法と範囲
第2章 エグゼクティブサマリー
第3章 ライブコマースプラットフォームの市場変数、動向、および範囲
- 市場イントロダクション/リネージュ展望
- 市場規模と成長見通し
- 業界のバリューチェーン分析
- 市場力学
- 市場促進要因分析
- 市場抑制要因分析
- 業界の機会
- 業界の課題
- ライブコマースプラットフォーム市場分析ツール
- ポーターの分析
- PESTEL分析
第4章 ライブコマースプラットフォーム市場:カテゴリーの予測と動向分析
- セグメントダッシュボード
- ライブコマースプラットフォーム市場:カテゴリー変動分析、2023年および2030年
- アパレル&ファッション
- 化粧品とパーソナルケア
- 家電
- 提供
- エンターテインメント
- その他
第5章 ライブコマースプラットフォーム市場:地域別の予測と動向分析
- ライブコマースプラットフォーム市場シェア、地域別、2023年および2030年
- 北米
- 欧州
- アジア太平洋地域
- ラテンアメリカ
- 中東とアフリカ
第6章 競合情勢
- 主要市場参入企業による最近の動向と影響分析
- 企業の分類
- 企業の市場での位置づけ
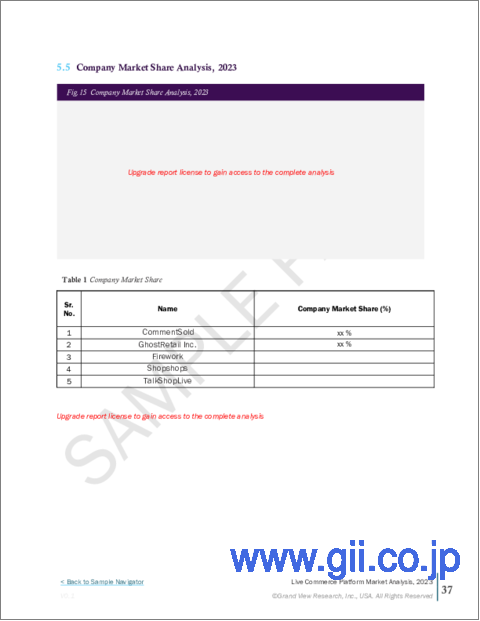
- 企業の市場シェア分析
- 企業ヒートマップ分析
- 戦略マッピング
- 拡大
- 合併と買収
- パートナーシップとコラボレーション
- 新製品の発売
- 研究開発
- 企業プロファイル
- CommentSold
- GhostRetail, Inc.
- Firework
- ShopShops
- TalkShopLive
- Restream, Inc.
- Bambuser AB
- Livescale
- giosg.com Ltd.
- Klarna Bank AB(publ)
List of Tables
- Table 1 List of abbreviation
- Table 2 Live commerce platform market 2018 - 2030 (USD Million)
- Table 3 Global market estimates and forecasts by region, 2018 - 2030 (USD Million)
- Table 4 Global market estimates and forecasts by category, 2018 - 2030 (USD Million)
- Table 5 North America live commerce platform market by category, 2018 - 2030 (USD Million)
- Table 6 North America live commerce platform market by region, 2018 - 2030 (USD Million)
- Table 7 U.S. live commerce platform market by category, 2018 - 2030 (USD Million)
- Table 8 Canada live commerce platform market by category, 2018 - 2030 (USD Million)
- Table 9 Europe live commerce platform market by category, 2018 - 2030 (USD Million)
- Table 10 Europe live commerce platform market by region, 2018 - 2030 (USD Million)
- Table 11 Germany live commerce platform market by category, 2018 - 2030 (USD Million)
- Table 12 UK live commerce platform market by category, 2018 - 2030 (USD Million)
- Table 13 France live commerce platform market by category, 2018 - 2030 (USD Million)
- Table 14 Italy live commerce platform market by category, 2018 - 2030 (USD Million)
- Table 15 Spain live commerce platform market by category, 2018 - 2030 (USD Million)
- Table 16 The Netherlands live commerce platform market by category, 2018 - 2030 (USD Million)
- Table 17 Asia Pacific live commerce platform market by category, 2018 - 2030 (USD Million)
- Table 18 Asia Pacific live commerce platform market by region, 2018 - 2030 (USD Million)
- Table 19 China live commerce platform market by category, 2018 - 2030 (USD Million)
- Table 20 Japan live commerce platform market by category, 2018 - 2030 (USD Million)
- Table 21 India live commerce platform market by category, 2018 - 2030 (USD Million)
- Table 22 South Korea live commerce platform market by category, 2018 - 2030 (USD Million)
- Table 23 Australia live commerce platform market by category, 2018 - 2030 (USD Million)
- Table 24 Latin America live commerce platform market by category, 2018 - 2030 (USD Million)
- Table 25 Latin America live commerce platform market by region, 2018 - 2030 (USD Million)
- Table 26 Brazil live commerce platform market by category, 2018 - 2030 (USD Million)
- Table 27 Mexico live commerce platform market by category, 2018 - 2030 (USD Million)
- Table 28 Argentina live commerce platform market by category, 2018 - 2030 (USD Million)
- Table 29 Middle East & Africa live commerce platform market by category, 2018 - 2030 (USD Million)
- Table 30 Middle East & Africa live commerce platform market by region, 2018 - 2030 (USD Million)
- Table 31 Saudi Arabia live commerce platform market by category, 2018 - 2030 (USD Million)
- Table 32 UAE live commerce platform market by category, 2018 - 2030 (USD Million)
- Table 33 South Africa live commerce platform market by category, 2018 - 2030 (USD Million)
List of Figures
- Fig. 1 Market research process
- Fig. 2 Live Commerce Platform Market Segmentation
- Fig. 3 Live Commerce Platform Category Landscape
- Fig. 4 Information Procurement
- Fig. 5 Data Analysis Models
- Fig. 6 Market Formulation and Validation
- Fig. 7 Data Validating & Publishing
- Fig. 8 Market Snapshot
- Fig. 9 Segment Snapshot (1/2)
- Fig. 10 Segment Snapshot (2/2)
- Fig. 11 Competitive Landscape Snapshot
- Fig. 12 Live Commerce Platform - Market Size and Growth Prospects (USD Million)
- Fig. 13 Live Commerce Platform Market: Industry Value Chain Analysis
- Fig. 14 Live Commerce Platform Market: Market Dynamics
- Fig. 15 Live Commerce Platform Market: PORTER's Analysis
- Fig. 16 Live Commerce Platform Market: PESTEL Analysis
- Fig. 17 Live Commerce Platform Market Share by Category, 2023 & 2030 (USD Million)
- Fig. 18 Live Commerce Platform Market, by Category: Market Share, 2023 & 2030
- Fig. 19 Apparel & Fashion Market Estimates & Forecasts, 2018 - 2030 (Revenue, USD Million)
- Fig. 20 Cosmetics & Personal Care Market Estimates & Forecasts, 2018 - 2030 (Revenue, USD Million)
- Fig. 21 Consumer Electronics Market Estimates & Forecasts, 2018 - 2030 (Revenue, USD Million)
- Fig. 22 Furnishing Market Estimates & Forecasts, 2018 - 2030 (Revenue, USD Million)
- Fig. 23 Entertainment Market Estimates & Forecasts, 2018 - 2030 (Revenue, USD Million)
- Fig. 24 Others Market Estimates & Forecasts, 2018 - 2030 (Revenue, USD Million)
- Fig. 25 Live Commerce Platform Market Revenue, by Region, 2023 & 2030 (USD Million)
- Fig. 26 Regional Marketplace: Key Takeaways
- Fig. 27 North America Live Commerce Platform Market Estimates and Forecasts, 2018 - 2030 (USD Million)
- Fig. 28 U.S. Live Commerce Platform Market Estimates and Forecasts, 2018 - 2030 (USD Million)
- Fig. 29 Canada Live Commerce Platform Market Estimates and Forecasts, 2018 - 2030 (USD Million)
- Fig. 30 Europe Live Commerce Platform Market Estimates and Forecasts, 2018 - 2030 (USD Million)
- Fig. 31 UK Live Commerce Platform Market Estimates and Forecasts, 2018 - 2030) (USD Million)
- Fig. 32 Germany Live Commerce Platform Market Estimates and Forecasts, 2018 - 2030 (USD Million)
- Fig. 33 France Live Commerce Platform Market Estimates and Forecasts, 2018 - 2030 (USD Million)
- Fig. 34 Italy Live Commerce Platform Market Estimates and Forecasts, 2018 - 2030) (USD Million)
- Fig. 35 Spain Live Commerce Platform Market Estimates and Forecasts, 2018 - 2030 (USD Million)
- Fig. 36 The Netherlands Live Commerce Platform Market Estimates and Forecasts, 2018 - 2030 (USD Million)
- Fig. 37 Asia Pacific Live Commerce Platform Market Estimates and Forecast, 2018 - 2030 (USD Million)
- Fig. 38 China Live Commerce Platform Market Estimates and Forecasts, 2018 - 2030 (USD Million)
- Fig. 39 Japan Live Commerce Platform Market Estimates and Forecasts, 2018 - 2030 (USD Million)
- Fig. 40 India Live Commerce Platform Market Estimates and Forecasts, 2018 - 2030 (USD Million)
- Fig. 41 South Korea Live Commerce Platform Market Estimates and Forecasts, 2018 - 2030 (USD Million)
- Fig. 42 Australia Live Commerce Platform Market Estimates and Forecasts, 2018 - 2030 (USD Million)
- Fig. 43 Latin America Live Commerce Platform Market Estimates and Forecasts, 2018 - 2030 (USD Million)
- Fig. 44 Brazil Live Commerce Platform Market Estimates and Forecasts, 2018 - 2030 (USD Million)
- Fig. 45 Mexico Live Commerce Platform Market Estimates and Forecasts, 2018 - 2030 (USD Million)
- Fig. 46 Argentina Live Commerce Platform Market Estimates and Forecasts, 2018 - 2030 (USD Million)
- Fig. 47 MEA Live Commerce Platform Market Estimates and Forecasts, 2018 - 2030 (USD Million)
- Fig. 48 Saudi Arabia Live Commerce Platform Market Estimates and Forecasts, 2018 - 2030 (USD Million)
- Fig. 49 UAE Live Commerce Platform Market Estimates and Forecasts, 2018 - 2030 (USD Million)
- Fig. 50 South Africa Live Commerce Platform Market Estimates and Forecasts, 2018 - 2030 (USD Million)
- Fig. 51 Key Company Categorization
- Fig. 52 Company Market Positioning
- Fig. 53 Key Company Market Share Analysis, 2023
- Fig. 54 Strategic Framework
Live Commerce Platforms Market Growth & Trends:
The global live commerce platforms market size is anticipated to reach USD 3.48 billion by 2030, registering a CAGR of 21.2% from 2024 to 2030, according to a new report by Grand View Research, Inc. Factors, such as increasing demand for online shopping and more engaging & interactive shopping experiences is expected to drive market growth. An exponential rise in smartphone users and high-speed internet availability also contribute to market growth. In addition, the availability of first-party data for e-commerce companies to provide personalized shopping experiences and increasing engagement of the Gen Z population with live commerce platforms support industry growth. Live commerce platforms significantly contribute to the expansion of e-commerce. Platforms, such as Alibaba's Taobao Live and Amazon, have shown an increase in consumer engagement due to live-stream commerce.
For instance, in 2020, Alibaba's Taobao launched an application, a platform that integrates product showcasing with the ability to purchase in real-time. Incorporating augmented reality/virtual reality (AR/VR), artificial intelligence (AI), and 3D technology presents opportunities for enhancing live stream experience. Implementing AR/VR for virtual try-ons, AI-enabled personalized recommendations, and innovative interactive features can improve user engagement with the help of virtual try-ons, product visualization, interactive product demos, and in-store navigation tools. In addition, safe online transactions are crucial for live commerce; thus, a highly reliable payment system is needed to support transactions during peak processing times. A research paper published in June 2023 by KTH Royal Institute of Technology of Sweden reveals that Google's ARCore data shows a 40% adoption rate for mobile AR within the total AR mobile market.
Live Commerce Platforms Market Report Highlights:
- The apparel & fashion category segment dominated th industry with a share if 41.1% in 2023 due to the attractive attributes and interactive nature of live commerce. In October 2023, during Amazon's Great Indian Festival, more than 1,000 hours of livestreams were held on Amazon Live. Over 300 influencers assisting customers in making purchase decisions and 18 hours of live streaming helped the company achieve an all-time high viewership
- The consumer electronics segment is expected to grow at the fastest CAGR from 2024 to 2030. The market is growing in this segment due to its ability to offer real-time demonstrations and in-depth insights into technological products. The rising trend of connected homes supports smart appliance penetration globally. Electronic appliances with voice assistance and internet connectivity are widely adopted for convenient usage. In August 2021, Samsung launched India's first live online shopping platform,' Samsung Now,' and held a pre-booking event for mobile devices, such as the Galaxy Z Fold3 5G and Galaxy Z Flip3 5G
- Asia Pacific led the market in 2023. The region has shown a high internet penetration rate and widespread smartphone usage, creating several potential customers. Social media platforms have become integral to daily life, providing live commerce platforms with a direct channel to reach their target audience. According to the Statistical Report on China's Internet Development, the number of users for live streaming in China grew to 716 million as of June 2022, an increase of 12.90 million from December 2021, accounting for 68.1% of all Internet users in the country. Moreover, the user count for live-streaming e-commerce has reached 469 million, an increase of 5.33 million from the end of 2021, accounting for 44.6% of all internet users
- In August 2023, CommentSold announced a partnership with TikTok Shop that enables live commerce integration in the U.S. CommentSold merchants can now smoothly stream live events on TikTok using the CommentSold platform along with complete integrated live streaming production, sales, and communication management with TikTok Shop
Table of Contents
Chapter 1. Methodology and Scope
- 1.1. Market Segmentation and Scope
- 1.2. Market Definitions
- 1.3. Research Methodology
- 1.3.1. Information Procurement
- 1.3.2. Information or Data Analysis
- 1.3.3. Market Formulation & Data Visualization
- 1.3.4. Data Validation & Publishing
- 1.4. Research Scope and Assumptions
- 1.4.1. List of Data Sources
Chapter 2. Executive Summary
- 2.1. Market Outlook
- 2.2. Segment Outlook
- 2.3. Competitive Insights
Chapter 3. Live Commerce Platform Market Variables, Trends, & Scope
- 3.1. Market Introduction/Lineage Outlook
- 3.2. Market Size and Growth Prospects (USD Million)
- 3.3. Industry Value Chain Analysis
- 3.4. Market Dynamics
- 3.4.1. Market Drivers Analysis
- 3.4.1.1. Growth of e-commerce and technological advancement
- 3.4.1.2. Growth opportunity for employment and entrepreneurship
- 3.4.2. Market Restraints Analysis
- 3.4.2.1. Technological challenges and infrastructure in developing countries
- 3.4.3. Industry Opportunities
- 3.4.4. Industry Challenges
- 3.4.1. Market Drivers Analysis
- 3.5. Live Commerce Platform Market Analysis Tools
- 3.5.1. Porter's Analysis
- 3.5.1.1. Bargaining power of the suppliers
- 3.5.1.2. Bargaining power of the buyers
- 3.5.1.3. Threats of substitution
- 3.5.1.4. Threats from new entrants
- 3.5.1.5. Competitive rivalry
- 3.5.2. PESTEL Analysis
- 3.5.2.1. Political landscape
- 3.5.2.2. Economic landscape
- 3.5.2.3. Social landscape
- 3.5.2.4. Technological landscape
- 3.5.2.5. Environmental landscape
- 3.5.2.6. Legal landscape
- 3.5.1. Porter's Analysis
Chapter 4. Live Commerce Platform Market: Category Estimates & Trends Analysis
- 4.1. Segment Dashboard
- 4.2. Live Commerce Platform Market: Category Movement Analysis, 2023 & 2030 (USD Million)
- 4.3. Apparel & Fashion
- 4.3.1. Apparel & Fashion Market Revenue Estimates and Forecasts, 2018 - 2030 (USD Million)
- 4.4. Cosmetics & Personal Care
- 4.4.1. Cosmetics & Personal Care Market Revenue Estimates and Forecasts, 2018 - 2030 (USD Million)
- 4.5. Consumer Electronics
- 4.5.1. Consumer Electronics Market Revenue Estimates and Forecasts, 2018 - 2030 (USD Million)
- 4.6. Furnishing
- 4.6.1. Furnishing Market Revenue Estimates and Forecasts, 2018 - 2030 (USD Million)
- 4.7. Entertainment
- 4.7.1. Entertainment Market Revenue Estimates and Forecasts, 2018 - 2030 (USD Million)
- 4.8. Others
- 4.8.1. Others Market Revenue Estimates and Forecasts, 2018 - 2030 (USD Million)
Chapter 5. Live Commerce Platform Market: Regional Estimates & Trends Analysis
- 5.1. Live Commerce Platform Market Share, By Region, 2023 & 2030 (USD Million)
- 5.2. North America
- 5.2.1. North America live commerce platform market estimates and forecasts, 2018 - 2030 (USD Million)
- 5.2.2. U.S.
- 5.2.2.1. U.S. live commerce platform market estimates and forecasts, 2018 - 2030 (USD Million)
- 5.2.3. Canada
- 5.2.3.1. Canada live commerce platform market estimates and forecasts, 2018 - 2030 (USD Million)
- 5.3. Europe
- 5.3.1. Europe live commerce platform market estimates and forecasts, 2018 - 2030 (USD Million)
- 5.3.2. UK
- 5.3.2.1. UK live commerce platform market estimates and forecasts, 2018 - 2030 (USD Million)
- 5.3.3. Germany
- 5.3.3.1. Germany live commerce platform market estimates and forecasts, 2018 - 2030 (USD Million)
- 5.3.4. France
- 5.3.4.1. France live commerce platform market estimates and forecasts, 2018 - 2030 (USD Million)
- 5.3.5. Italy
- 5.3.5.1. Italy live commerce platform market estimates and forecasts, 2018 - 2030 (USD Million)
- 5.3.6. Spain
- 5.3.6.1. Spain live commerce platform market estimates and forecasts, 2018 - 2030 (USD Million)
- 5.3.7. The Netherlands
- 5.3.7.1. The Netherlands live commerce platform market estimates and forecasts, 2018 - 2030 (USD Million)
- 5.4. Asia Pacific
- 5.4.1. Asia Pacific live commerce platform market estimates and forecasts, 2018 - 2030 (USD Million)
- 5.4.2. China
- 5.4.2.1. China live commerce platform market estimates and forecasts, 2018 - 2030 (USD Million)
- 5.4.3. Japan
- 5.4.3.1. Japan live commerce platform market estimates and forecasts, 2018 - 2030 (USD Million)
- 5.4.4. India
- 5.4.4.1. India live commerce platform market estimates and forecasts, 2018 - 2030 (USD Million)
- 5.4.5. South Korea
- 5.4.5.1. South Korea live commerce platform market estimates and forecasts, 2018 - 2030 (USD Million)
- 5.4.6. Australia
- 5.4.6.1. Australia live commerce platform market estimates and forecasts, 2018 - 2030 (USD Million)
- 5.5. Latin America
- 5.5.1. Latin America live commerce platform market estimates and forecasts, 2018 - 2030 (USD Million)
- 5.5.2. Brazil
- 5.5.2.1. Brazil live commerce platform market estimates and forecasts, 2018 - 2030 (USD Million)
- 5.5.3. Mexico
- 5.5.3.1. Mexico live commerce platform market estimates and forecasts, 2018 - 2030 (USD Million)
- 5.5.4. Argentina
- 5.5.4.1. Argentina live commerce platform market estimates and forecasts, 2018 - 2030 (USD Million)
- 5.6. Middle East and Africa
- 5.6.1. Middle East and Africa live commerce platform market estimates and forecasts, 2018 - 2030 (USD Million)
- 5.6.2. Saudi Arabia
- 5.6.2.1. Saudi Arabia live commerce platform market estimates and forecasts, 2018 - 2030 (USD Million)
- 5.6.3. UAE
- 5.6.3.1. UAE live commerce platform market estimates and forecasts, 2018 - 2030 (USD Million)
- 5.6.4. South Africa
- 5.6.4.1. South Africa live commerce platform market estimates and forecasts, 2018 - 2030 (USD Million)
Chapter 6. Competitive Landscape
- 6.1. Recent Developments & Impact Analysis by Key Market Participants
- 6.2. Company Categorization
- 6.3. Company Market Positioning
- 6.4. Company Market Share Analysis
- 6.5. Company Heat Map Analysis
- 6.6. Strategy Mapping
- 6.6.1. Expansion
- 6.6.2. Mergers & Acquisition
- 6.6.3. Partnerships & Collaborations
- 6.6.4. New Product Launches
- 6.6.5. Research And Development
- 6.7. Company Profiles
- 6.7.1. CommentSold
- 6.7.1.1. Participant's overview
- 6.7.1.2. Financial performance
- 6.7.1.3. Product benchmarking
- 6.7.1.4. Recent developments/ strategic initiatives
- 6.7.2. GhostRetail, Inc.
- 6.7.2.1. Participant's overview
- 6.7.2.2. Financial performance
- 6.7.2.3. Product benchmarking
- 6.7.2.4. Recent developments/ strategic initiatives
- 6.7.3. Firework
- 6.7.3.1. Participant's overview
- 6.7.3.2. Financial performance
- 6.7.3.3. Product benchmarking
- 6.7.3.4. Recent developments/ strategic initiatives
- 6.7.4. ShopShops
- 6.7.4.1. Participant's overview
- 6.7.4.2. Financial performance
- 6.7.4.3. Product benchmarking
- 6.7.4.4. Recent developments/ strategic initiatives
- 6.7.5. TalkShopLive
- 6.7.5.1. Participant's overview
- 6.7.5.2. Financial performance
- 6.7.5.3. Product benchmarking
- 6.7.5.4. Recent developments/ strategic initiatives
- 6.7.6. Restream, Inc.
- 6.7.6.1. Participant's overview
- 6.7.6.2. Financial performance
- 6.7.6.3. Product benchmarking
- 6.7.6.4. Recent developments/ strategic initiatives
- 6.7.7. Bambuser AB
- 6.7.7.1. Participant's overview
- 6.7.7.2. Financial performance
- 6.7.7.3. Product benchmarking
- 6.7.7.4. Recent developments/ strategic initiatives
- 6.7.8. Livescale
- 6.7.8.1. Participant's overview
- 6.7.8.2. Financial performance
- 6.7.8.3. Product benchmarking
- 6.7.8.4. Recent developments/ strategic initiatives
- 6.7.9. giosg.com Ltd.
- 6.7.9.1. Participant's overview
- 6.7.9.2. Financial performance
- 6.7.9.3. Product benchmarking
- 6.7.9.4. Recent developments/ strategic initiatives
- 6.7.10. Klarna Bank AB (publ)
- 6.7.10.1. Participant's overview
- 6.7.10.2. Financial performance
- 6.7.10.3. Product benchmarking
- 6.7.10.4. Recent developments/ strategic initiatives
- 6.7.1. CommentSold
