|
|
市場調査レポート
商品コード
1404858
日本の越境eコマース市場規模、シェア、動向分析レポート:プラットフォーム別、用途別、セグメント予測、2023年~2030年Japan Cross-border E-commerce Market Size, Share & Trends Analysis Report By Platform (B2B, B2C, C2C), By Application (Food & Beverage, Personal Care, Furniture & Appliances, Toys, hobby & DIY), And Segment Forecasts, 2023 - 2030 |
||||||
|
|
|||||||
カスタマイズ可能
|
|||||||


| 日本の越境eコマース市場規模、シェア、動向分析レポート:プラットフォーム別、用途別、セグメント予測、2023年~2030年 |
|
出版日: 2023年11月02日
発行: Grand View Research
ページ情報: 英文 99 Pages
納期: 2~10営業日
|

- 全表示
- 概要
- 図表
- 目次
日本の越境eコマース市場の成長と動向:
Grand View Research, Inc.の調査によると、日本の越境eコマース市場規模は2023年から2030年にかけてCAGR 6.9%で拡大し、2030年には50億9,000万米ドルに達する見込みです。
過去数年間にeコマース業界が達成した大きな牽引力は、インターネットが市場における商品やサービスの取引方法をいかに変えたかを証明しています。スマートフォンの普及、高速インターネットへのアクセス、可処分所得の増加、ソーシャル・メディア・プラットフォームのユーザー数の増加など、いくつかの要因が、eコマース業界が長年にわたって世界中で人気を高めている要因となっています。さらに、ペイメントゲートウェイを介して簡単に支払いができる安全でセキュアなオンラインプラットフォームを確保することで、銀行やその他の市場プレーヤーは、顧客のショッピング体験を完全に変えました。
都市人口の増加が日本の越境eコマース市場の成長に貢献しています。都市部に住む人々は可処分所得が高く、インターネット接続環境も整っているため、eコマース・ウェブサイトを利用して買い物をするのに役立っています。さらに、都市部の人々は利便性を重視し、従来の店舗での買い物よりもオンライン・ショッピングを好むようになっています。こうした要因も、予測期間中の市場の成長を後押しすると予想されます。
さらに、インターネットの普及率が高まっていることも、日本におけるeコマース・チャネルのショッピング利用拡大に寄与する主要因のひとつと予想されます。調査によると、日本は世界のインターネット利用者数ランキングで第7位となっています。2019年6月現在、日本の人口の推定93%がインターネットを利用しています。2000年から2019年にかけて、インターネット利用者数は152%の伸びを記録しています。インターネットの普及率の高さは、4G技術の登場と相まって、今後6年間、同国の市場を牽引すると予想されます。
インターネット上で情報を入手できることも、市場の成長を後押しする要因のひとつです。インターネットを利用することで、顧客はさまざまな国の製品価格を比較することができ、よりお得な買い物をすることができます。同様に、販売者は特定の製品に対する需要が高い国に製品を販売することで、より多くの利益を得ることができます。このように、インターネットの普及は市場の成長を左右する重要な要因です。
国内のeコマース業界を管理する厳しい規則や規制は、予測期間中、市場に脅威をもたらすと予想されます。民法、消費者契約法、特定商取引法は、同国のeコマース産業に関する主要な法律です。さらに、経済産業省は「電子商取引及び情報財取引等に関する解釈指針」を策定し、国内のeコマース・チャネルを通じた商品の売買に関連するさまざまな問題に対するこれらの法律の適用方法を明確にしています。上記の規制に加えて、eコマース・チャネルを通じて外国に製品を輸出入するユーザーや企業は、その国特有の規制を遵守しなければいけません。
日本の越境eコマース市場レポートハイライト:
- オンライン・ショッピングは、従来の店舗でのショッピングに比べ、オンラインでの購入プロセスがシンプルであることから、国内で勢いを増しています。ショッピング体験をさらに簡素化するため、複数のeコマース・ウェブサイトが独自のモバイル・アプリケーションを立ち上げ、携帯電話を通じたオンライン・ショッピングを促進しています。日本の企業や顧客にリーチするためにeコマース・チャネルを利用しているいくつかの外資系企業は、日本語に対応したアプリを発表しています。
- 玩具・ホビー・DIY分野は、予測期間中最も速いCAGR 7.9%で拡大すると予想されます。日本はアニメ、マンガ、ゲーム文化で有名です。
- 企業は、パーソナルケアやファッションなどのカテゴリーにおいて、米国や欧州の有名ブランドから高品質の製品を提供することに注力すると予想されます。日本のディストリビューターとの製品供給パートナーシップは、今後数年間も主要ベンダーの重要な戦略であり続けると予想されます。
目次
第1章 調査手法と範囲
第2章 エグゼクティブサマリー
第3章 日本の越境eコマース市場の変数、動向、範囲
- 市場系統の見通し
- 業界のバリューチェーン分析
- 市場力学
- 市場促進要因分析
- 市場抑制要因分析
- 市場機会分析
- 日本の越境Eコマース市場分析ツール
- 業界分析- ポーターのファイブフォース分析
- PESTEL分析
第4章 日本の越境eコマース市場:プラットフォームの推定・動向分析
- 日本の越境eコマース市場:重要なポイント
- 日本の越境eコマース市場:プラットフォームの動向と市場シェア分析、2022年と2030年
- B2B
- B2C
- C2C
第5章 日本の越境eコマース市場:用途の推定・動向分析
- 日本の越境eコマース市場:重要なポイント
- 日本の越境eコマース市場:用途の動きと市場シェア分析、2022年と2030年
- 飲食品
- パーソナルケア
- 家具・家電製品
- おもちゃ、ホビー、DIY
- エレクトロニクスとメディア
- ファッション
第6章 競合情勢
- 主要市場参入企業による最近の動向と影響分析
- 市場参入企業の分類
- Amazon.com, Inc.
- Rakuten Group, Inc.
- Kakaku.com, Inc.
- Yahoo! Japan
- Apple Inc.
- DMM.com
- Yodobashi Camera Co., Ltd.
List of Tables
- Table 1 List of abbreviations
- Table 2 Japan Cross-border E-commerce market, by platform, 2017 - 2030 (USD Million)
- Table 3 Japan Cross-border E-commerce market, by application, 2017 - 2030 (USD Million)
List of Figures
- Fig. 1 Market research process
- Fig. 2 Data triangulation techniques
- Fig. 3 Primary research pattern
- Fig. 4 Market research approaches
- Fig. 5 Value-chain-based sizing & forecasting
- Fig. 6 QFD modeling for market share assessment
- Fig. 7 Market formulation & validation
- Fig. 8 Japan cross-border e-commerce: Market outlook
- Fig. 9 Japan cross-border e-commerce market: Competitive insights
- Fig. 10 Parent market outlook
- Fig. 11 Related/ancillary market outlook
- Fig. 12 Penetration and growth prospect mapping
- Fig. 13 Industry value chain analysis
- Fig. 14 Japan cross-border e-commerce market driver impact
- Fig. 15 Japan cross-border e-commerce market restraint impact
- Fig. 16 Japan cross-border e-commerce market strategic initiatives analysis
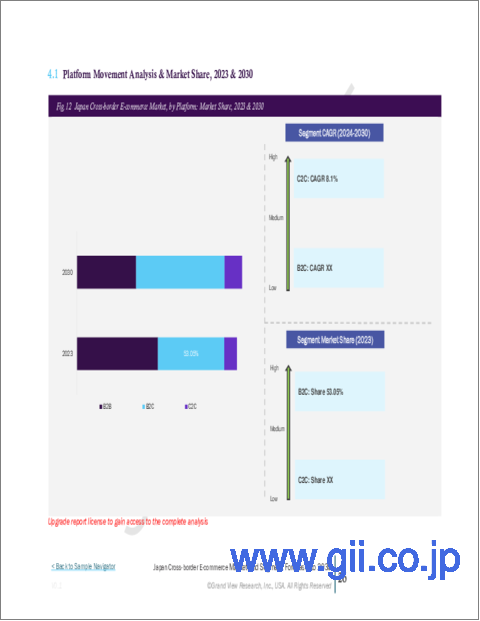
- Fig. 17 Japan cross-border e-commerce market: Platform movement analysis
- Fig. 18 Japan cross-border e-commerce market: Platform outlook and key takeaways
- Fig. 19 B2B market estimates and forecasts, 2017 - 2030
- Fig. 20 B2C market estimates and forecasts, 2017 - 2030
- Fig. 21 C2C market estimates and forecasts, 2017 - 2030
- Fig. 22 Japan cross-border e-commerce market: Application movement analysis
- Fig. 23 Japan cross-border e-commerce market: Application outlook and key takeaways
- Fig. 24 Food & beverage market estimates and forecasts, 2017 - 2030
- Fig. 25 Personal care market estimates and forecasts, 2017 - 2030
- Fig. 26 Furniture & appliances market estimates and forecasts, 2017 - 2030
- Fig. 27 Toys, hobby & DIY market estimates and forecasts, 2017 - 2030
- Fig. 28 Electronics & media market estimates and forecasts, 2017 - 2030
- Fig. 29 Fashion market estimates and forecasts, 2017 - 2030
Japan Cross-border E-commerce Market Growth & Trends:
The Japan cross-border e-commerce market size is expected to reach USD 5.09 billion by 2030, expanding at a CAGR of 6.9% from 2023 to 2030, according to a study conducted by Grand View Research, Inc. The significant traction achieved by the e-commerce industry over the past years is a testimony to how the internet has transformed the way goods and services are traded in the market. Several factors, including the increasing penetration of smartphones, access to high-speed internet, rising disposable incomes, and the growing user base of social media platforms, have helped the e-commerce industry gain increasing popularity across the globe over the years. Furthermore, by ensuring a safe and secured online platform to pay easily via payments gateway, banks and other market players have completely changed the shopping experience for customers.
The increasing urban population is contributing to the growth of the cross-border e-commerce market in Japan. People living in urban cities and towns have higher disposable incomes and better internet connectivity, which aids the use of e-commerce websites for shopping. Moreover, the urban population is putting increased emphasis on convenience and prefers online shopping over traditional in-store shopping. Such factors are also anticipated to power the market's growth over the forecast period.
Furthermore, increasing penetration of the internet is anticipated to be one of the major factors contributing to the increased use of e-commerce channels for shopping in the country. According to studies, Japan ranks seventh in the global list of countries with the highest number of internet users. As of June 2019, an estimated 93% of Japan's population used the internet. The country has witnessed a 152% growth in the number of internet users from 2000 to 2019. The high degree of internet penetration, coupled with the advent of 4G technology, is anticipated to drive the market in the country over the next six years.
The availability of information on the internet is another factor that is driving the market's growth. It allows customers to compare product prices across different countries, helping them land better deals. Similarly, sellers can earn more profits by selling products to countries that have a higher demand for specific products. Thus, internet penetration is an imperative factor influencing the growth of the market.
Stringent rules and regulations governing the e-commerce industry in the country are expected to pose a threat to the market over the forecast period. The Civil Code, the Consumer Contract Act, and the Act on Specified Commercial Transactions are the major legislative acts concerning the e-commerce industry in the country. Additionally, the Ministry of Economy, Trade and Industry (METI) has formulated the Interpretative Guidelines on Electronic Commerce and Information Property Trading to clarify how these laws are applied to different issues related to buying and selling of products via e-commerce channels in the country. In addition to the above-mentioned regulations, users or companies that import/export products to and from a foreign country via e-commerce channels have to comply with the regulations specific to those countries.
Japan Cross-border E-commerce Market Report Highlights:
- Online shopping is gaining momentum in the country owing to the simple nature of the online buying process as compared to traditional in-store shopping. In order to further simplify the shopping experience, several e-commerce websites have launched their own mobile applications to promote online shopping through mobile phones. Several foreign companies using e-commerce channels to reach Japanese businesses and customers are launching apps that support the Japanese language
- The toys, hobby & DIY segment is expected to expand at the fastest CAGR of 7.9% during the forecast period. Japan is renowned for its anime, manga, and gaming culture.
- Companies are expected to focus on providing quality products from well-known brands from the U.S. and Europe in categories such as personal care and fashion. Product availability partnerships with distributors in Japan are expected to remain a key strategy among key vendors in the coming years
Table of Contents
Chapter 1. Methodology and Scope
- 1.1. Market Segmentation & Scope
- 1.1.1. Platform
- 1.1.2. Application
- 1.1.3. Estimates and forecast timeline
- 1.2. Research Methodology
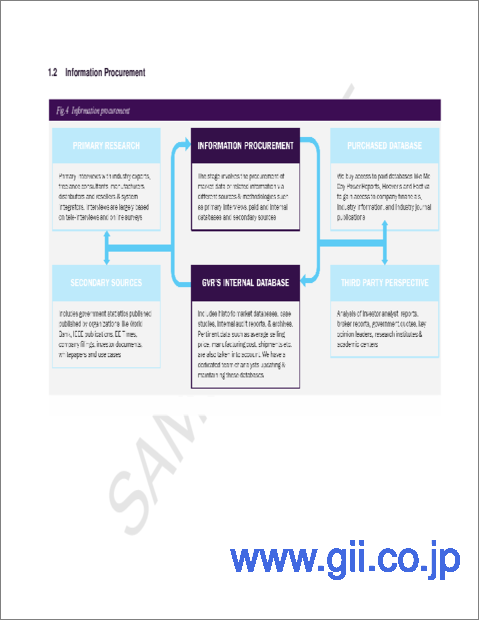
- 1.3. Information Procurement
- 1.3.1. Purchased database
- 1.3.2. GVR's internal database
- 1.3.3. Secondary sources
- 1.3.4. Primary research
- 1.3.5. Details of primary research
- 1.4. Information or Data Analysis
- 1.5. Market Formulation & Validation
- 1.6. Model Details
- 1.7. List of Secondary Sources
- 1.8. List of Primary Sources
- 1.9. Objectives
Chapter 2. Executive Summary
- 2.1. Market Outlook
- 2.2. Segment Outlook
- 2.2.1. Platform outlook
- 2.2.2. Application outlook
- 2.3. Competitive Insights
Chapter 3. Japan Cross-border E-commerce Market Variables, Trends & Scope
- 3.1. Market Lineage Outlook
- 3.2. Industry Value Chain Analysis
- 3.3. Market Dynamics
- 3.3.1. Market driver analysis
- 3.3.2. Market restraint analysis
- 3.3.3. Market opportunity analysis
- 3.4. Japan Cross-border E-commerce Market Analysis Tools
- 3.4.1. Industry analysis - Porter's Five Forces
- 3.4.1.1. Supplier power
- 3.4.1.2. Buyer power
- 3.4.1.3. Substitution threat
- 3.4.1.4. Threat of new entrant
- 3.4.1.5. Competitive rivalry
- 3.4.2. PESTEL analysis
- 3.4.2.1. Political landscape
- 3.4.2.2. Technological landscape
- 3.4.2.3. Economic landscape
- 3.4.1. Industry analysis - Porter's Five Forces
Chapter 4. Japan Cross-border E-commerce Market: Platform Estimates & Trend Analysis
- 4.1. Japan Cross-border E-commerce Market: Key Takeaways
- 4.2. Japan Cross-border E-commerce Market: Platform Movement & Market Share Analysis, 2022 & 2030
- 4.3. B2B
- 4.3.1. B2B market estimates and forecasts, 2017 to 2030 (USD Million)
- 4.4. B2C
- 4.4.1. B2C market estimates and forecasts, 2017 to 2030 (USD Million)
- 4.5. C2C
- 4.5.1. C2C market estimates and forecasts, 2017 to 2030 (USD Million)
Chapter 5. Japan Cross-border E-commerce Market: Application Estimates & Trend Analysis
- 5.1. Japan Cross-border E-commerce Market: Key Takeaways
- 5.2. Japan Cross-border E-commerce Market: Application Movement & Market Share Analysis, 2022 & 2030
- 5.3. Food & beverage
- 5.3.1. Food & beverage market estimates and forecasts, 2017 to 2030 (USD Million)
- 5.4. Personal care
- 5.4.1. Personal care market estimates and forecasts, 2017 to 2030 (USD Million)
- 5.5. Furniture & appliances
- 5.5.1. Furniture & appliances market estimates and forecasts, 2017 to 2030 (USD Million)
- 5.6. Toys, hobby & DIY
- 5.6.1. Toys, hobby & DIY market estimates and forecasts, 2017 to 2030 (USD Million)
- 5.7. Electronics & media
- 5.7.1. Electronics & media market estimates and forecasts, 2017 to 2030 (USD Million)
- 5.8. Fashion
- 5.8.1. Fashion market estimates and forecasts, 2017 to 2030 (USD Million)
Chapter 6. Competitive Landscape
- 6.1. Recent Developments & Impact Analysis, By Key Market Participants
- 6.2. Market Participant Categorization
- 6.2.1. Amazon.com, Inc.
- 6.2.1.1. Company overview
- 6.2.1.2. Financial performance
- 6.2.1.3. Product benchmarking
- 6.2.1.4. Strategic initiatives
- 6.2.2. Rakuten Group, Inc.
- 6.2.2.1. Company overview
- 6.2.2.2. Financial Performance
- 6.2.2.3. Product benchmarking
- 6.2.2.4. Strategic initiatives
- 6.2.3. Kakaku.com, Inc.
- 6.2.3.1. Company overview
- 6.2.3.2. Financial performance
- 6.2.3.3. Product benchmarking
- 6.2.3.4. Strategic initiatives
- 6.2.4. Yahoo! Japan
- 6.2.4.1. Company overview
- 6.2.4.2. Financial performance
- 6.2.4.3. Product benchmarking
- 6.2.4.4. Strategic initiatives
- 6.2.5. Apple Inc.
- 6.2.5.1. Company overview
- 6.2.5.2. Financial performance
- 6.2.5.3. Product benchmarking
- 6.2.5.4. Strategic initiatives
- 6.2.6. DMM.com
- 6.2.6.1. Company overview
- 6.2.6.2. Financial performance
- 6.2.6.3. Product benchmarking
- 6.2.6.4. Strategic initiatives
- 6.2.7. Yodobashi Camera Co., Ltd.
- 6.2.7.1. Company overview
- 6.2.7.2. Financial performance
- 6.2.7.3. Product benchmarking
- 6.2.7.4. Strategic initiatives
- 6.2.1. Amazon.com, Inc.
