|
|
市場調査レポート
商品コード
1404813
ボツリヌス毒素の市場規模、シェア、動向分析レポート:製品タイプ別、用途別、最終用途別、地域別、セグメント別予測、2024年~2030年Botulinum Toxin Market Size, Share & Trends Analysis Report By Product Type (Type A, Type B), By Application (Therapeutic, Aesthetic), By End-use (Dermatology Clinics, Cosmetic Centers & Medspas), By Region, And Segment Forecasts, 2024 - 2030 |
||||||
|
|
|||||||
カスタマイズ可能
|
|||||||


| ボツリヌス毒素の市場規模、シェア、動向分析レポート:製品タイプ別、用途別、最終用途別、地域別、セグメント別予測、2024年~2030年 |
|
出版日: 2023年11月29日
発行: Grand View Research
ページ情報: 英文 100 Pages
納期: 2~10営業日
|

- 全表示
- 概要
- 図表
- 目次
ボツリヌス毒素市場の成長と動向:
Grand View Research, Inc.の最新レポートによると、世界のボツリヌス毒素市場規模は2030年までに211億米ドルに達し、2024年から2030年までのCAGRは9.8%を記録すると予測されています。
ボツリヌス毒素は、ボツリヌス菌によって作られる毒素から形成される薬剤です。これらの薬剤は、特定の筋肉を麻痺させたり和らげたり、あるいは特定の神経を妨げることによって作用します。薬剤の効果は、治療法にもよりますが、数ヶ月程度持続します。ボツリヌス毒素は治療と美容の両方に使用されます。現在では、この薬剤は美容的な処置に多く採用されています。例えば、ボトックスは非侵襲的な美容処置であり、額のしわ、顔の小じわ、しわ、カラスの足跡などを減らすために使用されます。ボツリヌス毒素の需要は、低侵襲性または非侵襲性の美容処置に対する需要の高まりにより、予測期間中に成長すると予想されています。さらに、研究開発イニシアチブの高まりと相まって、治療用途への応用が増加しており、市場の拡大が見込まれています。
40歳以上の人口は身体的特徴に注目し、若々しい外見を持つことを望んでいます。そのため、特に先進諸国では、女性による唇の治療など、審美的な美しさを重視する傾向が高まっており、業界の成長に拍車がかかると予想されます。また、ボツリヌス毒素は、目尻のシワ、カラスの足跡、額のシワなど、加齢に関連するいくつかの症状を治療するために使用されます。従って、40歳以上の人々は、そのような老化の兆候に対してより脆弱です。そのため、ボツリヌス毒素の施術は40~55歳の間でより人気を集めており、それによって業界の成長を増大させています。さらに、片頭痛や頸部ジストニアなどの慢性疾患の症例が増加していることも、市場を牽引する可能性が高いです。
COVID-19の流行は市場に大きな影響を与えています。当初、ほとんどの国で閉鎖や世界の規制が敷かれたため、多くの美容治療や施術が中止されました。COVID-19の大流行は、医療業界全体のサプライチェーンに大きな混乱をもたらしました。しかし、ボトックスのようなボツリヌス毒素の売上は、パンデミックの間の需要増加により急増を観察しました。複数の形成外科医や皮膚科医が、オンライン会議やカンファレンスに出席し、診察や処置からの回復により多くの時間を割くために、最高の外見を保ちたいと望む個人にこのブームを認定しています。
ボツリヌス毒素市場レポート・ハイライト
- 2023年には、A型製品タイプが市場を独占しました。これは、ディスポートやボトックスを含むA型製品がほとんどの国で市販されており、臨床試験が実施され、副作用が少なく長期的に安全で効果的であることが証明されているためです。
- 治療用途セグメントは市場シェアの43.0%を占めました。
- 北米は、美容治療の技術的進歩の高まりと専門医やサービスプロバイダーの増加により、2023年の世界市場で46.9%以上の収益シェアを占めました。
- アジア太平洋地域は、患者人口の増加、美容施術に関する意識の高まり、急速な技術進歩により、予測期間中に11.1%の最高CAGRを記録すると予想されます。
目次
第1章 調査手法と範囲
第2章 エグゼクティブサマリー
第3章 ボツリヌス毒素市場:変数、動向、および範囲
- 市場セグメンテーションと範囲
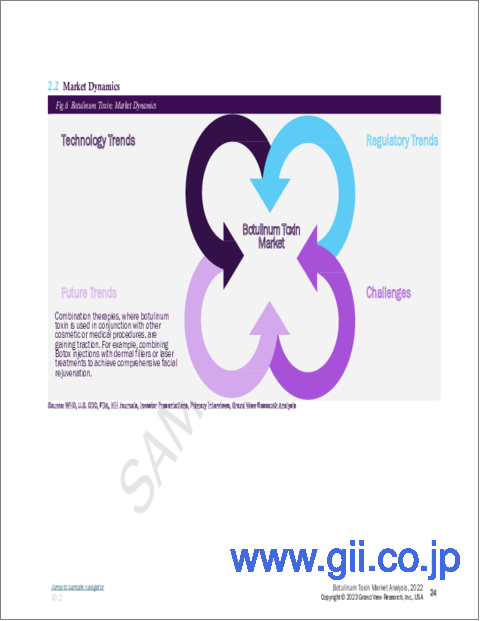
- 市場力学
- 市場促進要因分析
- 市場抑制要因分析
- ボツリヌス毒素:市場分析ツール
- 業界分析- ポーターのファイブフォース分析
- PESTEL分析
- COVID-19感染症の影響分析
第4章 ボツリヌス毒素市場:製品タイプセグメント分析
- ボツリヌス毒素:製品タイプの市場シェア分析、2023年および2030年
- タイプA
- タイプB
第5章 ボツリヌス毒素市場:アプリケーションセグメント分析
- ボツリヌス毒素:アプリケーション市場シェア分析、2023年および2030年
- 治療
- 美容
第6章 ボツリヌス毒素市場:最終用途セグメント分析
- ボツリヌス毒素:最終用途市場シェア分析、2023年および2030年
- 病院
- 皮膚科クリニック
- スパと化粧品センター
第7章 ボツリヌス毒素市場:地域分析
- ボツリヌス毒素:地域市場シェア分析、2023年および2030年
- 北米
- 北米ボツリヌス毒素市場、2018年から2030年
- 米国
- カナダ
- 欧州
- 欧州のボツリヌス毒素市場、2018年から2030年
- 英国
- ドイツ
- フランス
- イタリア
- スペイン
- デンマーク
- スウェーデン
- ノルウェー
- アジア太平洋地域
- アジア太平洋ボツリヌス毒素市場、2018年から2030年
- 中国
- インド
- 日本
- 韓国
- オーストラリア
- タイ
- ラテンアメリカ
- ラテンアメリカのボツリヌス毒素市場、2018年から2030年
- ブラジル
- メキシコ
- アルゼンチン
- 中東・アフリカ
- MEAボツリヌス毒素市場、2018年から2030年
- 南アフリカ
- サウジアラビア
- アラブ首長国連邦
- クウェート
第8章 企業プロファイル
- 主要市場参入企業による最近の動向と影響分析
- ボツリヌス毒素-市場シェア分析
- Ipsen Group
- 会社概要
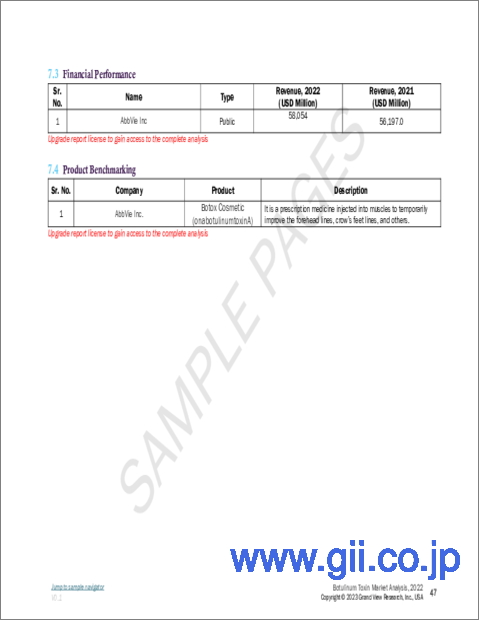
- 財務実績
- 製品のベンチマーク
- 戦略的取り組み
- Allergen Inc.
- 会社概要
- 財務実績
- 製品のベンチマーク
- 戦略的取り組み
- Medy-Tox, Inc.
- 会社概要
- 財務実績
- 製品のベンチマーク
- 戦略的取り組み
- Metabiologics
- 会社概要
- 財務実績
- 戦略的取り組み
- Merz Pharma
- 会社概要
- 財務実績
- 製品のベンチマーク
- 戦略的取り組み
- US Worldmeds
- 会社概要
- 財務実績
- 製品のベンチマーク
- 戦略的取り組み
- Evolus
- 会社概要
- 財務実績
- 製品のベンチマーク
- 戦略的取り組み
- Galderma
- 会社概要
- 財務実績
- 製品のベンチマーク
- 戦略的取り組み
- Lanzhou Institute Of Biological Products
- 会社概要
- 財務実績
- 製品のベンチマーク
- 戦略的取り組み
List of Tables
- Table 1 List of secondary sources
- Table 2 List of Abbreviations
- Table 3 Strategic collaborations by key players
List of Figures
- Fig. 1 Market research process
- Fig. 2 Information procurement
- Fig. 3 Primary research pattern
- Fig. 4 Market research approaches
- Fig. 5 Value-chain-based sizing & forecasting
- Fig. 6 QFD modeling for market share assessment
- Fig. 7 Market formulation & validation
- Fig. 8 Commodity flow analysis
- Fig. 9 Botulinum toxin market snapshot (2023)
- Fig. 10 Botulinum toxin market segmentation
- Fig. 11 Market driver relevance analysis (Current & future impact)
- Fig. 12 Market restraint relevance analysis (Current & future impact)
- Fig. 13 Penetration & growth prospect mapping
- Fig. 14 Porter's Five Forces analysis
- Fig. 15 SWOT analysis, by factor (political & legal, economic and technological)
- Fig. 16 Botulinum toxin market product type outlook: Segment dashboard
- Fig. 17 Botulinum toxin market: product type movement analysis
- Fig. 18 Type A market, 2018 - 2030 (USD Billion)
- Fig. 19 Type B market, 2018 - 2030 (USD Billion)
- Fig. 20 Botulinum toxin market application outlook: Segment dashboard
- Fig. 21 Botulinum toxin market: Application movement analysis
- Fig. 22 Therapeutic market, 2018 - 2030 (USD Billion)
- Fig. 23 Aesthetic market, 2018 - 2030 (USD Billion)
- Fig. 24 Botulinum toxin market end-use outlook: Segment dashboard
- Fig. 25 Botulinum toxin market: End-use movement analysis
- Fig. 26 Hospitals market, 2018 - 2030 (USD Billion)
- Fig. 27 Dermatology clinics market, 2018 - 2030 (USD Billion)
- Fig. 28 Cosmetic centers and medspas market, 2018 - 2030 (USD Billion)
- Fig. 29 Regional market: Key takeaways
- Fig. 30 Regional outlook: 2023 & 2030
- Fig. 31 North America market, 2018 - 2030 (USD Billion)
- Fig. 32 U.S. market, 2018 - 2030 (USD Billion)
- Fig. 33 Key country dynamics
- Fig. 34 Canada market, 2018 - 2030 (USD Billion)
- Fig. 35 Key country dynamics
- Fig. 36 Europe market, 2018 - 2030
- Fig. 37 UK market, 2018 - 2030 (USD Billion)
- Fig. 38 Key country dynamics
- Fig. 39 Germany market, 2018 - 2030 (USD Billion)
- Fig. 40 Key country dynamics
- Fig. 41 France market, 2018 - 2030 (USD Billion)
- Fig. 42 Key country dynamics
- Fig. 43 Italy market, 2018 - 2030 (USD Billion)
- Fig. 44 Key country dynamics
- Fig. 45 Spain market, 2018 - 2030 (USD Billion)
- Fig. 46 Key country dynamics
- Fig. 47 Denmark market, 2018 - 2030 (USD Billion)
- Fig. 48 Key country dynamics
- Fig. 49 Sweden market, 2018 - 2030 (USD Billion)
- Fig. 50 Key country dynamics
- Fig. 51 Norway market, 2018 - 2030 (USD Billion)
- Fig. 52 Key country dynamics
- Fig. 53 Asia Pacific market, 2018 - 2030 (USD Billion)
- Fig. 54 China market, 2018 - 2030 (USD Billion)
- Fig. 55 Key country dynamics
- Fig. 56 Japan market, 2018 - 2030 (USD Billion)
- Fig. 57 Key country dynamics
- Fig. 58 India market, 2018 - 2030 (USD Billion)
- Fig. 59 Key country dynamics
- Fig. 60 South Korea market, 2018 - 2030 (USD Billion)
- Fig. 61 Key country dynamics
- Fig. 62 Australia market, 2018 - 2030 (USD Billion)
- Fig. 63 Key country dynamics
- Fig. 64 Thailand market, 2018 - 2030 (USD Billion)
- Fig. 65 Key country dynamics
- Fig. 66 Latin America market, 2018 - 2030 (USD Billion)
- Fig. 67 Brazil market, 2018 - 2030 (USD Billion)
- Fig. 68 Key country dynamics
- Fig. 69 Mexico market, 2018 - 2030 (USD Billion)
- Fig. 70 Key country dynamics
- Fig. 71 Argentina market, 2018 - 2030 (USD Billion)
- Fig. 72 Key country dynamics
- Fig. 73 MEA market, 2018 - 2030 (USD Billion)
- Fig. 74 South Africa market, 2018 - 2030 (USD Billion)
- Fig. 75 Key country dynamics
- Fig. 76 Saudi Arabia market, 2018 - 2030 (USD Billion)
- Fig. 77 Key country dynamics
- Fig. 78 UAE market, 2018 - 2030 (USD Billion)
- Fig. 79 Key country dynamics
- Fig. 80 Kuwait market, 2018 - 2030 (USD Billion)
- Fig. 81 Key country dynamics
Botulinum Toxin Market Growth & Trends:
The global botulinum toxin market size is expected to reach USD 21.1 billion by 2030, according to a new report by Grand View Research, Inc., registering a CAGR of 9.8% from 2024 to 2030. Botulinum toxin is a drug formed from a toxin built by the bacteria clostridium botulinum. These drugs work by paralyzing or tempering specific muscles or by hindering certain nerves. The effect of the drug lasts for about a few months, depending on the treatment. Botulinum toxin is used for both therapeutic and aesthetic applications. Nowadays, the drug is highly adopted for aesthetic procedures. For instance, Botox is a non-invasive cosmetic procedure and is used to reduce forehead creases, facial fine lines, wrinkles, and crow's feet among others. The demand for botulinum toxin is expected to grow during the forecast period owing to the growing demand for minimally invasive or non-invasive procedures in aesthetics. Furthermore, increasing application in therapeutic applications, coupled with growing R&D initiatives, is expected to expand the market.
Population aged above 40 years are focusing on the physical features and wish to have a younger look. Thus, rising emphasis on aesthetic beauty, for instance, lip treatments by women, especially in developed countries is anticipated to fuel the industry growth. Also, botulinum toxin is used to treat several age-related conditions such as glabellar lines, crow's feet, and forehead lines. Hence, people above the age of 40 are more vulnerable to such signs of aging. Therefore, procedures of botulinum toxin are gaining more popularity among individuals aged between 40-55 years, thereby augmenting the industry growth. Furthermore, rising cases of chronic disorders such as migraine and cervical dystonia are likely to drive the market.
The COVID-19 outbreak has significantly affected the market. Initially, due to lockdown and global restrictions being imposed in most countries, many aesthetic treatments and procedures were halted. The COVID-19 pandemic has caused a huge disruption in the supply chain of the overall medical industry. However, the sales of botulinum toxins such as botox observed a surge due to the increased demand during the pandemic. Several plastic surgeons and dermatologists are accrediting the boom to individuals wishing to put their finest appearance for online meetings and conferences and greater time to attend consultations and recover from procedures.
Botulinum Toxin Market Report Highlights:
- The type A product type segment dominated the market in 2023. This is because type A products including Dysport and Botox are commercially available in the market in most countries and have been clinically tested and proven to be safe and effective in the long term with minimal side effects.
- The therapeutic application segment accounted for 43.0% of the market share
- North America dominated the global market in 2023 with a revenue share of over 46.9% owing to the rising technological advancements for cosmetic treatments and the increasing number of specialists and service providers
- Asia Pacific is expected to register the highest CAGR of 11.1% over the forecast period owing to the growing patient population, rising awareness regarding aesthetic procedures, and rapid technological advancements
Table of Contents
Chapter 1 Methodology And Scope
- 1.1 Market Segmentation & Scope
- 1.1.1 Product Type
- 1.1.2 Application
- 1.1.3 End-Use
- 1.1.4 Regional Scope
- 1.1.5 Estimates And Forecast Timeline
- 1.2 Research Methodology
- 1.3 Information Procurement
- 1.3.1 Purchased Database
- 1.3.2 GVR's Internal Database
- 1.3.3 Secondary Sources
- 1.3.4 Primary Research
- 1.3.5 Details Of Primary Research
- 1.4 Information Or Data Analysis
- 1.4.1 Data Analysis Models
- 1.5 Market Formulation & Validation
- 1.6 Model Details
- 1.6.1 Commodity Flow Analysis (Model 1)
- 1.7 List Of Secondary Sources
- 1.8 List Of Primary Sources
- 1.9 List Of Abbreviations
- 1.10 Objectives
- 1.10.1 Objective - 1
- 1.10.2 Objective - 2
- 1.10.3 Objective - 3
Chapter 2 Executive Summary
- 2.1 Market Snapshot
- 2.2 Segment Snapshot
- 2.3 Competitive Landscape Snapshot
Chapter 3 Botulinum Toxin Market: Variables, Trends, & Scope
- 3.1 Market Segmentation And Scope
- 3.2 Market Dynamics
- 3.2.1 Market Driver Analysis
- 3.2.2.1 Increasing Number Of Patients Having Neurological Disorders
- 3.2.2.2 Rising Preference For Non-Invasive Or Minimally Invasive Procedures
- 3.2.2.3 Increasing Concern Regarding Aesthetic Appearance In 40-54 Age Group Has Increased The Adoption Rate
- 3.2.2 Market Restraint Analysis
- 3.2.2.1 High Cost Of Cosmetic Procedure
- 3.2.1 Market Driver Analysis
- 3.3 Botulinum Toxin: Market Analysis Tools
- 3.3.1 Industry Analysis - Porter's
- 3.3.2 Pestel Analysis
- 3.4 COVID-19 Impact Analysis
Chapter 4 Botulinum Toxin Market: Product Type Segment Analysis
- 4.1 Botulinum Toxin: Product Type Market Share Analysis, 2023 & 2030
- 4.2 Type A
- 4.2.1 Type A Market Estimates And Forecasts, 2018 - 2030 (USD Billion)
- 4.2.1.1 Botox
- 4.2.1.2 Dysport
- 4.2.1.3 Xeomin
- 4.2.1.4 Others
- 4.2.2 Type B
- 4.2.2.1 Type B Market Estimates And Forecasts, 2018 - 2030 (USD Billion)
- 4.2.1 Type A Market Estimates And Forecasts, 2018 - 2030 (USD Billion)
Chapter 5 Botulinum Toxin Market: Application Segment Analysis
- 5.1 Botulinum Toxin: Application Market Share Analysis, 2023 & 2030
- 5.2 Therapeutic
- 5.2.1 Therapeutic Market Estimates And Forecasts, 2018 - 2030 (USD Billion)
- 5.2.1.1 Chronic Migraine
- 5.2.1.2 Overactive Bladder
- 5.2.1.3 Cervical Dystonia
- 5.2.1.4 Spasticity
- 5.2.1.5 Others
- 5.2.1 Therapeutic Market Estimates And Forecasts, 2018 - 2030 (USD Billion)
- 5.3 Aesthetic
- 5.3.1 Aesthetic Market Estimates And Forecasts, 2018 - 2030 (USD Billion)
- 5.3.1.1 Glabellar Lines
- 5.3.1.2 Crow's Feet
- 5.3.1.3 Forehead Lines
- 5.3.1.4 Others
- 5.3.1 Aesthetic Market Estimates And Forecasts, 2018 - 2030 (USD Billion)
Chapter 6 Botulinum Toxin Market: End-Use Segment Analysis
- 6.1 Botulinum Toxin: End-Use Market Share Analysis, 2023 & 2030
- 6.2 Hospitals
- 6.2.1 Hospitals Market Estimates And Forecasts, 2018 - 2030 (USD Billion)
- 6.3 Dermatology Clinics
- 6.3.1 Dermatology Clinics Market Estimates And Forecasts, 2018 - 2030 (USD Billion)
- 6.4 Spas And Cosmetic Centers
- 6.4.1 Spas And Cosmetic Centers Market Estimates And Forecasts, 2018 - 2030 (USD Billion)
Chapter 7 Botulinum Toxin Market: Regional Analysis
- 7.1 Botulinum Toxin: Regional Market Share Analysis, 2023 & 2030
- 7.2 North America
- 7.2.1 North America Botulinum Toxin Market, 2018 - 2030 (USD Billion)
- 7.2.2 U.S.
- 7.2.2.1 Key Country Dynamics
- 7.2.2.2 U.S. Botulinum Toxin Market, 2018 - 2030 (USD Billion)
- 7.2.3 Canada
- 7.2.3.1 Key Country Dynamics
- 7.2.3.2 Canada Botulinum Toxin Market, 2018 - 2030 (USD Billion)
- 7.3 Europe
- 7.3.1 Europe Botulinum Toxin Market, 2018 - 2030 (USD Billion)
- 7.3.2 UK
- 7.3.2.1 Key Country Dynamics
- 7.3.2.2 UK Botulinum Toxin Market, 2018 - 2030 (USD Billion)
- 7.3.3 Germany
- 7.3.3.1 Key Country Dynamics
- 7.3.3.2 Germany Botulinum Toxin Market, 2018 - 2030 (USD Billion)
- 7.3.4 France
- 7.3.4.1 Key Country Dynamics
- 7.3.4.2 France Botulinum Toxin Market, 2018 - 2030 (USD Billion)
- 7.3.5 Italy
- 7.3.5.1 Key Country Dynamics
- 7.3.5.2 Italy Botulinum Toxin Market, 2018 - 2030 (USD Billion)
- 7.3.6 Spain
- 7.3.6.1 Key Country Dynamics
- 7.3.6.2 Spain Botulinum Toxin Market, 2018 - 2030 (USD Billion)
- 7.3.7 Denmark
- 7.3.7.1 Key Country Dynamics
- 7.3.7.2 Denmark Botulinum Toxin Market, 2018 - 2030 (USD Billion)
- 7.3.8 Sweden
- 7.3.8.1 Key Country Dynamics
- 7.3.8.2 Sweden Botulinum Toxin Market, 2018 - 2030 (USD Billion)
- 7.3.9 Norway
- 7.3.9.1 Key Country Dynamics
- 7.3.9.2 Norway Botulinum Toxin Market, 2018 - 2030 (USD Billion)
- 7.4 Asia Pacific
- 7.4.1 Asia Pacific Botulinum Toxin Market, 2018 - 2030 (USD Billion)
- 7.4.2 China
- 7.4.2.1 Key Country Dynamics
- 7.4.2.2 China Botulinum Toxin Market, 2018 - 2030 (USD Billion)
- 7.4.3 India
- 7.4.3.1 Key Country Dynamics
- 7.4.3.2 India Botulinum Toxin Market, 2018 - 2030 (USD Billion)
- 7.4.4 Japan
- 7.4.4.1 Key Country Dynamics
- 7.4.4.2 Japan Botulinum Toxin Market, 2018 - 2030 (USD Billion)
- 7.4.5 South Korea
- 7.4.5.1 Key Country Dynamics
- 7.4.5.2 South Korea Botulinum Toxin Market, 2018 - 2030 (USD Billion)
- 7.4.6 Australia
- 7.4.6.1 Key Country Dynamics
- 7.4.6.2 Australia Botulinum Toxin Market, 2018 - 2030 (USD Billion)
- 7.4.7 Thailand
- 7.4.7.1 Key Country Dynamics
- 7.4.7.2 Thailand Botulinum Toxin Market, 2018 - 2030 (USD Billion)
- 7.5 Latin America
- 7.5.1 Latin America Botulinum Toxin Market, 2018 - 2030 (USD Billion)
- 7.5.2 Brazil
- 7.5.2.1 Key Country Dynamics
- 7.5.2.2 Brazil Botulinum Toxin Market, 2018 - 2030 (USD Billion)
- 7.5.3 Mexico
- 7.5.3.1 Key Country Dynamics
- 7.5.3.2 Mexico Botulinum Toxin Market, 2018 - 2030 (USD Billion)
- 7.5.4 Argentina
- 7.6.4.1 Key Country Dynamics
- 7.6.4.2 Argentina Botulinum Toxin Market, 2018 - 2030 (USD Billion)
- 7.6 MEA
- 7.6.1 MEA Botulinum Toxin Market, 2018 - 2030 (USD Billion)
- 7.6.2 South Africa
- 7.6.2.1 Key Country Dynamics
- 7.6.2.2 South Africa Botulinum Toxin Market, 2018 - 2030 (USD Billion)
- 7.6.3 Saudi Arabia
- 7.6.3.1 Key Country Dynamics
- 7.6.3.2 Saudi Arabia Botulinum Toxin Market, 2018 - 2030 (USD Billion)
- 7.6.4 UAE
- 7.6.4.1 Key Country Dynamics
- 7.6.4.2 UAE Botulinum Toxin Market, 2018 - 2030 (USD Billion)
- 7.6.5 Kuwait
- 7.6.5.1 Key Country Dynamics
- 7.6.5.2 Kuwait Botulinum Toxin Market, 2018 - 2030 (USD Billion)
Chapter 8 Company Profiles
- 8.1. Recent Developments & Impact Analysis, By Key Market Participants
- 8.2. Botulinum Toxin- Market Share Analysis
- 8.3. Ipsen Group
- 8.3.1 Company Overview
- 8.3.2 Financial Performance
- 8.3.3 Product Benchmarking
- 8.3.4 Strategic Initiatives
- 8.4. Allergen Inc.
- 8.4.1 Company Overview
- 8.4.2 Financial Performance
- 8.4.3 Product Benchmarking
- 8.4.4 Strategic Initiatives
- 8.5 Medy-Tox, Inc.
- 8.5.1 Company Overview
- 8.5.2 Financial Performance
- 8.5.3 Product Benchmarking
- 8.5.4 Strategic Initiatives
- 8.6 Metabiologics
- 8.6.1 Company Overview
- 8.6.2 Financial Performance
- 8.6.3 Strategic Initiatives
- 8.7 Merz Pharma
- 8.7.1 Company Overview
- 8.7.2 Financial Performance
- 8.7.3 Product Benchmarking
- 8.7.4 Strategic Initiatives
- 8.8 US Worldmeds
- 8.8.1 Company Overview
- 8.8.2 Financial Performance
- 8.8.3 Product Benchmarking
- 8.8.4 Strategic Initiatives
- 8.9 Evolus
- 8.9.1 Company Overview
- 8.9.2 Financial Performance
- 8.9.3 Product Benchmarking
- 8.9.4 Strategic Initiatives
- 8.10 Galderma
- 8.10.1 Company Overview
- 8.10.2 Financial Performance
- 8.10.3 Product Benchmarking
- 8.10.4 Strategic Initiatives
- 8.11 Lanzhou Institute Of Biological Products
- 8.11.1 Company Overview
- 8.11.2 Financial Performance
- 8.11.3 Product Benchmarking
- 8.11.4 Strategic Initiatives
