|
|
市場調査レポート
商品コード
1404763
米国の自動車用電池アフターマーケット市場規模、シェア、動向分析レポート:電池タイプ別、車種別、流通チャネル別、セグメント別予測(2023年~2030年)U.S. Automotive Battery Aftermarket Size, Share & Trends Analysis Report By Battery Type (Lithium-ion, Lead Acid, Nickel-based, Sodium-ion, Others), By Vehicle Type, By Distribution Channel, And Segment Forecasts, 2023 - 2030 |
||||||
カスタマイズ可能
|
|||||||
| 米国の自動車用電池アフターマーケット市場規模、シェア、動向分析レポート:電池タイプ別、車種別、流通チャネル別、セグメント別予測(2023年~2030年) |
|
出版日: 2023年11月24日
発行: Grand View Research
ページ情報: 英文 200 Pages
納期: 2~10営業日
|
- 全表示
- 概要
- 図表
- 目次
米国の自動車用電池アフターマーケットの成長と動向
米国の自動車用電池アフターマーケットの市場規模は、2023年~2030年にCAGR 5.7%を記録し、2030年には236億米ドルに達すると予測されています。電気自動車の世界の販売は予測期間中に大幅に増加すると予想され、これは市場成長を後押しする主要要因の1つとして浮上しています。
充電コンセントの利用可能性の顕著な上昇とハイブリッド電気自動車(HEV)製造のための財政的インセンティブは、最近の電気自動車市場の成長の重要な要因として浮上しています。従来の内燃機関車(ICE)に比べて電気自動車のランニングコストが低いことも、市場成長を後押しすると予想されます。さまざまな政府規制機関が、世界的に電気自動車の利用拡大を支援する政策を実施しています。加えて、汚染レベルの増加、エネルギー枯渇、地球温暖化、生物学的危険などの環境問題が、消費者の嗜好を従来型自動車から電気自動車へと大幅にシフトさせています。
電気自動車の大手メーカーも、生産メカニズムに環境に優しい素材を取り入れるようになってきています。例えばFordは、電気自動車の外部構造の製造にバイオベース材料やリサイクル材料の使用を開始しています。一方、日産は電気自動車に関して、環境に優しいという点で異なるアプローチをとっています。同社は、電気自動車の内外装部品の製造に、古い自動車部品、水筒、ビニール袋を多用しています。
自動車アフターマーケットは、デジタル化と自動車修理・メンテナンス・サービス提供技術の融合により、従来の自動車部品販売・提供のパラダイムがダイナミックに変化しています。この業界では、カスタムメイドの部品を経済的な価格で提供する新興企業がいくつか登場しています。例えば、CarParts.comやUS Auto Parts Network, Inc.は、自動車をメンテナンスするための世界の自動車予備部品サプライヤーです。これらの新興企業はまた、カスタマイズの推奨とともに、自動車部品に支払うべき適正価格の見積もりを提案しています。
同様に、Auto Parts Warehouseは、ユーザーが簡単に経済的な価格で部品を比較・入手することを可能にし、バッテリー交換やメンテナンスの見積もりを即座に提供します。この融合により、部品サプライヤーは、修理や交換の場合、遠隔地からでもピックアップ・アンド・ドロップ・サービスを提供できるようになりました。デジタル化により、自動車修理・メンテナンスサービス提供における透明性が実現しました。自動車部品サプライヤーのデジタル化により、OEMはボタンをクリックするだけで、世界中の顧客の自宅やオフィスに直接配送できるようになりました。
しかし、原材料価格の変動が米国の自動車用電池アフターマーケットの成長を妨げています。酸化鉛、硫酸、ポリプロピレンは、バッテリー製造に使用される主要原材料です。電池のケースに使用されるポリプロピレンは、炭素化合物と石油に由来します。ポリプロピレンの主原料は原油・天然ガスです。したがって、原油・天然ガス価格の変動は、電池製造に使用されるプラスチックのコスト力学を構成する上で重要な役割を果たします。
原油は、大きな需給ギャップのために、過去数年間で価格が大きく変動しました。その結果、いくつかの国は、国内供給を一定に保つために原油資源を蓄える政策を実施しました。原油価格の変動は、その下流の誘導品の製造コストにも直接的な影響を及ぼします。
主要な製造業者や販売業者は、米国の各州における地理的拡大や合併・買収に頼ることで、そのサービス範囲を継続的に拡大しています。例えば2017年4月、A123 Systems, LLCはミシガン州に新本社を建設する計画を発表しました。この戦略は、近い将来、米国での存在感を高める上で同社を支援する可能性が高いです。2014年6月には、米国カリフォルニア州と中国を拠点とするLeyden Energyの知的財産関連資産を買収しました。この戦略的買収により、同社はLeyden Energyのリチウムイオン技術や電池材料にアクセスできるようになり、同社の技術的専門性が高まると予想されます。
米国では、自動車アフターマーケット用電池のほとんどは、East Penn Manufacturing Company、Exide Industries Ltd.、Johnson Controlsの大手3社によって製造されています。これらの企業は様々なブランド名でバッテリーを提供しており、小売業者の希望する仕様に合わせてバッテリーを製造しているため、製品の仕様が異なる場合があります。市場の半分以上にバッテリーを供給しているJohnson Controlsは、2018年11月に、自動車用電池事業を含むパワーソリューション事業をBrookfield Business Partners L.P.に売却することで合意したと発表しました。
米国自動車用電池アフターマーケットレポートのハイライト
- ハイブリッド電気自動車(HEV)開発に向けた投資とイニシアティブの増加が市場成長を促進すると予想されます。例えば、米国再生・再投資法(American Recovery and Reinvestment Act)は、HEVを開発するための資金を民間および政府機関に助成しています。
- 小売セグメントは、2022年に57.7%と最大の収益シェアを占めました。
- 乗用車セグメントは、2022年に56.5%以上の最大の収益シェアを獲得しました。乗用車の走行台数の増加が車載電池の需要増につながっており、これらの車両は摩耗や損傷により定期的な電池交換を必要としています。
目次
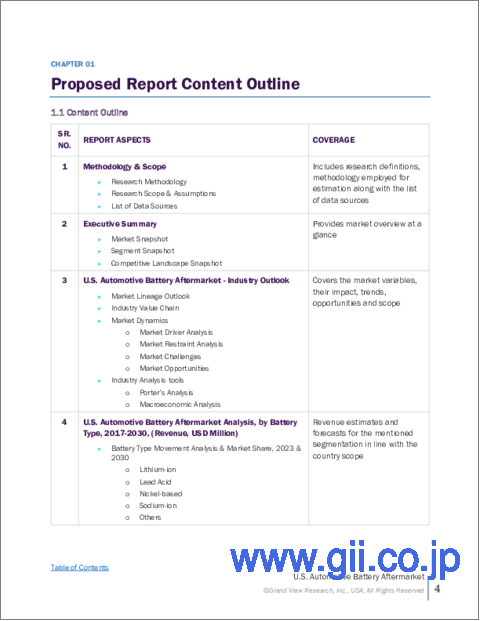
第1章 調査手法と範囲
第2章 エグゼクティブサマリー
第3章 米国の自動車用電池アフターマーケットの変数、動向、範囲
- 市場系統の見通し
- 業界のバリューチェーン分析
- 市場力学
- 市場促進要因分析
- 市場抑制要因分析
- 市場機会分析
- 米国の自動車用電池アフターマーケット分析ツール
- 業界分析:ポーターのファイブフォース分析
- PESTEL分析
第4章 米国の自動車用電池アフターマーケット:電池タイプの推定・動向分析
- 米国の自動車用電池アフターマーケット:重要ポイント
- 米国の自動車用電池アフターマーケット:動向と市場シェア分析(2023年・2030年)
- リチウムイオン
- 鉛酸
- ニッケル系
- ナトリウムイオン
- その他
第5章 米国の自動車用電池アフターマーケット:車種の推定・動向分析
- 米国の自動車用電池アフターマーケット:重要ポイント
- 米国の自動車用電池アフターマーケット:動向と市場シェア分析(2023年・2030年)
- 乗用車
- 電気自動車
- 商用車
- その他
第6章 米国の自動車用電池アフターマーケット:流通チャネルの推定・動向分析
- 米国の自動車用電池アフターマーケット:重要ポイント
- 米国の自動車用電池アフターマーケット:動向と市場シェア分析(2023年・2030年)
- 小売
- Eコマース
- その他
第7章 競合情勢
- 主要市場参入企業による最近の動向と影響分析
- 市場参入企業の分類
- A123 Systems, LLC
- East Penn Manufacturing Company
- EnerSys
- Aptiv
- Exide Technologies
- Johnson Controls
- NEC Corporation
- Samsung SDI Co., Ltd
- Tesla
- Interstate Batteries
List of Tables
- Table 1 List of abbreviation
- Table 2 U.S. automotive battery aftermarket, by battery type, 2017 - 2030 (USD Billion)
- Table 3 U.S. automotive battery aftermarket, by battery type, 2017 - 2030 (Million Units)
- Table 4 U.S. automotive battery aftermarket, by vehicle type, 2017 - 2030 (USD Billion)
- Table 5 U.S. automotive battery aftermarket, by vehicle type, 2017 - 2030 (Million Units)
- Table 6 U.S. automotive battery aftermarket, by distribution channel, 2017 - 2030 (USD Billion)
- Table 7 U.S. automotive battery aftermarket, by distribution channel, 2017 - 2030 (Million Units)
List of Figures
- Fig. 1 Market research process
- Fig. 2 Data triangulation techniques
- Fig. 3 Primary research pattern
- Fig. 4 Market research approaches
- Fig. 5 Value-chain-based sizing & forecasting
- Fig. 6 QFD modeling for market share assessment
- Fig. 7 Market formulation & validation
- Fig. 8 U.S. automotive battery aftermarket: Market outlook
- Fig. 9 U.S. automotive battery aftermarket: Competitive insights
- Fig. 10 Parent market outlook
- Fig. 11 Related/ancillary market outlook
- Fig. 12 Penetration and growth prospect mapping
- Fig. 13 Vehicle type value chain analysis
- Fig. 14 U.S. automotive battery aftermarket driver impact
- Fig. 15 U.S. automotive battery aftermarket restraint impact
- Fig. 16 U.S. automotive battery aftermarket strategic initiatives analysis
- Fig. 17 U.S. automotive battery aftermarket: Battery type movement analysis
- Fig. 18 U.S. automotive battery aftermarket: Battery type outlook and key takeaways
- Fig. 19 Lithium-ion market estimates and forecasts, 2017 - 2030
- Fig. 20 Lead acid market estimates and forecasts, 2017 - 2030
- Fig. 21 Nickel-based market estimates and forecasts, 2017 - 2030
- Fig. 22 Sodium-ion market estimates and forecasts, 2017 - 2030
- Fig. 23 Others market estimates and forecasts, 2017 - 2030
- Fig. 24 U.S. automotive battery aftermarket: Vehicle type movement analysis
- Fig. 25 U.S. automotive battery aftermarket: Vehicle type outlook and key takeaways
- Fig. 26 Passenger vehicle market estimates and forecasts, 2017 - 2030
- Fig. 27 Electric vehicle market estimates and forecasts, 2017 - 2030
- Fig. 28 Commercial vehicle market estimates and forecasts, 2017 - 2030
- Fig. 29 Others market estimates and forecasts, 2017 - 2030
- Fig. 30 U.S. automotive battery aftermarket: Distribution channel movement analysis
- Fig. 31 U.S. automotive battery aftermarket: Distribution channel outlook and key takeaways
- Fig. 32 Passenger vehicle market estimates and forecasts, 2017 - 2030
- Fig. 33 Electric vehicle market estimates and forecasts, 2017 - 2030
- Fig. 34 Commercial vehicle market estimates and forecasts, 2017 - 2030
- Fig. 35 Others market estimates and forecasts, 2017 - 2030
U.S. Automotive Battery Aftermarket Growth & Trends
The U.S. automotive battery aftermarket size is expected to reach USD 23.60 billion by 2030, registering a CAGR of 5.7% from 2023 to 2030, according to a new report by Grand View Research, Inc. Worldwide sales of electric vehicles are anticipated to increase significantly over the forecast period, which will emerge as one of the key factors boosting market growth.
A notable rise in availability of charging outlets and financial incentives for manufacturing Hybrid electric vehicles (HEVs) has emerged as a crucial factor for the growth of the electric vehicle market in the recent past. Lower running cost of electric vehicles compared to that of conventional Internal Combustion Engine (ICE)-operated vehicles is also expected to bolster market growth. Various government regulatory agencies have implemented policies that support increased usage of electric vehicles globally. In addition, environmental issues, such as increasing levels of pollution, energy depletion, global warming, and biological hazards, are leading to a substantial shift in consumer preferences from conventional vehicles to electric vehicles.
Leading manufacturers of electric vehicles are also increasingly incorporating eco-friendly materials in their production mechanisms. Ford, for instance, has started using bio-based and recycled materials to manufacture external structures of its electric vehicles. Nissan, on the other hand, is using a different approach to being environment-friendly when it comes to its electric vehicles. The company extensively uses old car parts, water bottles, and plastic bags to manufacture interior and exterior parts of these vehicles.
The automotive aftermarket is witnessing a dynamic phase change in customary automotive component sales and delivery paradigms with the convergence of digitalization and auto repair and maintenance service delivery techniques. Several start-ups have surfaced in the industry, delivering custom-made components at economical rates. For instance, CarParts.com and US Auto Parts Network, Inc. are leading global auto spare parts suppliers for maintaining vehicles. These start-ups also suggest an estimate for the right price to be paid for an auto component along with recommendations for customizations.
Similarly, 'Auto Parts Warehouse' allows users to compare and get components at economical rates with ease and delivers instant quotes for battery replacement and maintenance. This convergence enables component suppliers to provide pickup and drop services even from remote locations in cases of repair and replacements. Digitalization has, thereby, enabled transparency in auto repair and maintenance service delivery. Digitalization in automotive component suppliers has enabled OEMs to deliver directly to the customer's home or office from across the globe, at the click of a button.
However, fluctuating raw material prices are hampering the growth of the U.S. automotive battery aftermarket. Lead oxide, sulfuric acid, and polypropylene are key raw materials used to manufacture batteries. Polypropylene, which is used to make cases for batteries, is derived from carbon compound and petroleum. Crude oil and natural gas derivatives are the primary feedstock used to produce polypropylene. Therefore, fluctuation in prices of crude oil and natural gas plays a key role in structuring the cost dynamics of plastics used for battery manufacturing.
Crude oil witnessed tremendous fluctuation in prices over the past few years owing to the large supply-demand gap. As a result, several nations implemented policies in order to stock up on crude oil resources to maintain constant internal supply. Volatility in prices of crude oil also has a direct impact on the manufacturing cost of its downstream derivatives.
Key manufacturers and distributors are continuously expanding their service reach by resorting to geographical expansion and mergers and acquisition across U.S. states. In April 2017, for instance, A123 Systems, LLC announced plans to construct a new headquarter in Michigan. This strategy is likely to help the company in amplifying its presence in U.S. over the near future. In June 2014, the company acquired intellectual property-related assets of Leyden Energy, based in California, U.S., and China. This strategic acquisition is projected to benefit the company in gaining access to the latter's lithium-ion technology and battery materials, thus widening the former's technological expertise.
In U.S., most automotive aftermarket batteries are manufactured by three leading companies, namely East Penn Manufacturing Company, Exide Industries Ltd., and Johnson Controls. These companies offer batteries under various brand names, which manufactures batteries according to desired specification of retailers, so the specifications of their products may vary. Johnson Controls, which supplies batteries to more than half market, announced in November 2018 that it has agreed to sell its power solutions business, which involves automotive battery business, to Brookfield Business Partners L.P. The transaction was valued at nearly USD 13.2 billion.
U.S. Automotive Battery Aftermarket Report Highlights:
- Rising investments and initiatives aimed at developing Hybrid Electric Vehicles (HEV) are expected to propel market growth. For instance, the U.S. American Recovery and Reinvestment Act grants funds to private and government entities to develop HEVs
- The retail/brick segment accounted for the largest revenue share of 57.7% in 2022.
- The passenger vehicles segment captured the largest revenue share of over 56.5% in 2022. The growing number of passenger vehicles on the road is leading to a higher demand for automotive batteries, as these vehicles require periodic battery replacements due to wear and tear.
Table of Contents
Chapter 1. Methodology and Scope
- 1.1. Market Segmentation & Scope
- 1.1.1. Battery type
- 1.1.2. Vehicle type
- 1.1.3. Distribution channel
- 1.1.4. Estimates and forecast timeline
- 1.2. Research Methodology
- 1.3. Information Procurement
- 1.3.1. Purchased database
- 1.3.2. GVR's internal database
- 1.3.3. Secondary sources
- 1.3.4. Primary research
- 1.3.5. Details of primary research
- 1.4. Information or Data Analysis
- 1.5. Market Formulation & Validation
- 1.6. Model Details
- 1.7. List of Secondary Sources
- 1.8. List of Primary Sources
- 1.9. Objectives
Chapter 2. Executive Summary
- 2.1. Market Outlook
- 2.2. Segment Outlook
- 2.2.1. Battery type outlook
- 2.2.2. Vehicle type outlook
- 2.2.3. Distribution channel outlook
- 2.3. Competitive Insights
Chapter 3. U.S. Automotive Battery Aftermarket Variables, Trends & Scope
- 3.1. Market Lineage Outlook
- 3.2. Industry Value Chain Analysis
- 3.3. Market Dynamics
- 3.3.1. Market driver analysis
- 3.3.2. Market restraint analysis
- 3.3.3. Market opportunity analysis
- 3.4. U.S. Automotive Battery Aftermarket Analysis Tools
- 3.4.1. Industry analysis - Porter's
- 3.4.1.1. Supplier power
- 3.4.1.2. Buyer power
- 3.4.1.3. Substitution threat
- 3.4.1.4. Threat of new entrant
- 3.4.1.5. Competitive rivalry
- 3.4.2. PESTEL analysis
- 3.4.2.1. Political landscape
- 3.4.2.2. Technological landscape
- 3.4.2.3. Economic landscape
- 3.4.1. Industry analysis - Porter's
Chapter 4. U.S. Automotive Battery Aftermarket : Battery Type Estimates & Trend Analysis
- 4.1. U.S. Automotive Battery Aftermarket: Key Takeaways
- 4.2. U.S. Automotive Battery Aftermarket: Movement & Market Share Analysis, 2022 & 2030
- 4.3. Lithium-ion
- 4.3.1. Lithium-ion market estimates and forecasts, 2017 to 2030 (USD Billion and Million Units)
- 4.4. Lead Acid
- 4.4.1. Lead Acid market estimates and forecasts, 2017 to 2030 (USD Billion and Million Units)
- 4.5. Nickel-based
- 4.5.1. Nickel-based market estimates and forecasts, 2017 to 2030 (USD Billion and Million Units)
- 4.6. Sodium-ion
- 4.6.1. Sodium-ion market estimates and forecasts, 2017 to 2030 (USD Billion and Million Units)
- 4.7. Others
- 4.7.1. Others market estimates and forecasts, 2017 to 2030 (USD Billion and Million Units)
Chapter 5. U.S. Automotive Battery Aftermarket : Vehicle Type Estimates & Trend Analysis
- 5.1. U.S. Automotive Battery Aftermarket: Key Takeaways
- 5.2. U.S. Automotive Battery Aftermarket: Movement & Market Share Analysis, 2022 & 2030
- 5.3. Passenger vehicle
- 5.3.1. Passenger vehicle market estimates and forecasts, 2017 to 2030 (USD Billion and Million Units)
- 5.4. Electric Vehicle
- 5.4.1. Electric vehicle market estimates and forecasts, 2017 to 2030 (USD Billion and Million Units)
- 5.5. Commercial Vehicle
- 5.5.1. Commercial vehicle market estimates and forecasts, 2017 to 2030 (USD Billion and Million Units)
- 5.6. Others
- 5.6.1. Others market estimates and forecasts, 2017 to 2030 (USD Billion and Million Units)
Chapter 6. U.S. Automotive Battery Aftermarket : Distribution Channel Estimates & Trend Analysis
- 6.1. U.S. Automotive Battery Aftermarket: Key Takeaways
- 6.2. U.S. Automotive Battery Aftermarket: Movement & Market Share Analysis, 2022 & 2030
- 6.3. Retail/Brick
- 6.3.1. Retail/brick market estimates and forecasts, 2017 to 2030 (USD Billion and Million Units)
- 6.4. E-commerce
- 6.4.1. E-commerce market estimates and forecasts, 2017 to 2030 (USD Billion and Million Units)
- 6.5. Others
- 6.5.1. Others market estimates and forecasts, 2017 to 2030 (USD Billion and Million Units)
Chapter 7. Competitive Landscape
- 7.1. Recent Developments & Impact Analysis, By Key Market Participants
- 7.2. Market Participant Categorization
- 7.2.1. A123 Systems, LLC
- 7.2.1.1. Company overview
- 7.2.1.2. Financial performance
- 7.2.1.3. Product benchmarking
- 7.2.1.4. Strategic initiatives
- 7.2.2. East Penn Manufacturing Company
- 7.2.2.1. Company overview
- 7.2.2.2. Product benchmarking
- 7.2.2.3. Strategic initiatives
- 7.2.3. EnerSys
- 7.2.3.1. Company overview
- 7.2.3.2. Financial performance
- 7.2.3.3. Product benchmarking
- 7.2.3.4. Strategic initiatives
- 7.2.4. Aptiv
- 7.2.4.1. Company overview
- 7.2.4.2. Financial performance
- 7.2.4.3. Product benchmarking
- 7.2.4.4. Strategic initiatives
- 7.2.5. Exide Technologies
- 7.2.5.1. Company overview
- 7.2.5.2. Financial performance
- 7.2.5.3. Product benchmarking
- 7.2.5.4. Strategic initiatives
- 7.2.6. Johnson Controls
- 7.2.6.1. Company overview
- 7.2.6.2. Financial performance
- 7.2.6.3. Product benchmarking
- 7.2.6.4. Strategic initiatives
- 7.2.7. NEC Corporation
- 7.2.7.1. Company overview
- 7.2.7.2. Financial performance
- 7.2.7.3. Product benchmarking
- 7.2.7.4. Strategic initiatives
- 7.2.8. Samsung SDI Co., Ltd
- 7.2.8.1. Company overview
- 7.2.8.2. Financial performance
- 7.2.8.3. Product benchmarking
- 7.2.8.4. Strategic initiatives
- 7.2.9. Tesla
- 7.2.9.1. Company overview
- 7.2.9.2. Financial performance
- 7.2.9.3. Product benchmarking
- 7.2.9.4. Strategic initiatives
- 7.2.10. Interstate Batteries
- 7.2.10.1. Company overview
- 7.2.10.2. Financial performance
- 7.2.10.3. Product benchmarking
- 7.2.10.4. Strategic initiatives
- 7.2.1. A123 Systems, LLC


