|
|
市場調査レポート
商品コード
1376178
バニリンの市場規模、シェア、動向分析レポート:製品別、用途別、地域別、セグメント予測、2023年~2030年Vanillin Market Size, Share & Trends Analysis Report By Product (Synthetic, Bio-based), By Application (Food & Beverage, Fragrance, Pharmaceutical), By Region And Segment Forecasts, 2023 - 2030 |
||||||
カスタマイズ可能
|
|||||||


| バニリンの市場規模、シェア、動向分析レポート:製品別、用途別、地域別、セグメント予測、2023年~2030年 |
|
出版日: 2023年10月20日
発行: Grand View Research
ページ情報: 英文 90 Pages
納期: 2~10営業日
|

- 全表示
- 概要
- 図表
- 目次
バニリン市場の成長と動向
Grand View Research, Inc.の最新レポートによると、世界のバニリン市場規模は2023年から2030年にかけてCAGR 7.5%で推移し、2030年には11億1,930万米ドルに達する見込みです。
食品・飲料の消費増加は、世界的に市場成長を促進する重要な要因となっています。また、食品・飲料、フレグランス、化粧品、医薬品など様々な最終用途産業における堅調な成長も需要を後押ししています。
バニリンは、様々な最終用途製品の香りと風味を高めるために広く使用されている必須芳香族化合物です。バニラビーンズは心地よい香りを構成し、それはバニラビーンズで自然に発生します。バニリンは、食品の香料や、お香、香水、医薬品、キャンドル、芳香剤などの芳香添加剤として広く使用されています。バニリンには食品の風味を向上させる作用があり、低カロリーで酸化防止剤も多く含まれているため、予測期間中に食品・飲料分野からの需要が増加すると予想されます。
食品・飲料は2016年に最大の最終用途セグメントを占め、今後数年間で大きく成長すると予測されています。様々な食品への需要の高まりは、持続可能な供給源からバニリン製品を製造することをメーカーに促しています。
フレグランス分野は、世界市場で大きな成長が見込まれています。美容・パーソナルケア製品への消費支出の増加と、様々なフレグランスアプリケーション製品における芳香製品の使用量の増加が、予測期間中のバニリン市場の成長を促進すると予想されます。さらに、インド、中国、米国、ブラジルなどの新興経済国でのフレグランス製品の使用量の増加が需要をさらに増加させると予想されます。
バニリン市場レポートハイライト
- バイオベース分野は2022年に63.6%の最大収益シェアを占めます。合成保存料や人工添加物を使用しない、健康的で天然成分の機能性食品に対する意識の高まりが、バイオベース製品の需要を後押しする主な要因となっています。
- 医薬品セグメントは、2022年に48.1%の最大の収益シェアを占めました。同分野は予測期間中、CAGR 7.6%と最速の成長が見込まれています。バニリンは中間化学品として、また医薬品分野では添加剤として数多くの用途があります。
- アジア太平洋地域が市場を独占し、2022年には41.2%の最大の収益シェアを占めました。同地域は、様々な最終用途産業からの需要増加により、予測期間中にCAGR 8.2%の最速成長が見込まれています。
目次
第1章 調査手法と範囲
第2章 エグゼクティブサマリー
第3章 バニリン市場の変数、動向、範囲
- 市場系統の見通し
- 普及と成長の見通しマッピング
- バリューチェーン分析
- 規制の枠組み
- 市場力学
- 市場促進要因分析
- 市場抑制要因分析
- 業界の機会と課題
- バニリン市場分析ツール
- 業界分析- ポーターのファイブフォース分析
- PESTEL分析
第4章 サプライヤーのポートフォリオ分析
- サプライヤー一覧
- Kraljic Matrix
- 調達のベストプラクティス
- 交渉戦略
第5章 バニリン:製品の推定・動向分析
- バニリン市場:重要なポイント
- バニリン市場:動向と市場シェア分析、2022年と2030年
- 合成
- バイオベース
第6章 バニリン:用途の推定・動向分析
- バニリン市場:重要なポイント
- バニリン市場:動向と市場シェア分析、2022年と2030年
- 食品・飲料
- フレグランス
- 医薬品
第7章 バニリン市場:地域の推定・動向分析
- 地域の見通し
- 地域別バニリン市場:重要なポイント
- 北米
- 市場推計・予測、2018~2030年
- 米国
- カナダ
- メキシコ
- 欧州
- 英国
- ドイツ
- フランス
- イタリア
- スペイン
- アジア太平洋地域
- 日本
- 中国
- インド
- 韓国
- ラテンアメリカ
- ブラジル
- アルゼンチン
- 中東・アフリカ
- サウジアラビア
- 南アフリカ
第8章 競合情勢
- 主要市場参入企業による最近の動向と影響分析
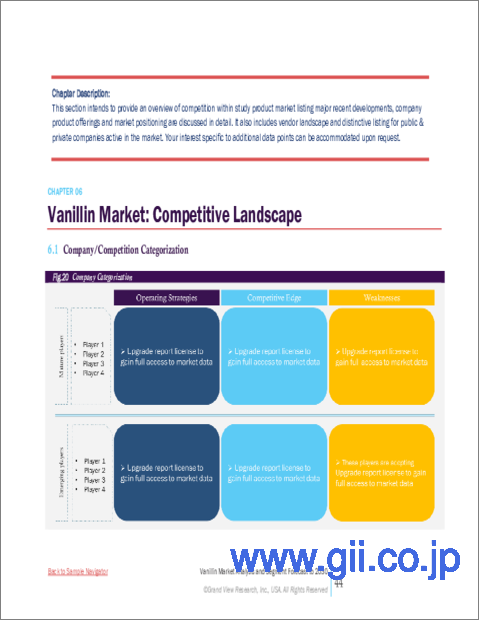
- 市場参入企業の分類
- Apple Flavor & Fragrance Group Co Ltd.
- Camlin Fine Sciences Ltd.
- De Monchy Aromatics
- International Flavors & Fragrances
- Ennloys
- Evolva Holding
- Advanced Biotech
- Omega Ingredients Ltd.
- Comax Flavors
List of Tables
- Table 1 List of abbreviation
- Table 2 North America vanillin market, by product, 2018 - 2030 (USD Million)
- Table 3 North America vanillin market, by application, 2018 - 2030 (USD Million)
- Table 4 North America vanillin market, by region, 2018 - 2030 (USD Million)
- Table 5 U.S. vanillin market, by product, 2018 - 2030 (USD Million)
- Table 6 Vanillin market, by application, 2018 - 2030 (USD Million)
- Table 7 Canada vanillin market, by product, 2018 - 2030 (USD Million)
- Table 8 Canada vanillin market, by application, 2018 - 2030 (USD Million)
- Table 9 Mexico vanillin market, by product, 2018 - 2030 (USD Million)
- Table 10 Mexico vanillin market, by application, 2018 - 2030 (USD Million)
- Table 11 Europe vanillin market, by product, 2018 - 2030 (USD Million)
- Table 12 Europe vanillin market, by application, 2018 - 2030 (USD Million)
- Table 13 Europe vanillin market, by region, 2018 - 2030 (USD Million)
- Table 14 Germany vanillin market, by product, 2018 - 2030 (USD Million)
- Table 15 Germany vanillin market, by application, 2018 - 2030 (USD Million)
- Table 16 UK vanillin market, by product, 2018 - 2030 (USD Million)
- Table 17 UK vanillin market, by application, 2018 - 2030 (USD Million)
- Table 18 France vanillin market, by product, 2018 - 2030 (USD Million)
- Table 19 France vanillin market, by application, 2018 - 2030 (USD Million)
- Table 20 Italy vanillin market, by product, 2018 - 2030 (USD Million)
- Table 21 Italy vanillin market, by application, 2018 - 2030 (USD Million)
- Table 22 Spain vanillin market, by product, 2018 - 2030 (USD Million)
- Table 23 Spain vanillin market, by application, 2018 - 2030 (USD Million)
- Table 24 Asia Pacific vanillin market, by product, 2018 - 2030 (USD Million)
- Table 25 Asia Pacific vanillin market, by application, 2018 - 2030 (USD Million)
- Table 26 Asia Pacific vanillin market, by region, 2018 - 2030 (USD Million)
- Table 27 China vanillin market, by product, 2018 - 2030 (USD Million)
- Table 28 China vanillin market, by application, 2018 - 2030 (USD Million)
- Table 29 Japan vanillin market, by product, 2018 - 2030 (USD Million)
- Table 30 Japan vanillin market, by application, 2018 - 2030 (USD Million)
- Table 31 India vanillin market, by product, 2018 - 2030 (USD Million)
- Table 32 India vanillin market, by application, 2018 - 2030 (USD Million)
- Table 33 South Korea vanillin market, by product, 2018 - 2030 (USD Million)
- Table 34 South Korea vanillin market, by application, 2018 - 2030 (USD Million)
- Table 35 Latin America vanillin market, by product, 2018 - 2030 (USD Million)
- Table 36 Latin America vanillin market, by application, 2018 - 2030 (USD Million)
- Table 37 Latin America vanillin market, by region, 2018 - 2030 (USD Million)
- Table 38 Brazil vanillin market, by product, 2018 - 2030 (USD Million)
- Table 39 Brazil vanillin market, by application, 2018 - 2030 (USD Million)
- Table 40 Argentina vanillin market, by product, 2018 - 2030 (USD Million)
- Table 41 Argentina vanillin market, by application, 2018 - 2030 (USD Million)
- Table 42 Middle East and Africa vanillin market, by product, 2018 - 2030 (USD Million)
- Table 43 Middle East and Africa vanillin market, by application, 2018 - 2030 (USD Million)
- Table 44 Middle East and Africa vanillin market, by region, 2018 - 2030 (USD Million)
- Table 45 South Africa vanillin market, by product, 2018 - 2030 (USD Million)
- Table 46 South Africa vanillin market, by application, 2018 - 2030 (USD Million)
- Table 47 Saudi Arabia vanillin market, by product, 2018 - 2030 (USD Million)
- Table 48 Saudi Arabia vanillin market, by application, 2018 - 2030 (USD Million)
List of Figures
- Fig. 1 Market research process
- Fig. 2 Data triangulation techniques
- Fig. 3 Primary research pattern
- Fig. 4 Market research approaches
- Fig. 5 Value-chain-based sizing & forecasting
- Fig. 6 QFD modeling for market share assessment
- Fig. 7 Market formulation & validation
- Fig. 8 Vanillin: Market outlook
- Fig. 9 Vanillin: Competitive insights
- Fig. 10 Parent market outlook
- Fig. 11 Related/ancillary market outlook
- Fig. 12 Penetration and growth prospect mapping
- Fig. 13 Industry value chain analysis
- Fig. 14 Vanillin market driver impact
- Fig. 15 Vanillin market restraint impact
- Fig. 16 Vanillin market strategic initiatives analysis
- Fig. 17 Vanillin market: Product movement analysis
- Fig. 18 Vanillin market: Product outlook and key takeaways
- Fig. 19 Synthetic market estimates and forecasts, 2018 - 2030
- Fig. 20 Vanillin market: Application movement analysis
- Fig. 21 Vanillin market: Application outlook and key takeaways
- Fig. 22 Food & beverages market estimates and forecasts, 2018 - 2030
- Fig. 23 Fragrances market estimates and forecasts, 2018 - 2030
- Fig. 24 Pharmaceuticals market estimates and forecasts, 2018 - 2030
- Fig. 25 Global vanillin market: Regional movement analysis
- Fig. 26 Global vanillin market: Regional outlook and key takeaways
- Fig. 27 North America market estimates and forecasts, 2018 - 2030
- Fig. 28 U.S. market estimates and forecasts, 2018 - 2030
- Fig. 29 Canada market estimates and forecasts, 2018 - 2030
- Fig. 30 Mexico market estimates and forecasts, 2018 - 2030
- Fig. 31 Europe. market estimates and forecasts, 2018 - 2030
- Fig. 32 U.K. market estimates and forecasts, 2018 - 2030
- Fig. 33 Germany market estimates and forecasts, 2018 - 2030
- Fig. 34 France market estimates and forecasts, 2018 - 2030
- Fig. 35 Italy market estimates and forecasts, 2018 - 2030
- Fig. 36 Spain market estimates and forecasts, 2018 - 2030
- Fig. 37 Asia Pacific market estimates and forecasts, 2018 - 2030
- Fig. 38 Japan market estimates and forecasts, 2018 - 2030
- Fig. 39 China market estimates and forecasts, 2018 - 2030
- Fig. 40 India market estimates and forecasts, 2018 - 2030
- Fig. 41 South Korea market estimates and forecasts, 2018 - 2030
- Fig. 42 Latin America market estimates and forecasts, 2018 - 2030
- Fig. 43 Brazil market estimates and forecasts, 2018 - 2030
- Fig. 44 Argentina market estimates and forecasts, 2018 - 2030
- Fig. 45 Middle East and Africa. market estimates and forecasts, 2018 - 2030
- Fig. 46 Saudi Arabia market estimates and forecasts, 2018 - 2030
- Fig. 47 South Africa market estimates and forecasts, 2018 - 2030
Vanillin Market Growth & Trends:
The global vanillin market size is expected to reach USD 1119.3 million by 2030, registering at a CAGR of 7.5% from 2023 to 2030, according to a new report by Grand View Research, Inc.. Increasing consumption of food & beverage products has been a key factor driving market growth, globally. In addition, robust growth in various end-use industries such as food & beverage, fragrance, cosmetics, and pharmaceuticals is also fueling the demand.
Vanillin is an essential aromatic compound extensively used to enhance the aroma and flavor of the different end-use products. Vanilla beans constitute pleasant smell, that occurs naturally in vanilla beans. It is widely used as a flavoring agent in food products and aromatic additives for incense, perfumes, medicines, candles, and air fresheners. Due to the ability to enhance flavor in food products coupled with low-calorie content and high availability of antioxidants in vanillin, its demand from the food & beverage segment is anticipated to increase over the forecast period.
Food & beverage accounted as the largest end-use segment in 2016 and is anticipated to grow significantly over the upcoming years. Growing demand for various food products is encouraging manufacturers to produce vanillin products from a sustainable source.
The fragrance segment is expected to witness the significant growth in the global market. Increasing consumer spending on beauty and personal care products along with growing usage of aromatic products in various fragrance application products are anticipated to fuel the growth of the vanillin market over the forecast period. In addition, increasing usage of fragrance products in emerging economies such as India, China, the U.S., and Brazil is expected to increase the demand further.
Vanillin Market Report Highlights:
- The bio-based segment accounted for the largest revenue share of 63.6% in 2022. Rising awareness regarding healthy and natural ingredient functional foods without synthetic preservatives and artificial additives is a key factor likely to encourage the demand for bio-based products.
- The pharmaceutical segment accounted for the largest revenue share of 48.1% in 2022. The segment is expected to grow at the fastest CAGR of 7.6% over the forecast period. There are numerous applications of vanillin as an intermediate chemical as well as an additive in the pharmaceutical sector.
- Asia Pacific dominated the market and accounted for the largest revenue share of 41.2% in 2022. The region is expected to grow at the fastest CAGR of 8.2% during the forecast period owing to the rising demand from the various end-use industries
Table of Contents
Chapter 1. Methodology and Scope
- 1.1. Market Segmentation & Scope
- 1.1.1. Product
- 1.1.2. Application
- 1.1.3. Regional scope
- 1.1.4. Estimates and forecast timeline
- 1.2. Research Methodology
- 1.3. Information Procurement
- 1.3.1. Purchased database
- 1.3.2. GVR's internal database
- 1.3.3. Secondary sources
- 1.3.4. Primary research
- 1.3.5. Details of primary research
- 1.4. Information or Data Analysis
- 1.5. Market Formulation & Validation
- 1.6. Model Details
- 1.7. List of Secondary Sources
- 1.8. List of Primary Sources
- 1.9. Objectives
Chapter 2. Executive Summary
- 2.1. Market Outlook
- 2.2. Segment Outlook
- 2.2.1. Product outlook
- 2.2.2. Application outlook
- 2.2.3. Regional outlook
- 2.3. Competitive Insights
Chapter 3. Vanillin Market Variables, Trends & Scope
- 3.1. Market Lineage Outlook
- 3.2. Penetration & Growth Prospect Mapping
- 3.3. Value Chain Analysis
- 3.4. Regulatory Framework
- 3.5. Market Dynamics
- 3.5.1. Market driver analysis
- 3.5.2. Market restraint analysis
- 3.5.3. Industry opportunities & challenges
- 3.6. Vanillin Market Analysis Tools
- 3.6.1. Industry analysis - Porter's
- 3.6.1.1. Supplier power
- 3.6.1.2. Buyer power
- 3.6.1.3. Substitution threat
- 3.6.1.4. Threat of new entrant
- 3.6.1.5. Competitive rivalry
- 3.6.2. PESTEL analysis
- 3.6.2.1. Political landscape
- 3.6.2.2. Technological landscape
- 3.6.2.3. Economic landscape
- 3.6.2.4. Social landscape
- 3.6.2.5. Environmental landscape
- 3.6.2.6. Legal landscape
- 3.6.1. Industry analysis - Porter's
Chapter 4. Supplier Portfolio Analysis
- 4.1. List of Suppliers
- 4.2. Kraljic Matrix
- 4.3. Sourcing Best Practices
- 4.4. Negotiation Strategies
Chapter 5. Vanillin : Product Estimates & Trend Analysis
- 5.1. Vanillin Market: Key Takeaways
- 5.2. Vanillin Market: Movement & Market Share Analysis, 2022 & 2030
- 5.3. Synthetic
- 5.3.1. Synthetic market estimates and forecasts, 2018 to 2030 (USD Million, Tons
- 5.4. Bio-based
- 5.4.1. Bio-based market estimates and forecasts, 2018 to 2030 (USD Million, Tons)
Chapter 6. Vanillin : Application Estimates & Trend Analysis
- 6.1. Vanillin Market: Key Takeaways
- 6.2. Vanillin Market: Movement & Market Share Analysis, 2022 & 2030
- 6.3. Food & Beverages
- 6.3.1. Food & Beverages market estimates and forecasts, 2018 to 2030 (USD Million, Tons)
- 6.4. Fragrances
- 6.4.1. Fragrances market estimates and forecasts, 2018 to 2030 (USD Million, Tons)
- 6.5. Pharmaceuticals
- 6.5.1. Pharmaceuticals market estimates and forecasts, 2018 to 2030 (USD Million, Tons)
Chapter 7. Vanillin Market: Regional Estimates & Trend Analysis
- 7.1. Regional Outlook
- 7.2. Vanillin Market by Region: Key Takeaway
- 7.3. North America
- 7.3.1. Market estimates and forecasts, 2018 - 2030 (Revenue, USD Million, Tons)
- 7.3.2. U.S.
- 7.3.2.1. Market estimates and forecasts, 2018 - 2030 (Revenue, USD Million, Tons)
- 7.3.3. Canada
- 7.3.3.1. Market estimates and forecasts, 2018 - 2030 (Revenue, USD Million, Tons)
- 7.3.4. Mexico
- 7.3.4.1. Market estimates and forecasts, 2018 - 2030 (Revenue, USD Million, Tons)
- 7.4. Europe
- 7.4.1. UK
- 7.4.1.1. Market estimates and forecasts, 2018 - 2030 (Revenue, USD Million, Tons)
- 7.4.2. Germany
- 7.4.2.1. Market estimates and forecasts, 2018 - 2030 (Revenue, USD Million, Tons)
- 7.4.3. France
- 7.4.3.1. Market estimates and forecasts, 2018 - 2030 (Revenue, USD Million, Tons)
- 7.4.4. Italy
- 7.4.4.1. Market estimates and forecasts, 2018 - 2030 (Revenue, USD Million, Tons)
- 7.4.5. Spain
- 7.4.5.1. Market estimates and forecasts, 2018 - 2030 (Revenue, USD Million, Tons)
- 7.4.1. UK
- 7.5. Asia Pacific
- 7.5.1. Japan
- 7.5.1.1. Market estimates and forecasts, 2018 - 2030 (Revenue, USD Million, Tons)
- 7.5.2. China
- 7.5.2.1. Market estimates and forecasts, 2018 - 2030 (Revenue, USD Million, Tons)
- 7.5.3. India
- 7.5.3.1. Market estimates and forecasts, 2018 - 2030 (Revenue, USD Million, Tons)
- 7.5.4. South Korea
- 7.5.4.1. Market estimates and forecasts, 2018 - 2030 (Revenue, USD Million, Tons)
- 7.5.1. Japan
- 7.6. Latin America
- 7.6.1. Brazil
- 7.6.1.1. Market estimates and forecasts, 2018 - 2030 (Revenue, USD Million, Tons)
- 7.6.2. Argentina
- 7.6.2.1. Market estimates and forecasts, 2018 - 2030 (Revenue, USD Million, Tons)
- 7.6.1. Brazil
- 7.7. MEA
- 7.7.1. Saudi Arabia
- 7.7.1.1. Market estimates and forecasts, 2018 - 2030 (Revenue, USD Million, Tons)
- 7.7.2. South Africa
- 7.7.2.1. Market estimates and forecasts, 2018 - 2030 (Revenue, USD Million, Tons)
- 7.7.1. Saudi Arabia
Chapter 8. Competitive Landscape
- 8.1. Recent Developments & Impact Analysis, By Key Market Participants
- 8.2. Market Participant Categorization
- 8.2.1. Apple Flavor & Fragrance Group Co Ltd.
- 8.2.1.1. Company overview
- 8.2.1.2. Financial performance
- 8.2.1.3. Product benchmarking
- 8.2.1.4. Strategic initiatives
- 8.2.2. Camlin Fine Sciences Ltd.
- 8.2.2.1. Company overview
- 8.2.2.2. Financial performance
- 8.2.2.3. Product benchmarking
- 8.2.2.4. Strategic initiatives
- 8.2.3. De Monchy Aromatics
- 8.2.3.1. Company overview
- 8.2.3.2. Financial performance
- 8.2.3.3. Product benchmarking
- 8.2.3.4. Strategic initiatives
- 8.2.4. International Flavors & Fragrances
- 8.2.4.1. Company overview
- 8.2.4.2. Financial performance
- 8.2.4.3. Product benchmarking
- 8.2.4.4. Strategic initiatives
- 8.2.5. Ennloys
- 8.2.5.1. Company overview
- 8.2.5.2. Financial performance
- 8.2.5.3. Product benchmarking
- 8.2.5.4. Strategic initiatives
- 8.2.6. Evolva Holding
- 8.2.6.1. Company overview
- 8.2.6.2. Financial performance
- 8.2.6.3. Product benchmarking
- 8.2.6.4. Strategic initiatives
- 8.2.7. Advanced Biotech
- 8.2.7.1. Company overview
- 8.2.7.2. Financial performance
- 8.2.7.3. Product benchmarking
- 8.2.7.4. Strategic initiatives
- 8.2.8. Omega Ingredients Ltd.
- 8.2.8.1. Company overview
- 8.2.8.2. Financial performance
- 8.2.8.3. Product benchmarking
- 8.2.8.4. Strategic initiatives
- 8.2.9. Comax Flavors
- 8.2.9.1. Company overview
- 8.2.9.2. Financial performance
- 8.2.9.3. Product benchmarking
- 8.2.9.4. Strategic initiatives
- 8.2.1. Apple Flavor & Fragrance Group Co Ltd.
