|
|
市場調査レポート
商品コード
1490695
バニリンの世界市場:2024~2028年Global Vanillin market 2024-2028 |
||||||
|
|||||||
カスタマイズ可能
|
|||||||

| バニリンの世界市場:2024~2028年 |
|
出版日: 2024年05月13日
発行: TechNavio
ページ情報: 英文 171 Pages
納期: 即納可能
|

全表示
- 概要
- 図表
- 目次
世界のバニリンの市場規模は、2023~2028年にかけて5億1,010万米ドル成長し、予測期間中のCAGRは11.87%になると予測されています。
当レポートでは、バニリン市場の全体的な分析、市場規模・予測、動向、成長促進要因、課題、約25のベンダーを網羅したベンダー分析などを掲載しています。
現在の市場シナリオ、最新動向と促進要因、市場環境全体に関する最新分析を提供しています。市場は、可処分所得の増加、菓子類の需要の急増、エチルバニリンの人気の高まりによって牽引されています。
| 市場範囲 | |
|---|---|
| 基準年 | 2024年 |
| 終了年 | 2028年 |
| 予測期間 | 2024~2028年 |
| 成長モメンタム | 加速 |
| 前年比2024年 | 10.29% |
| CAGR | 11.87% |
| 増分額 | 5億1,010万米ドル |
本調査では、今後数年間のバニリン市場の成長を牽引する主な要因の一つとして、触媒を使用した環境に優しい製造プロセスの出現を挙げています。また、バニリンが乾癬の治療薬として使用されるようになり、可処分所得が増加していることも、市場の大きな需要につながります。
目次
第1章 エグゼクティブサマリー
- 市場概要
第2章 市場情勢
- 市場エコシステム
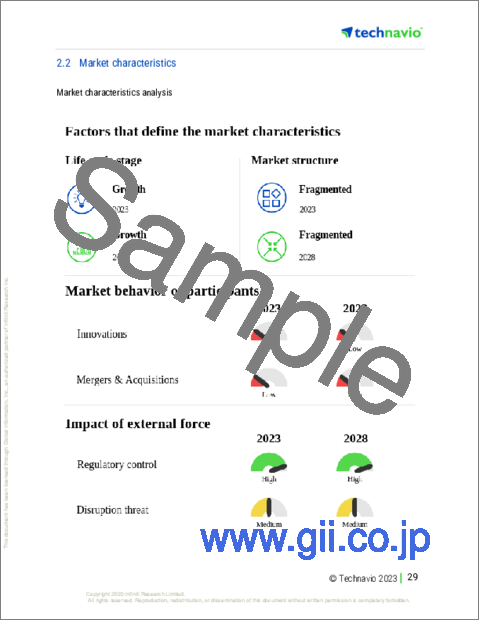
- 市場の特徴
- バリューチェーン分析
第3章 市場規模の評価
- 市場の定義
- 市場セグメント分析
- 市場規模、2023年
- 市場の展望、2023~2028年
第4章 市場規模実績
- 世界のバニリン市場、2018~2022年
- エンドユーザー別セグメント分析、2018~2022年
- タイプ別セグメント分析、2018~2022年
- 地域別セグメント分析、2018~2022年
- 国別セグメント分析、2018~2022年
第5章 ファイブフォース分析
- ファイブフォースの要約
- 買い手の交渉力
- 供給企業の交渉力
- 新規参入業者の脅威
- 代替品の脅威
- 競争の脅威
- 市況
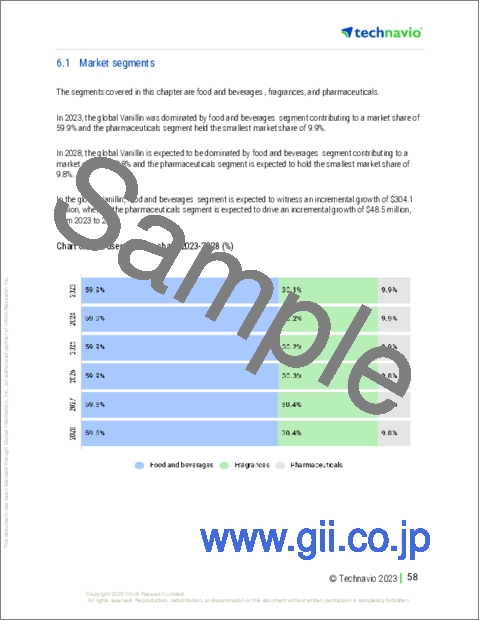
第6章 市場セグメンテーション:エンドユーザー別
- 市場セグメンテーション
- 比較:エンドユーザー別
- 食品・飲料:市場規模・予測、2023~2028年
- フレグランス:市場規模・予測、2023~2028年
- 医薬品:市場規模・予測、2023~2028年
- 市場機会:エンドユーザー別
第7章 市場セグメンテーション:タイプ別
- 市場セグメンテーション
- 比較:タイプ別
- 天然バニリン:市場規模・予測、2023~2028年
- 合成バニリン:市場規模・予測、2023~2028年
- 市場機会:タイプ別
第8章 顧客情勢
- 顧客情勢の概要
第9章 地域別情勢
- 地域別セグメンテーション
- 地域別比較
- アジア太平洋:市場規模・予測、2023~2028年
- 欧州:市場規模・予測、2023~2028年
- 北米:市場規模・予測、2023~2028年
- 中東・アフリカ:市場規模・予測、2023~2028年
- 南米:市場規模・予測、2023~2028年
- 中国:市場規模・予測、2023~2028年
- 米国:市場規模・予測、2023~2028年
- ドイツ:市場規模・予測、2023~2028年
- フランス:市場規模・予測、2023~2028年
- カナダ:市場規模・予測、2023~2028年
- 市場機会:地域情勢別
第10章 促進要因・課題・機会・抑制要因
- 市場促進要因
- 市場課題
- 促進要因と課題の影響
- 市場機会・抑制要因
第11章 競合情勢
- 概要
- 競合情勢
- 混乱の状況
- 業界のリスク
第12章 競合分析
- 企業プロファイル
- 企業の市場ポジショニング
- Advanced Biotech
- Apple Flavor and Fragrance Group Co. Ltd.
- Aurochemicals
- Axxence Aromatic GmbH
- BASF SE
- Borregaard ASA
- BRENNTAG SE
- Camlin Fine Sciences Ltd.
- De Monchy Aromatics Ltd.
- Evolva Holding AG
- Jiaxing Zhonghua Chemical Co. Ltd.
- Lesaffre and Cie
- Merck KGaA
- Solvay SA
- TANOBIO
第13章 付録
Exhibits:
- Exhibits1: Executive Summary - Chart on Market Overview
- Exhibits2: Executive Summary - Data Table on Market Overview
- Exhibits3: Executive Summary - Chart on Global Market Characteristics
- Exhibits4: Executive Summary - Chart on Market By Geographical Landscape
- Exhibits5: Executive Summary - Chart on Market Segmentation by End-user
- Exhibits6: Executive Summary - Chart on Market Segmentation by Type
- Exhibits7: Executive Summary - Chart on Incremental Growth
- Exhibits8: Executive Summary - Data Table on Incremental Growth
- Exhibits9: Executive Summary - Chart on Company Market Positioning
- Exhibits10: Parent Market
- Exhibits11: Data Table on - Parent Market
- Exhibits12: Market characteristics analysis
- Exhibits13: Value Chain Analysis
- Exhibits14: Offerings of companies included in the market definition
- Exhibits15: Market segments
- Exhibits16: Chart on Global - Market size and forecast 2023-2028 ($ million)
- Exhibits17: Data Table on Global - Market size and forecast 2023-2028 ($ million)
- Exhibits18: Chart on Global Market: Year-over-year growth 2023-2028 (%)
- Exhibits19: Data Table on Global Market: Year-over-year growth 2023-2028 (%)
- Exhibits20: Historic Market Size - Data Table on Global Vanillin 2018 - 2022 ($ million)
- Exhibits21: Historic Market Size - End-user Segment 2018 - 2022 ($ million)
- Exhibits22: Historic Market Size - Type Segment 2018 - 2022 ($ million)
- Exhibits23: Historic Market Size - Geography Segment 2018 - 2022 ($ million)
- Exhibits24: Historic Market Size - Country Segment 2018 - 2022 ($ million)
- Exhibits25: Five forces analysis - Comparison between 2023 and 2028
- Exhibits26: Bargaining power of buyers - Impact of key factors 2023 and 2028
- Exhibits27: Bargaining power of suppliers - Impact of key factors in 2023 and 2028
- Exhibits28: Threat of new entrants - Impact of key factors in 2023 and 2028
- Exhibits29: Threat of substitutes - Impact of key factors in 2023 and 2028
- Exhibits30: Threat of rivalry - Impact of key factors in 2023 and 2028
- Exhibits31: Chart on Market condition - Five forces 2023 and 2028
- Exhibits32: Chart on End-user - Market share 2023-2028 (%)
- Exhibits33: Data Table on End-user - Market share 2023-2028 (%)
- Exhibits34: Chart on Comparison by End-user
- Exhibits35: Data Table on Comparison by End-user
- Exhibits36: Chart on Food and beverages - Market size and forecast 2023-2028 ($ million)
- Exhibits37: Data Table on Food and beverages - Market size and forecast 2023-2028 ($ million)
- Exhibits38: Chart on Food and beverages - Year-over-year growth 2023-2028 (%)
- Exhibits39: Data Table on Food and beverages - Year-over-year growth 2023-2028 (%)
- Exhibits40: Chart on Fragrances - Market size and forecast 2023-2028 ($ million)
- Exhibits41: Data Table on Fragrances - Market size and forecast 2023-2028 ($ million)
- Exhibits42: Chart on Fragrances - Year-over-year growth 2023-2028 (%)
- Exhibits43: Data Table on Fragrances - Year-over-year growth 2023-2028 (%)
- Exhibits44: Chart on Pharmaceuticals - Market size and forecast 2023-2028 ($ million)
- Exhibits45: Data Table on Pharmaceuticals - Market size and forecast 2023-2028 ($ million)
- Exhibits46: Chart on Pharmaceuticals - Year-over-year growth 2023-2028 (%)
- Exhibits47: Data Table on Pharmaceuticals - Year-over-year growth 2023-2028 (%)
- Exhibits48: Market opportunity by End-user ($ million)
- Exhibits49: Data Table on Market opportunity by End-user ($ million)
- Exhibits50: Chart on Type - Market share 2023-2028 (%)
- Exhibits51: Data Table on Type - Market share 2023-2028 (%)
- Exhibits52: Chart on Comparison by Type
- Exhibits53: Data Table on Comparison by Type
- Exhibits54: Chart on Natural vanillin - Market size and forecast 2023-2028 ($ million)
- Exhibits55: Data Table on Natural vanillin - Market size and forecast 2023-2028 ($ million)
- Exhibits56: Chart on Natural vanillin - Year-over-year growth 2023-2028 (%)
- Exhibits57: Data Table on Natural vanillin - Year-over-year growth 2023-2028 (%)
- Exhibits58: Chart on Synthetic vanillin - Market size and forecast 2023-2028 ($ million)
- Exhibits59: Data Table on Synthetic vanillin - Market size and forecast 2023-2028 ($ million)
- Exhibits60: Chart on Synthetic vanillin - Year-over-year growth 2023-2028 (%)
- Exhibits61: Data Table on Synthetic vanillin - Year-over-year growth 2023-2028 (%)
- Exhibits62: Market opportunity by Type ($ million)
- Exhibits63: Data Table on Market opportunity by Type ($ million)
- Exhibits64: Analysis of price sensitivity, lifecycle, customer purchase basket, adoption rates, and purchase criteria
- Exhibits65: Chart on Market share By Geographical Landscape 2023-2028 (%)
- Exhibits66: Data Table on Market share By Geographical Landscape 2023-2028 (%)
- Exhibits67: Chart on Geographic comparison
- Exhibits68: Data Table on Geographic comparison
- Exhibits69: Chart on APAC - Market size and forecast 2023-2028 ($ million)
- Exhibits70: Data Table on APAC - Market size and forecast 2023-2028 ($ million)
- Exhibits71: Chart on APAC - Year-over-year growth 2023-2028 (%)
- Exhibits72: Data Table on APAC - Year-over-year growth 2023-2028 (%)
- Exhibits73: Chart on Europe - Market size and forecast 2023-2028 ($ million)
- Exhibits74: Data Table on Europe - Market size and forecast 2023-2028 ($ million)
- Exhibits75: Chart on Europe - Year-over-year growth 2023-2028 (%)
- Exhibits76: Data Table on Europe - Year-over-year growth 2023-2028 (%)
- Exhibits77: Chart on North America - Market size and forecast 2023-2028 ($ million)
- Exhibits78: Data Table on North America - Market size and forecast 2023-2028 ($ million)
- Exhibits79: Chart on North America - Year-over-year growth 2023-2028 (%)
- Exhibits80: Data Table on North America - Year-over-year growth 2023-2028 (%)
- Exhibits81: Chart on Middle East and Africa - Market size and forecast 2023-2028 ($ million)
- Exhibits82: Data Table on Middle East and Africa - Market size and forecast 2023-2028 ($ million)
- Exhibits83: Chart on Middle East and Africa - Year-over-year growth 2023-2028 (%)
- Exhibits84: Data Table on Middle East and Africa - Year-over-year growth 2023-2028 (%)
- Exhibits85: Chart on South America - Market size and forecast 2023-2028 ($ million)
- Exhibits86: Data Table on South America - Market size and forecast 2023-2028 ($ million)
- Exhibits87: Chart on South America - Year-over-year growth 2023-2028 (%)
- Exhibits88: Data Table on South America - Year-over-year growth 2023-2028 (%)
- Exhibits89: Chart on China - Market size and forecast 2023-2028 ($ million)
- Exhibits90: Data Table on China - Market size and forecast 2023-2028 ($ million)
- Exhibits91: Chart on China - Year-over-year growth 2023-2028 (%)
- Exhibits92: Data Table on China - Year-over-year growth 2023-2028 (%)
- Exhibits93: Chart on US - Market size and forecast 2023-2028 ($ million)
- Exhibits94: Data Table on US - Market size and forecast 2023-2028 ($ million)
- Exhibits95: Chart on US - Year-over-year growth 2023-2028 (%)
- Exhibits96: Data Table on US - Year-over-year growth 2023-2028 (%)
- Exhibits97: Chart on Germany - Market size and forecast 2023-2028 ($ million)
- Exhibits98: Data Table on Germany - Market size and forecast 2023-2028 ($ million)
- Exhibits99: Chart on Germany - Year-over-year growth 2023-2028 (%)
- Exhibits100: Data Table on Germany - Year-over-year growth 2023-2028 (%)
- Exhibits101: Chart on France - Market size and forecast 2023-2028 ($ million)
- Exhibits102: Data Table on France - Market size and forecast 2023-2028 ($ million)
- Exhibits103: Chart on France - Year-over-year growth 2023-2028 (%)
- Exhibits104: Data Table on France - Year-over-year growth 2023-2028 (%)
- Exhibits105: Chart on Canada - Market size and forecast 2023-2028 ($ million)
- Exhibits106: Data Table on Canada - Market size and forecast 2023-2028 ($ million)
- Exhibits107: Chart on Canada - Year-over-year growth 2023-2028 (%)
- Exhibits108: Data Table on Canada - Year-over-year growth 2023-2028 (%)
- Exhibits109: Market opportunity By Geographical Landscape ($ million)
- Exhibits110: Data Tables on Market opportunity By Geographical Landscape ($ million)
- Exhibits111: Impact of drivers and challenges in 2023 and 2028
- Exhibits112: Overview on criticality of inputs and factors of differentiation
- Exhibits113: Overview on factors of disruption
- Exhibits114: Impact of key risks on business
- Exhibits115: Companies covered
- Exhibits116: Matrix on companies position and classification
- Exhibits117: Advanced Biotech - Overview
- Exhibits118: Advanced Biotech - Product / Service
- Exhibits119: Advanced Biotech - Key offerings
- Exhibits120: Apple Flavor and Fragrance Group Co. Ltd. - Overview
- Exhibits121: Apple Flavor and Fragrance Group Co. Ltd. - Product / Service
- Exhibits122: Apple Flavor and Fragrance Group Co. Ltd. - Key offerings
- Exhibits123: Aurochemicals - Overview
- Exhibits124: Aurochemicals - Product / Service
- Exhibits125: Aurochemicals - Key offerings
- Exhibits126: Axxence Aromatic GmbH - Overview
- Exhibits127: Axxence Aromatic GmbH - Product / Service
- Exhibits128: Axxence Aromatic GmbH - Key offerings
- Exhibits129: BASF SE - Overview
- Exhibits130: BASF SE - Business segments
- Exhibits131: BASF SE - Key news
- Exhibits132: BASF SE - Key offerings
- Exhibits133: BASF SE - Segment focus
- Exhibits134: Borregaard ASA - Overview
- Exhibits135: Borregaard ASA - Business segments
- Exhibits136: Borregaard ASA - Key offerings
- Exhibits137: Borregaard ASA - Segment focus
- Exhibits138: BRENNTAG SE - Overview
- Exhibits139: BRENNTAG SE - Business segments
- Exhibits140: BRENNTAG SE - Key offerings
- Exhibits141: BRENNTAG SE - Segment focus
- Exhibits142: Camlin Fine Sciences Ltd. - Overview
- Exhibits143: Camlin Fine Sciences Ltd. - Product / Service
- Exhibits144: Camlin Fine Sciences Ltd. - Key offerings
- Exhibits145: De Monchy Aromatics Ltd. - Overview
- Exhibits146: De Monchy Aromatics Ltd. - Product / Service
- Exhibits147: De Monchy Aromatics Ltd. - Key offerings
- Exhibits148: Evolva Holding AG - Overview
- Exhibits149: Evolva Holding AG - Product / Service
- Exhibits150: Evolva Holding AG - Key offerings
- Exhibits151: Jiaxing Zhonghua Chemical Co. Ltd. - Overview
- Exhibits152: Jiaxing Zhonghua Chemical Co. Ltd. - Product / Service
- Exhibits153: Jiaxing Zhonghua Chemical Co. Ltd. - Key offerings
- Exhibits154: Lesaffre and Cie - Overview
- Exhibits155: Lesaffre and Cie - Product / Service
- Exhibits156: Lesaffre and Cie - Key offerings
- Exhibits157: Merck KGaA - Overview
- Exhibits158: Merck KGaA - Business segments
- Exhibits159: Merck KGaA - Key news
- Exhibits160: Merck KGaA - Key offerings
- Exhibits161: Merck KGaA - Segment focus
- Exhibits162: Solvay SA - Overview
- Exhibits163: Solvay SA - Business segments
- Exhibits164: Solvay SA - Key news
- Exhibits165: Solvay SA - Key offerings
- Exhibits166: Solvay SA - Segment focus
- Exhibits167: TANOBIO - Overview
- Exhibits168: TANOBIO - Product / Service
- Exhibits169: TANOBIO - Key offerings
- Exhibits170: Inclusions checklist
- Exhibits171: Exclusions checklist
- Exhibits172: Currency conversion rates for US$
- Exhibits173: Research methodology
- Exhibits174: Information sources
- Exhibits175: Data validation
- Exhibits176: Validation techniques employed for market sizing
- Exhibits177: Data synthesis
- Exhibits178: 360 degree market analysis
- Exhibits179: List of abbreviations
The vanillin market is forecasted to grow by USD 510.1 mn during 2023-2028, accelerating at a CAGR of 11.87% during the forecast period. The report on the vanillin market provides a holistic analysis, market size and forecast, trends, growth drivers, and challenges, as well as vendor analysis covering around 25 vendors.
The report offers an up-to-date analysis regarding the current market scenario, the latest trends and drivers, and the overall market environment. The market is driven by increasing disposable incomes, burgeoning demand from the confectionery industry, and growing popularity of ethyl vanillin.
Technavio's vanillin market is segmented as below:
| Market Scope | |
|---|---|
| Base Year | 2024 |
| End Year | 2028 |
| Series Year | 2024-2028 |
| Growth Momentum | Accelerate |
| YOY 2024 | 10.29% |
| CAGR | 11.87% |
| Incremental Value | $510.1mn |
By End-user
- Food and beverages
- Fragrances
- Pharmaceuticals
By Type
- Natural vanillin
- Synthetic vanillin
By Geographical Landscape
- APAC
- Europe
- North America
- Middle East and Africa
- South America
This study identifies the emergence of environmentally friendly production process using a catalyst as one of the prime reasons driving the vanillin market growth during the next few years. Also, emerging use of vanillin as a remedy for psoriasis and increasing disposable incomes will lead to sizable demand in the market.
The report on the vanillin market covers the following areas:
- Vanillin market sizing
- Vanillin market forecast
- Vanillin market industry analysis
The robust vendor analysis is designed to help clients improve their market position, and in line with this, this report provides a detailed analysis of several leading vanillin market vendors that include Advanced Biotech, Apple Flavor and Fragrance Group Co. Ltd., Aurochemicals, Axxence Aromatic GmbH, BASF SE, Borregaard ASA, BRENNTAG SE, Camlin Fine Sciences Ltd., Comax MFG Corp., De Monchy Aromatics Ltd., Evolva Holding AG, Jiaxing Zhonghua Chemical Co. Ltd., Lesaffre and Cie, Liaoning Shixing Pharmaceutical and Chemical Co. Ltd., Merck KGaA, Omega Ingredients Ltd., Solvay SA, TANOBIO, Viachem Inc., and Vigon International Inc.. Also, the vanillin market analysis report includes information on upcoming trends and challenges that will influence market growth. This is to help companies strategize and leverage all forthcoming growth opportunities.
The study was conducted using an objective combination of primary and secondary information including inputs from key participants in the industry. The report contains a comprehensive market and vendor landscape in addition to an analysis of the key vendors.
The publisher presents a detailed picture of the market by the way of study, synthesis, and summation of data from multiple sources by an analysis of key parameters such as profit, pricing, competition, and promotions. It presents various market facets by identifying the key industry influencers. The data presented is comprehensive, reliable, and a result of extensive research - both primary and secondary. The market research reports provide a complete competitive landscape and an in-depth vendor selection methodology and analysis using qualitative and quantitative research to forecast the accurate market growth.
Table of Contents
1 Executive Summary
- 1.1 Market overview
- Executive Summary - Chart on Market Overview
- Executive Summary - Data Table on Market Overview
- Executive Summary - Chart on Global Market Characteristics
- Executive Summary - Chart on Market By Geographical Landscape
- Executive Summary - Chart on Market Segmentation by End-user
- Executive Summary - Chart on Market Segmentation by Type
- Executive Summary - Chart on Incremental Growth
- Executive Summary - Data Table on Incremental Growth
- Executive Summary - Chart on Company Market Positioning
2 Market Landscape
- 2.1 Market ecosystem
- Parent Market
- Data Table on - Parent Market
- 2.2 Market characteristics
- Market characteristics analysis
- 2.3 Value chain analysis
- Value Chain Analysis
3 Market Sizing
- 3.1 Market definition
- Offerings of companies included in the market definition
- 3.2 Market segment analysis
- Market segments
- 3.3 Market size 2023
- 3.4 Market outlook: Forecast for 2023-2028
- Chart on Global - Market size and forecast 2023-2028 ($ million)
- Data Table on Global - Market size and forecast 2023-2028 ($ million)
- Chart on Global Market: Year-over-year growth 2023-2028 (%)
- Data Table on Global Market: Year-over-year growth 2023-2028 (%)
4 Historic Market Size
- 4.1 Global Vanillin 2018 - 2022
- Historic Market Size - Data Table on Global Vanillin 2018 - 2022 ($ million)
- 4.2 End-user segment analysis 2018 - 2022
- Historic Market Size - End-user Segment 2018 - 2022 ($ million)
- 4.3 Type segment analysis 2018 - 2022
- Historic Market Size - Type Segment 2018 - 2022 ($ million)
- 4.4 Geography segment analysis 2018 - 2022
- Historic Market Size - Geography Segment 2018 - 2022 ($ million)
- 4.5 Country segment analysis 2018 - 2022
- Historic Market Size - Country Segment 2018 - 2022 ($ million)
5 Five Forces Analysis
- 5.1 Five forces summary
- Five forces analysis - Comparison between 2023 and 2028
- 5.2 Bargaining power of buyers
- Bargaining power of buyers - Impact of key factors 2023 and 2028
- 5.3 Bargaining power of suppliers
- Bargaining power of suppliers - Impact of key factors in 2023 and 2028
- 5.4 Threat of new entrants
- Threat of new entrants - Impact of key factors in 2023 and 2028
- 5.5 Threat of substitutes
- Threat of substitutes - Impact of key factors in 2023 and 2028
- 5.6 Threat of rivalry
- Threat of rivalry - Impact of key factors in 2023 and 2028
- 5.7 Market condition
- Chart on Market condition - Five forces 2023 and 2028
6 Market Segmentation by End-user
- 6.1 Market segments
- Chart on End-user - Market share 2023-2028 (%)
- Data Table on End-user - Market share 2023-2028 (%)
- 6.2 Comparison by End-user
- Chart on Comparison by End-user
- Data Table on Comparison by End-user
- 6.3 Food and beverages - Market size and forecast 2023-2028
- Chart on Food and beverages - Market size and forecast 2023-2028 ($ million)
- Data Table on Food and beverages - Market size and forecast 2023-2028 ($ million)
- Chart on Food and beverages - Year-over-year growth 2023-2028 (%)
- Data Table on Food and beverages - Year-over-year growth 2023-2028 (%)
- 6.4 Fragrances - Market size and forecast 2023-2028
- Chart on Fragrances - Market size and forecast 2023-2028 ($ million)
- Data Table on Fragrances - Market size and forecast 2023-2028 ($ million)
- Chart on Fragrances - Year-over-year growth 2023-2028 (%)
- Data Table on Fragrances - Year-over-year growth 2023-2028 (%)
- 6.5 Pharmaceuticals - Market size and forecast 2023-2028
- Chart on Pharmaceuticals - Market size and forecast 2023-2028 ($ million)
- Data Table on Pharmaceuticals - Market size and forecast 2023-2028 ($ million)
- Chart on Pharmaceuticals - Year-over-year growth 2023-2028 (%)
- Data Table on Pharmaceuticals - Year-over-year growth 2023-2028 (%)
- 6.6 Market opportunity by End-user
- Market opportunity by End-user ($ million)
- Data Table on Market opportunity by End-user ($ million)
7 Market Segmentation by Type
- 7.1 Market segments
- Chart on Type - Market share 2023-2028 (%)
- Data Table on Type - Market share 2023-2028 (%)
- 7.2 Comparison by Type
- Chart on Comparison by Type
- Data Table on Comparison by Type
- 7.3 Natural vanillin - Market size and forecast 2023-2028
- Chart on Natural vanillin - Market size and forecast 2023-2028 ($ million)
- Data Table on Natural vanillin - Market size and forecast 2023-2028 ($ million)
- Chart on Natural vanillin - Year-over-year growth 2023-2028 (%)
- Data Table on Natural vanillin - Year-over-year growth 2023-2028 (%)
- 7.4 Synthetic vanillin - Market size and forecast 2023-2028
- Chart on Synthetic vanillin - Market size and forecast 2023-2028 ($ million)
- Data Table on Synthetic vanillin - Market size and forecast 2023-2028 ($ million)
- Chart on Synthetic vanillin - Year-over-year growth 2023-2028 (%)
- Data Table on Synthetic vanillin - Year-over-year growth 2023-2028 (%)
- 7.5 Market opportunity by Type
- Market opportunity by Type ($ million)
- Data Table on Market opportunity by Type ($ million)
8 Customer Landscape
- 8.1 Customer landscape overview
- Analysis of price sensitivity, lifecycle, customer purchase basket, adoption rates, and purchase criteria
9 Geographic Landscape
- 9.1 Geographic segmentation
- Chart on Market share By Geographical Landscape 2023-2028 (%)
- Data Table on Market share By Geographical Landscape 2023-2028 (%)
- 9.2 Geographic comparison
- Chart on Geographic comparison
- Data Table on Geographic comparison
- 9.3 APAC - Market size and forecast 2023-2028
- Chart on APAC - Market size and forecast 2023-2028 ($ million)
- Data Table on APAC - Market size and forecast 2023-2028 ($ million)
- Chart on APAC - Year-over-year growth 2023-2028 (%)
- Data Table on APAC - Year-over-year growth 2023-2028 (%)
- 9.4 Europe - Market size and forecast 2023-2028
- Chart on Europe - Market size and forecast 2023-2028 ($ million)
- Data Table on Europe - Market size and forecast 2023-2028 ($ million)
- Chart on Europe - Year-over-year growth 2023-2028 (%)
- Data Table on Europe - Year-over-year growth 2023-2028 (%)
- 9.5 North America - Market size and forecast 2023-2028
- Chart on North America - Market size and forecast 2023-2028 ($ million)
- Data Table on North America - Market size and forecast 2023-2028 ($ million)
- Chart on North America - Year-over-year growth 2023-2028 (%)
- Data Table on North America - Year-over-year growth 2023-2028 (%)
- 9.6 Middle East and Africa - Market size and forecast 2023-2028
- Chart on Middle East and Africa - Market size and forecast 2023-2028 ($ million)
- Data Table on Middle East and Africa - Market size and forecast 2023-2028 ($ million)
- Chart on Middle East and Africa - Year-over-year growth 2023-2028 (%)
- Data Table on Middle East and Africa - Year-over-year growth 2023-2028 (%)
- 9.7 South America - Market size and forecast 2023-2028
- Chart on South America - Market size and forecast 2023-2028 ($ million)
- Data Table on South America - Market size and forecast 2023-2028 ($ million)
- Chart on South America - Year-over-year growth 2023-2028 (%)
- Data Table on South America - Year-over-year growth 2023-2028 (%)
- 9.8 China - Market size and forecast 2023-2028
- Chart on China - Market size and forecast 2023-2028 ($ million)
- Data Table on China - Market size and forecast 2023-2028 ($ million)
- Chart on China - Year-over-year growth 2023-2028 (%)
- Data Table on China - Year-over-year growth 2023-2028 (%)
- 9.9 US - Market size and forecast 2023-2028
- Chart on US - Market size and forecast 2023-2028 ($ million)
- Data Table on US - Market size and forecast 2023-2028 ($ million)
- Chart on US - Year-over-year growth 2023-2028 (%)
- Data Table on US - Year-over-year growth 2023-2028 (%)
- 9.10 Germany - Market size and forecast 2023-2028
- Chart on Germany - Market size and forecast 2023-2028 ($ million)
- Data Table on Germany - Market size and forecast 2023-2028 ($ million)
- Chart on Germany - Year-over-year growth 2023-2028 (%)
- Data Table on Germany - Year-over-year growth 2023-2028 (%)
- 9.11 France - Market size and forecast 2023-2028
- Chart on France - Market size and forecast 2023-2028 ($ million)
- Data Table on France - Market size and forecast 2023-2028 ($ million)
- Chart on France - Year-over-year growth 2023-2028 (%)
- Data Table on France - Year-over-year growth 2023-2028 (%)
- 9.12 Canada - Market size and forecast 2023-2028
- Chart on Canada - Market size and forecast 2023-2028 ($ million)
- Data Table on Canada - Market size and forecast 2023-2028 ($ million)
- Chart on Canada - Year-over-year growth 2023-2028 (%)
- Data Table on Canada - Year-over-year growth 2023-2028 (%)
- 9.13 Market opportunity By Geographical Landscape
- Market opportunity By Geographical Landscape ($ million)
- Data Tables on Market opportunity By Geographical Landscape ($ million)
10 Drivers, Challenges, and Opportunity/Restraints
- 10.1 Market drivers
- 10.2 Market challenges
- 10.3 Impact of drivers and challenges
- Impact of drivers and challenges in 2023 and 2028
- 10.4 Market opportunities/restraints
11 Competitive Landscape
- 11.1 Overview
- 11.2 Competitive Landscape
- Overview on criticality of inputs and factors of differentiation
- 11.3 Landscape disruption
- Overview on factors of disruption
- 11.4 Industry risks
- Impact of key risks on business
12 Competitive Analysis
- 12.1 Companies profiled
- Companies covered
- 12.2 Market positioning of companies
- Matrix on companies position and classification
- 12.3 Advanced Biotech
- Advanced Biotech - Overview
- Advanced Biotech - Product / Service
- Advanced Biotech - Key offerings
- 12.4 Apple Flavor and Fragrance Group Co. Ltd.
- Apple Flavor and Fragrance Group Co. Ltd. - Overview
- Apple Flavor and Fragrance Group Co. Ltd. - Product / Service
- Apple Flavor and Fragrance Group Co. Ltd. - Key offerings
- 12.5 Aurochemicals
- Aurochemicals - Overview
- Aurochemicals - Product / Service
- Aurochemicals - Key offerings
- 12.6 Axxence Aromatic GmbH
- Axxence Aromatic GmbH - Overview
- Axxence Aromatic GmbH - Product / Service
- Axxence Aromatic GmbH - Key offerings
- 12.7 BASF SE
- BASF SE - Overview
- BASF SE - Business segments
- BASF SE - Key news
- BASF SE - Key offerings
- BASF SE - Segment focus
- 12.8 Borregaard ASA
- Borregaard ASA - Overview
- Borregaard ASA - Business segments
- Borregaard ASA - Key offerings
- Borregaard ASA - Segment focus
- 12.9 BRENNTAG SE
- BRENNTAG SE - Overview
- BRENNTAG SE - Business segments
- BRENNTAG SE - Key offerings
- BRENNTAG SE - Segment focus
- 12.10 Camlin Fine Sciences Ltd.
- Camlin Fine Sciences Ltd. - Overview
- Camlin Fine Sciences Ltd. - Product / Service
- Camlin Fine Sciences Ltd. - Key offerings
- 12.11 De Monchy Aromatics Ltd.
- De Monchy Aromatics Ltd. - Overview
- De Monchy Aromatics Ltd. - Product / Service
- De Monchy Aromatics Ltd. - Key offerings
- 12.12 Evolva Holding AG
- Evolva Holding AG - Overview
- Evolva Holding AG - Product / Service
- Evolva Holding AG - Key offerings
- 12.13 Jiaxing Zhonghua Chemical Co. Ltd.
- Jiaxing Zhonghua Chemical Co. Ltd. - Overview
- Jiaxing Zhonghua Chemical Co. Ltd. - Product / Service
- Jiaxing Zhonghua Chemical Co. Ltd. - Key offerings
- 12.14 Lesaffre and Cie
- Lesaffre and Cie - Overview
- Lesaffre and Cie - Product / Service
- Lesaffre and Cie - Key offerings
- 12.15 Merck KGaA
- Merck KGaA - Overview
- Merck KGaA - Business segments
- Merck KGaA - Key news
- Merck KGaA - Key offerings
- Merck KGaA - Segment focus
- 12.16 Solvay SA
- Solvay SA - Overview
- Solvay SA - Business segments
- Solvay SA - Key news
- Solvay SA - Key offerings
- Solvay SA - Segment focus
- 12.17 TANOBIO
- TANOBIO - Overview
- TANOBIO - Product / Service
- TANOBIO - Key offerings
13 Appendix
- 13.1 Scope of the report
- 13.2 Inclusions and exclusions checklist
- Inclusions checklist
- Exclusions checklist
- 13.3 Currency conversion rates for US$
- Currency conversion rates for US$
- 13.4 Research methodology
- Research methodology
- 13.5 Data procurement
- Information sources
- 13.6 Data validation
- Data validation
- 13.7 Validation techniques employed for market sizing
- Validation techniques employed for market sizing
- 13.8 Data synthesis
- Data synthesis
- 13.9 360 degree market analysis
- 360 degree market analysis
- 13.10 List of abbreviations
- List of abbreviations
