|
|
市場調査レポート
商品コード
1611728
ヘルスケアデジタルツインの市場規模、シェア、動向分析レポート:コンポーネント別、用途別、最終用途別、地域別、セグメント予測、2025年~2030年Healthcare Digital Twins Market Size, Share & Trends Analysis Report By Component (Software, Services), By Application (Personalized Medicine, Drug Discovery & Development), By End Use, By Region, And Segment Forecasts, 2025 - 2030 |
||||||
|
|||||||
カスタマイズ可能
|
|||||||


| ヘルスケアデジタルツインの市場規模、シェア、動向分析レポート:コンポーネント別、用途別、最終用途別、地域別、セグメント予測、2025年~2030年 |
|
出版日: 2024年11月19日
発行: Grand View Research
ページ情報: 英文 150 Pages
納期: 2~10営業日
|

全表示
- 概要
- 図表
- 目次
ヘルスケアデジタルツイン市場の成長と動向:
Grand View Research, Inc.の最新レポートによると、世界のヘルスケアデジタルツイン市場規模は2030年までに35億5,000万米ドルに達すると推定されています。
同市場は2025年から2030年にかけてCAGR 25.9%で成長すると予測されています。デジタルツインは、利用可能なすべてのデータをリアルタイムで取り込んで更新する、対象物やプロセスのデジタルモデルまたはリアルタイムの複製です。
この技術は、ヘルスケアにおいて、シナリオの安全性と経済的実行可能性を、現実世界に投入する前にテストするために使用されます。ヘルスケア業界におけるデジタルツインの開発はまだ初期段階にあるが、科学者たちは外科手術の実行可能性をテストし、個別化医療を開発するためにこの技術を採用しています。これらは、予測期間中の市場成長を促進すると予想される主な要因の一部です。例えば、デジタルツインは、多発性硬化症やアルツハイマー病などの病気を研究するためにヘルスケアで使用され、治療オプションをよりよく理解し、臨床試験のスケジュールを加速します。
ヘルスケアにおける人工知能の採用の増加は、この技術の採用をさらに促進すると予想されます。API、グラフデータベース、自然言語処理(NLP)などのコンポーネントを統合し、ヘルスケアやその他のライフサイエンス組織向けにデジタルツインを構築することで、医療コストの削減と医療成果の向上に貢献します。デジタルツインは、データに裏打ちされたフィードバック、データ収集、データ介入を提供することで業界を変革するのに役立ち、医療コストの大幅な削減が期待されます。
新興企業の出現と主要企業の参入は、市場の成長を大きく後押しすると予想されます。例えば、フランスを拠点とするSim&Cure社は、脳外科医がシミュレーションを用いて動脈瘤を治療するのを支援するデジタルツインソリューション、Sim&Sizeを提供しています。動脈瘤は脳卒中や脳血栓の原因となる肥大した血管です。さらに、新興企業への資金提供の増加は、予測期間中に技術の採用を促進すると予想されています。例えば、2021年10月、カリフォルニアとチェンナイを拠点とする新興企業Twin Healthは、シリーズC資金調達ラウンドで1億4,000万米ドルを調達しました。この新興企業はAIを搭載したプラットフォームで、医師と患者に睡眠活動、栄養、瞑想呼吸に関するガイダンスを提供し、肝疾患、II型糖尿病、心血管疾患などの慢性疾患の回復と予防に役立っています。
さらに、デジタルツインの採用を改善するための様々な政府の取り組みが、この技術の需要を促進すると予想されています。例えば、欧州政府が立ち上げた旗艦プロジェクトであるDigiTwinsは、通信、先進オミックス、センシング技術、コンピューティングを利用してヘルスケア業界にパラダイムシフトをもたらすことを目的としています。欧州政府は、このプロジェクトの成長と開発を支援するため、10年間で11億米ドルを投資する計画です。さらに、英国のResearch and Innovationは、2023年6月にデジタルツインやデジタルハブを含むヘルスケア技術の進歩のために3,915万米ドルの資金提供を発表しました。
ヘルスケアデジタルツイン市場レポートハイライト
- 用途別では、個別化医療分野が2024年に27.4%の最大収益シェアで市場をリード。また、医療機器設計・検査セグメントは、予測期間中に最も速いCAGR成長が見込まれます。
- 最終用途別では、プロバイダー分野が2024年に36.2%の最大収益シェアで市場をリードしました。また、製薬・バイオ医薬品セグメントは予測期間中に最も速いCAGRで成長すると予測されています。
- 地域別では、北米が2024年に46.8%の最大収益シェアを占めました。有利な政府の取り組み、有利な資金調達、同地域における主要プレイヤーの存在などの要因が、同市場の成長に寄与しています。
目次
第1章 調査手法と範囲
第2章 エグゼクティブサマリー
第3章 ヘルスケアデジタルツイン市場の変数、動向、範囲
- 市場系統の見通し
- 親市場の見通し
- 補助市場の見通し
- 市場力学
- 市場牽引要因分析
- 市場抑制要因分析
- ヘルスケアデジタルツイン:市場分析ツール
- 業界分析- ポーターのファイブフォース分析
- PESTLE分析
- ヘルスケアデジタルツイン:市場:新たな動向とテクノロジー
- ヘルスケアデジタルツイン:市場:ケーススタディ分析
第4章 ヘルスケアデジタルツイン市場セグメント分析、コンポーネント別、2018年-2030年
- 定義と範囲
- コンポーネント市場シェア分析、2024年および2030年
- セグメントダッシュボード
- 世界のヘルスケアデジタルツイン市場(コンポーネント別、2018年~2030年)
- ソフトウェア
- ソフトウェア市場推計・予測、2018年から2030年
- サービス
- サービス市場推計・予測、2018年から2030年
第5章 ヘルスケアデジタルツイン市場セグメント分析、用途別、2018年-2030年
- 定義と範囲
- 用途市場シェア分析、2024年および2030年
- セグメントダッシュボード
- 世界のヘルスケアデジタルツイン市場、用途別、2018年から2030年
- 個別化医療
- パーソナライズ医療市場推計・予測、2018年から2030年
- ヘルスケアワークフローの最適化と資産管理
- ヘルスケアワークフロー最適化と資産管理市場推計・予測、2018年から2030年
- 医療機器の設計とテスト
- 医療機器の設計とテスト市場推計・予測、2018年から2030年
- 医薬品の発見と開発
- 2018年から2030年までの医薬品の発見と開発市場推計・予測
- 手術計画と医学教育
- 手術計画と医学教育市場推計・予測、2018年から2030年
- その他
- その他市場推計・予測、2018年から2030年
第6章 ヘルスケアデジタルツインの市場セグメント分析、最終用途別、2018年-2030年
- 定義と範囲
- 最終用途市場シェア分析、2024年および2030年
- セグメントダッシュボード
- 世界のヘルスケアデジタルツイン市場、最終用途別、2018年から2030年
- プロバイダー
- プロバイダー市場推計・予測、2018年から2030年
- 製薬・バイオ製薬企業
- 製薬およびバイオ製薬会社の市場推計・予測、2018年から2030年
- 医療機器企業
- 医療機器企業の市場推計・予測、2018年から2030年
- 研究・学術
- 研究・学術市場推計・予測、2018年から2030年
- その他
- その他市場推計・予測、2018年から2030年
第7章 ヘルスケアデジタルツイン市場セグメント分析、地域別、2018年-2030年
- 地域別市場シェア分析、2024年および2030年
- 地域市場ダッシュボード
- 地域市場のスナップショット
- ヘルスケアデジタルツインの地域別市場シェア、2024年と2030年:
- 北米
- 北米のヘルスケアデジタルツイン市場、2018年-2030年
- 米国
- カナダ
- メキシコ
- 欧州
- 欧州ヘルスケアデジタルツイン市場、2018年-2030年
- 英国
- ドイツ
- フランス
- イタリア
- スペイン
- ノルウェー
- スウェーデン
- デンマーク
- アジア太平洋
- アジア太平洋のヘルスケアデジタルツイン市場、2018年-2030年
- 日本
- 中国
- インド
- オーストラリア
- 韓国
- タイ
- ラテンアメリカ
- ラテンアメリカのヘルスケアデジタルツイン市場、2018年-2030年
- ブラジル
- アルゼンチン
- 中東・アフリカ
- 中東・アフリカヘルスケアデジタルツイン市場、2018-2030年
- 南アフリカ
- サウジアラビア
- アラブ首長国連邦
- クウェート
第8章 競合情勢
- 主要市場参入企業による最近の動向と影響分析
- 企業分類
- 企業プロファイル
- Atos
- Microsoft
- Philips Healthcare
- PrediSurge
- Unlearn AI
- QiO Technologies
- Verto Healthcare
- Dassault Systems(3DS System)
- ThoughWire
- Faststream Technologies
- Twin Health.
List of Tables
- Table 1. List of secondary sources
- Table 2. List of abbreviations
- Table 3. Global Healthcare Digital Twins Market, By Component, 2018 - 2030 (USD Million)
- Table 4. Global Healthcare Digital Twins Market, By Application, 2018 - 2030 (USD Million)
- Table 5. Global Healthcare Digital Twins Market, By End Use, 2018 - 2030 (USD Million)
- Table 6. Global Healthcare Digital Twins Market, By Region, 2018 - 2030 (USD Million)
- Table 7. North America Healthcare Digital Twins Market, By Country, 2018 - 2030 (USD Million)
- Table 8. North America Healthcare Digital Twins Market, By Component, 2018 - 2030 (USD Million)
- Table 9. North America Healthcare Digital Twins Market, By Application, 2018 - 2030 (USD Million)
- Table 10. North America Healthcare Digital Twins Market, By End Use, 2018 - 2030 (USD Million)
- Table 11. U.S. Healthcare Digital Twins Market, by Component, 2018 - 2030 (USD Million)
- Table 12. U.S. Healthcare Digital Twins Market, By Application, 2018 - 2030 (USD Million)
- Table 13. U.S. Healthcare Digital Twins Market, By End Use, 2018 - 2030 (USD Million)
- Table 14. Canada Healthcare Digital Twins Market, by Component, 2018 - 2030 (USD Million)
- Table 15. Canada Healthcare Digital Twins Market, By Application, 2018 - 2030 (USD Million)
- Table 16. Canada Healthcare Digital Twins Market, By End Use, 2018 - 2030 (USD Million)
- Table 17. Mexico Healthcare Digital Twins Market, by Component, 2018 - 2030 (USD Million)
- Table 18. Mexico Healthcare Digital Twins Market, By Application, 2018 - 2030 (USD Million)
- Table 19. Mexico Healthcare Digital Twins Market, By End Use, 2018 - 2030 (USD Million)
- Table 20. Europe Healthcare Digital Twins Market, by Country, 2018 - 2030 (USD Million)
- Table 21. Europe Healthcare Digital Twins Market, by Component, 2018 - 2030 (USD Million)
- Table 22. Europe Healthcare Digital Twins Market, By Application, 2018 - 2030 (USD Million)
- Table 23. Europe Healthcare Digital Twins Market, By End Use, 2018 - 2030 (USD Million)
- Table 24. UK. Healthcare Digital Twins Market, by Component, 2018 - 2030 (USD Million)
- Table 25. UK. Healthcare Digital Twins Market, By Application, 2018 - 2030 (USD Million)
- Table 26. UK Healthcare Digital Twins Market, By End Use, 2018 - 2030 (USD Million)
- Table 27. Germany Healthcare Digital Twins Market, by Component, 2018 - 2030 (USD Million)
- Table 28. Germany Healthcare Digital Twins Market, By Application, 2018 - 2030 (USD Million)
- Table 29. Germany Healthcare Digital Twins Market, By End Use, 2018 - 2030 (USD Million)
- Table 30. France Healthcare Digital Twins Market, by Component, 2018 - 2030 (USD Million)
- Table 31. France Healthcare Digital Twins Market, By Application, 2018 - 2030 (USD Million)
- Table 32. France Healthcare Digital Twins Market, By End Use, 2018 - 2030 (USD Million)
- Table 33. Italy Healthcare Digital Twins Market, by Component, 2018 - 2030 (USD Million)
- Table 34. Italy Healthcare Digital Twins Market, By Application, 2018 - 2030 (USD Million)
- Table 35. Italy Healthcare Digital Twins Market, By End Use, 2018 - 2030 (USD Million)
- Table 36. Spain Healthcare Digital Twins Market, by Component, 2018 - 2030 (USD Million)
- Table 37. Spain Healthcare Digital Twins Market, By Application, 2018 - 2030 (USD Million)
- Table 38. Spain Healthcare Digital Twins Market, By End Use, 2018 - 2030 (USD Million)
- Table 39. Denmark Healthcare Digital Twins Market, by Component, 2018 - 2030 (USD Million)
- Table 40. Denmark Healthcare Digital Twins Market, By Application, 2018 - 2030 (USD Million)
- Table 41. Denmark Healthcare Digital Twins Market, By End Use, 2018 - 2030 (USD Million)
- Table 42. Sweden Healthcare Digital Twins Market, by Component, 2018 - 2030 (USD Million)
- Table 43. Sweden Healthcare Digital Twins Market, By Application, 2018 - 2030 (USD Million)
- Table 44. Sweden Healthcare Digital Twins Market, By End Use, 2018 - 2030 (USD Million)
- Table 45. Norway Healthcare Digital Twins Market, by Component, 2018 - 2030 (USD Million)
- Table 46. Norway Healthcare Digital Twins Market, By Application, 2018 - 2030 (USD Million)
- Table 47. Norway Healthcare Digital Twins Market, By End Use, 2018 - 2030 (USD Million)
- Table 48. Asia Pacific Healthcare Digital Twins Market, by Country, 2018 - 2030 (USD Million)
- Table 49. Asia Pacific Healthcare Digital Twins Market, by Component, 2018 - 2030 (USD Million)
- Table 50. Asia Pacific Healthcare Digital Twins Market, By Application, 2018 - 2030 (USD Million)
- Table 51. Asia Pacific Healthcare Digital Twins Market, By End Use, 2018 - 2030 (USD Million)
- Table 52. Japan Healthcare Digital Twins Market, by Component, 2018 - 2030 (USD Million)
- Table 53. Japan Healthcare Digital Twins Market, By Application, 2018 - 2030 (USD Million)
- Table 54. Japan Healthcare Digital Twins Market, By End Use, 2018 - 2030 (USD Million)
- Table 55. China Healthcare Digital Twins Market, by Component, 2018 - 2030 (USD Million)
- Table 56. China Healthcare Digital Twins Market, By Application, 2018 - 2030 (USD Million)
- Table 57. China Healthcare Digital Twins Market, By End Use, 2018 - 2030 (USD Million)
- Table 58. India Healthcare Digital Twins Market, by Component, 2018 - 2030 (USD Million)
- Table 59. India Healthcare Digital Twins Market, By Application, 2018 - 2030 (USD Million)
- Table 60. India Healthcare Digital Twins Market, By End Use, 2018 - 2030 (USD Million)
- Table 61. Australia Healthcare Digital Twins Market, by Component, 2018 - 2030 (USD Million)
- Table 62. Australia Healthcare Digital Twins Market, By Application, 2018 - 2030 (USD Million)
- Table 63. Australia Healthcare Digital Twins Market, By End Use, 2018 - 2030 (USD Million)
- Table 64. Thailand Healthcare Digital Twins Market, by Component, 2018 - 2030 (USD Million)
- Table 65. Thailand Healthcare Digital Twins Market, By Application, 2018 - 2030 (USD Million)
- Table 66. Thailand Healthcare Digital Twins Market, By End Use, 2018 - 2030 (USD Million)
- Table 67. South Korea Healthcare Digital Twins Market, by Component, 2018 - 2030 (USD Million)
- Table 68. South Korea Healthcare Digital Twins Market, By Application, 2018 - 2030 (USD Million)
- Table 69. South Korea Healthcare Digital Twins Market, By End Use, 2018 - 2030 (USD Million)
- Table 70. Latin America Healthcare Digital Twins Market, by Country, 2018 - 2030 (USD Million)
- Table 71. Latin America Healthcare Digital Twins Market, by Component, 2018 - 2030 (USD Million)
- Table 72. Latin America Healthcare Digital Twins Market, By Application, 2018 - 2030 (USD Million)
- Table 73. Latin America Healthcare Digital Twins Market, By End Use, 2018 - 2030 (USD Million)
- Table 74. Brazil Healthcare Digital Twins Market, by Component, 2018 - 2030 (USD Million)
- Table 75. Brazil Healthcare Digital Twins Market, By Application, 2018 - 2030 (USD Million)
- Table 76. Brazil Healthcare Digital Twins Market, By End Use, 2018 - 2030 (USD Million)
- Table 77. Argentina Healthcare Digital Twins Market, by Component, 2018 - 2030 (USD Million)
- Table 78. Argentina Healthcare Digital Twins Market, By Application, 2018 - 2030 (USD Million)
- Table 79. Argentina Healthcare Digital Twins Market, By End Use, 2018 - 2030 (USD Million)
- Table 80. Middle East & Africa Healthcare Digital Twins Market, by Country, 2018 - 2030 (USD Million)
- Table 81. Middle East & Africa Healthcare Digital Twins Market, by Component, 2018 - 2030 (USD Million)
- Table 82. Middle East & Africa Healthcare Digital Twins Market, By Application, 2018 - 2030 (USD Million)
- Table 83. Middle East & Africa Healthcare Digital Twins Market, By End Use, 2018 - 2030 (USD Million)
- Table 84. South Africa Healthcare Digital Twins Market, by Component, 2018 - 2030 (USD Million)
- Table 85. South Africa Healthcare Digital Twins Market, By Application, 2018 - 2030 (USD Million)
- Table 86. South Africa Healthcare Digital Twins Market, By End Use, 2018 - 2030 (USD Million)
- Table 87. Saudi Arabia Healthcare Digital Twins Market, by Component, 2018 - 2030 (USD Million)
- Table 88. Saudi Arabia Healthcare Digital Twins Market, By Application, 2018 - 2030 (USD Million)
- Table 89. Saudi Arabia Healthcare Digital Twins Market, By End Use, 2018 - 2030 (USD Million)
- Table 90. UAE Healthcare Digital Twins Market, by Component, 2018 - 2030 (USD Million)
- Table 91. UAE Healthcare Digital Twins Market, By Application, 2018 - 2030 (USD Million)
- Table 92. UAE Healthcare Digital Twins Market, By End Use, 2018 - 2030 (USD Million)
- Table 93. Kuwait Healthcare Digital Twins Market, by Component, 2018 - 2030 (USD Million)
- Table 94. Kuwait Healthcare Digital Twins Market, By Application, 2018 - 2030 (USD Million)
- Table 95. Kuwait Healthcare Digital Twins Market, By End Use, 2018 - 2030 (USD Million)
List of Figures
- Fig 1. Market research process
- Fig 2. Data triangulation techniques
- Fig 3. Primary research pattern
- Fig 4. Market research approaches
- Fig 5. Value-chain-based sizing & forecasting
- Fig 6. QFD modeling for market share assessment
- Fig 7. Market formulation & validation
- Fig 8. Healthcare digital twin market: outlook
- Fig 9. Healthcare digital twin competitive insights
- Fig 10. Ancillary market outlook
- Fig 11. Healthcare digital twin market driver impact
- Fig 12. Healthcare digital twin market restraint impact
- Fig 13. Porter's Analysis
- Fig 14. PESTLE Analysis
- Fig 15. Healthcare digital twin market: Component movement analysis
- Fig 16. Healthcare digital twin market: Component outlook and key takeaways
- Fig 17. Software market estimates and forecast, 2018 - 2030
- Fig 18. Services market estimates and forecast, 2018 - 2030
- Fig 19. Healthcare digital twin market: Application movement analysis
- Fig 20. Healthcare digital twin market: Application outlook and key takeaways
- Fig 21. Personalized medicine market estimates and forecasts, 2018 - 2030
- Fig 22. Healthcare workflow optimization & asset management market estimates and forecasts,2018 - 2030
- Fig 23. Medical device design and testing market estimates and forecasts,2018 - 2030
- Fig 24. Drug discovery & development market estimates and forecasts,2018 - 2030
- Fig 25. Surgical planning and medical education market estimates and forecasts,2018 - 2030
- Fig 26. Others market estimates and forecasts,2018 - 2030
- Fig 27. Healthcare digital twin market: End Use movement analysis
- Fig 28. Healthcare digital twin market: End Use outlook and key takeaways
- Fig 29. Providers market estimates and forecasts, 2018 - 2030
- Fig 30. Pharma & bio pharma companies market estimates and forecasts, 2018 - 2030
- Fig 31. Medical device companies market estimates and forecasts, 2018 - 2030
- Fig 32. Research & academia market estimates and forecasts, 2018 - 2030
- Fig 33. Others market estimates and forecasts, 2018 - 2030
- Fig 34. Global healthcare digital twins market: Regional movement analysis
- Fig 35. Global healthcare digital twins market: Regional outlook and key takeaways
- Fig 36. North America healthcare digital twins market estimates and forecasts, 2018 - 2030 (USD million)
- Fig 37. Key country dynamics
- Fig 38. U.S. healthcare digital twins market estimates and forecasts, 2018 - 2030 (USD million)
- Fig 39. Key country dynamics
- Fig 40. Canada healthcare digital twins market estimates and forecasts, 2018 - 2030 (USD million)
- Fig 41. Key country dynamics
- Fig 42. Mexico healthcare digital twins market estimates and forecasts, 2018 - 2030 (USD million)
- Fig 43. Europe healthcare digital twins market estimates and forecasts, 2018 - 2030 (USD million)
- Fig 44. Key country dynamics
- Fig 45. UK healthcare digital twins market estimates and forecasts, 2018 - 2030 (USD million)
- Fig 46. Key country dynamics
- Fig 47. Germany healthcare digital twins market estimates and forecasts, 2018 - 2030 (USD million)
- Fig 48. Key country dynamics
- Fig 49. Spain healthcare digital twins market estimates and forecasts, 2018 - 2030 (USD million)
- Fig 50. Key country dynamics
- Fig 51. France healthcare digital twins market estimates and forecasts, 2018 - 2030 (USD million)
- Fig 52. Key country dynamics
- Fig 53. Italy healthcare digital twins market estimates and forecasts, 2018 - 2030 (USD million)
- Fig 54. Key country dynamics
- Fig 55. Norway healthcare digital twins market estimates and forecasts, 2018 - 2030 (USD million)
- Fig 56. Key country dynamics
- Fig 57. Denmark healthcare digital twins market estimates and forecasts, 2018 - 2030 (USD million)
- Fig 58. Key country dynamics
- Fig 59. Sweden healthcare digital twins market estimates and forecasts, 2018 - 2030 (USD million)
- Fig 60. Asia Pacific healthcare digital twins market estimates and forecasts, 2018 - 2030 (USD million)
- Fig 61. Key country dynamics
- Fig 62. Japan healthcare digital twins market estimates and forecasts, 2018 - 2030 (USD million)
- Fig 63. Key country dynamics
- Fig 64. China healthcare digital twins market estimates and forecasts, 2018 - 2030 (USD million)
- Fig 65. Key country dynamics
- Fig 66. India healthcare digital twins market estimates and forecasts, 2018 - 2030 (USD million)
- Fig 67. Key country dynamics
- Fig 68. Australia healthcare digital twins market estimates and forecasts, 2018 - 2030 (USD million)
- Fig 69. Key country dynamics
- Fig 70. South Korea healthcare digital twins market estimates and forecasts, 2018 - 2030 (USD million)
- Fig 71. Key country dynamics
- Fig 72. Thailand healthcare digital twins market estimates and forecasts, 2018 - 2030 (USD million)
- Fig 73. Latin America healthcare digital twins market estimates and forecasts, 2018 - 2030 (USD million)
- Fig 74. Key country dynamics
- Fig 75. Brazil healthcare digital twins market estimates and forecasts, 2018 - 2030 (USD million)
- Fig 76. Key country dynamics
- Fig 77. Argentina healthcare digital twins market estimates and forecasts, 2018 - 2030 (USD million)
- Fig 78. MEA healthcare digital twins market estimates and forecasts, 2018 - 2030 (USD million)
- Fig 79. Key country dynamics
- Fig 80. South Africa healthcare digital twins market estimates and forecasts, 2018 - 2030 (USD million)
- Fig 81. Key country dynamics
- Fig 82. Saudi Arabia healthcare digital twins market estimates and forecasts, 2018 - 2030 (USD million)
- Fig 83. Key country dynamics
- Fig 84. UAE healthcare digital twins market estimates and forecasts, 2018 - 2030 (USD million)
- Fig 85. Key country dynamics
- Fig 86. Kuwait healthcare digital twins market estimates and forecasts, 2018 - 2030 (USD million)
- Fig 87. Key company categorization
- Fig 88. Heat map analysis 2024
Healthcare Digital Twins Market Growth & Trends:
The global healthcare digital twins market size is estimated to reach USD 3.55 billion by 2030, according to a new report by Grand View Research, Inc. The market is anticipated to grow at a CAGR of 25.9% from 2025 to 2030. Digital twins are digital models or real-time replicas of an object or process that incorporates and updates all the available data in real-time.
The technology is used in healthcare to test the safety and economic viability of a scenario before it is launched into the real world. The adoption of digital twins in the healthcare industry is still in a nascent stage but scientists are adopting the technology to test the viability of surgical procedures and develop personalized medicine. These are some of the key factors anticipated to drive the market growth during the forecast period. For instance, digital twins are used in healthcare to study diseases such as multiple sclerosis and Alzheimer's to better understand the treatment options and accelerate clinical trial timelines.
The rising adoption of artificial intelligence in healthcare is anticipated to further drive the adoption of the technology. Integration of components such as APIs, graph databases, and natural language processing (NLP) to craft digital twins for healthcare and other life science organizations helps to reduce medical costs and enhance medical outcomes. Digital twins help to transform the industry by offering data-backed feedback, data capturing, and data interventions, which are anticipated to considerably reduce healthcare costs.
The emergence of startups and entry of key players in the market is anticipated to significantly boost the growth of the market. For instance, Sim&Cure a France-based company provides Sim&Size, a digital twin solution that helps brain surgeons to treat an aneurysm using simulations. Aneurysms are the enlarged vessels that can cause stroke and clots in the brain. Moreover, increased funding provided to the startups is anticipated to promote the adoption of the technology during the forecast period. For instance, in October 2021, Twin Health a California and Chennai-based startup raised USD 140 million in a Series C funding round. The startup is an AI-powered platform that provides doctors and patients the guidance on sleep activity, nutrition, and meditative breathing that helps to reverse and prevent chronic conditions such as liver diseases, Type-II diabetes, and cardiovascular diseases.
In addition, various government initiatives to improve the adoption of digital twins are anticipated to drive the demand for the technology. For instance, DigiTwins, a flagship project launched by the European Government aims to bring paradigm shifts in the healthcare industry using communication, advanced omics, sensing technologies, and computing. The European government plans to invest USD 1.1 billion in the project over 10 years to support its growth and development. Moreover, UK Research and Innovation announced funding of USD 39.15 million for healthcare technological advancements, including digital twins and digital hubs, in June 2023.
Healthcare Digital Twins Market Report Highlights:
- Based on application, the personalized medicine segment led the market with the largest revenue share of 27.4% in 2024. And the medical device design and testing segment is anticipated to witness at the fastest CAGR growth over the forecast period
- In terms of end use, the providers segment led the market with the largest revenue share of 36.2% in 2024. And the pharma & biopharma segment is anticipated to witness at the fastest CAGR over the forecast period
- Based on region, North America held the largest revenue share of 46.8% in 2024. Factors such as favorable government initiatives, lucrative funding, and the presence of key players in the region contributed to the growth of the market
Table of Contents
Chapter 1. Methodology and Scope
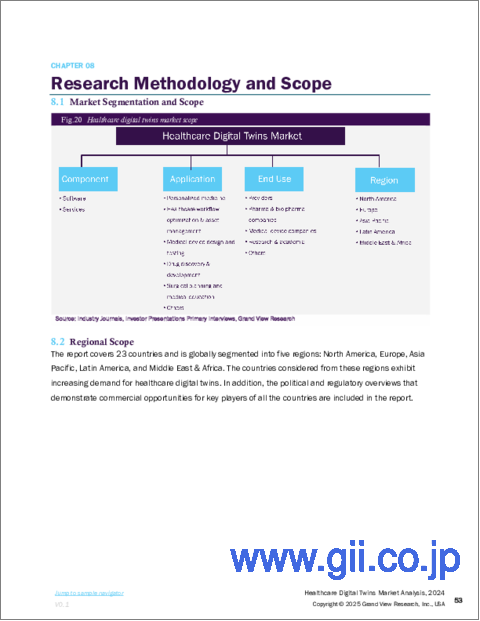
- 1.1. Market Segmentation & Scope
- 1.1.1. Segment scope
- 1.1.2. Regional scope
- 1.1.3. Estimates and forecast timeline
- 1.2. Research Methodology
- 1.3. Information Procurement
- 1.3.1. Purchased database
- 1.3.2. GVR's internal database
- 1.3.3. Secondary sources
- 1.3.4. Primary research
- 1.3.5. Details of primary research
- 1.4. Information or Data Analysis
- 1.4.1. Data analysis models
- 1.5. Market Formulation & Validation
- 1.6. Model Details
- 1.7. Research Assumptions
- 1.8. List of Secondary Sources
- 1.9. List of Primary Sources
Chapter 2. Executive Summary
- 2.1. Market Outlook
- 2.2. Segment Outlook
- 2.2.1. Component outlook
- 2.2.2. Application outlook
- 2.2.3. End Use outlook
- 2.2.4. Regional outlook
- 2.3. Competitive Insights
Chapter 3. Healthcare Digital Twins Market Variables, Trends & Scope
- 3.1. Market Lineage Outlook
- 3.1.1. Parent market outlook
- 3.1.2. Ancillary market outlook
- 3.2. Market Dynamics
- 3.2.1. Market driver analysis
- 3.2.2. Market restraint analysis
- 3.3. Healthcare Digital Twins: Market Analysis Tools
- 3.3.1. Industry Analysis - Porter's
- 3.3.2. PESTLE Analysis
- 3.4. Healthcare Digital Twins: Market: Emerging Trends and Technologies
- 3.5. Healthcare Digital Twins: Market: Case Study Analysis
Chapter 4. Healthcare Digital Twins Market Segment Analysis, By Component, 2018 - 2030 (USD Million)
- 4.1. Definition and Scope
- 4.2. Component Market Share Analysis, 2024 & 2030
- 4.3. Segment Dashboard
- 4.4. Global Healthcare Digital Twins Market, by Component, 2018 to 2030
- 4.5. Software
- 4.5.1. Software market estimates and forecasts, 2018 to 2030 (USD Million)
- 4.6. Services
- 4.6.1. Services market estimates and forecasts, 2018 to 2030 (USD Million)
Chapter 5. Healthcare Digital Twins Market Segment Analysis, By Application, 2018 - 2030 (USD Million)
- 5.1. Definition and Scope
- 5.2. Application Market Share Analysis, 2024 & 2030
- 5.3. Segment Dashboard
- 5.4. Global Healthcare Digital Twins Market, by Application, 2018 to 2030
- 5.5. Personalized medicine
- 5.5.1. Personalized medicine market estimates and forecasts, 2018 to 2030 (USD million)
- 5.6. Healthcare workflow optimization & asset management
- 5.6.1. Healthcare workflow optimization & asset management market estimates and forecasts, 2018 to 2030 (USD Million)
- 5.7. Medical device design and testing
- 5.7.1. Medical device design and testing market estimates and forecasts, 2018 to 2030 (USD Million)
- 5.8. Drug discovery & development
- 5.8.1. Drug discovery & development market estimates and forecasts, 2018 to 2030 (USD Million)
- 5.9. Surgical planning and medical education
- 5.9.1. Surgical planning and medical education market estimates and forecasts, 2018 to 2030 (USD Million)
- 5.10. Others
- 5.10.1. Others market estimates and forecasts, 2018 to 2030 (USD Million)
Chapter 6. Healthcare Digital Twins Market Segment Analysis, By End Use, 2018 - 2030 (USD Million)
- 6.1. Definition and Scope
- 6.2. End Use Market Share Analysis, 2024 & 2030
- 6.3. Segment Dashboard
- 6.4. Global Healthcare Digital Twins Market, by End Use, 2018 to 2030
- 6.5. Providers
- 6.5.1. Providers market estimates and forecasts, 2018 to 2030 (USD million)
- 6.6. Pharma & bio pharma companies
- 6.6.1. Pharma & bio pharma companies market estimates and forecasts, 2018 to 2030 (USD Million)
- 6.7. Medical device companies
- 6.7.1. Medical device companies market estimates and forecasts, 2018 to 2030 (USD million)
- 6.8. Research & academia
- 6.8.1. Research & academia market estimates and forecasts, 2018 to 2030 (USD million)
- 6.9. Others
- 6.9.1. Others market estimates and forecasts, 2018 to 2030 (USD million)
Chapter 7. Healthcare Digital Twins Market Segment Analysis, By Region, 2018 - 2030 (USD Million)
- 7.1. Regional Market Share Analysis, 2024 & 2030
- 7.2. Regional Market Dashboard
- 7.3. Regional Market Snapshot
- 7.4. Healthcare Digital Twins Market Share by Region, 2024 & 2030:
- 7.5. North America
- 7.5.1. North America healthcare digital twins market, 2018 - 2030 (USD Million)
- 7.5.2. U.S.
- 7.5.2.1. U.S. healthcare digital twins market, 2018 - 2030 (USD Million)
- 7.5.3. Canada
- 7.5.3.1. Canada healthcare digital twins market, 2018 - 2030 (USD Million)
- 7.5.4. Mexico
- 7.5.4.1. Mexico healthcare digital twins market, 2018 - 2030 (USD Million)
- 7.6. Europe
- 7.6.1. Europe healthcare digital twins market, 2018 - 2030 (USD Million)
- 7.6.2. UK
- 7.6.2.1. UK healthcare digital twins market, 2018 - 2030 (USD Million)
- 7.6.3. Germany
- 7.6.3.1. Germany healthcare digital twins market, 2018 - 2030 (USD Million)
- 7.6.4. France
- 7.6.4.1. France healthcare digital twins market, 2018 - 2030 (USD Million)
- 7.6.5. Italy
- 7.6.5.1. Italy healthcare digital twins market, 2018 - 2030 (USD Million)
- 7.6.6. Spain
- 7.6.6.1. Spain healthcare digital twins market, 2018 - 2030 (USD Million)
- 7.6.7. Norway
- 7.6.7.1. Norway healthcare digital twins market, 2018 - 2030 (USD Million)
- 7.6.8. Sweden
- 7.6.8.1. Sweden healthcare digital twins market, 2018 - 2030 (USD Million)
- 7.6.9. Denmark
- 7.6.9.1. Denmark healthcare digital twins market, 2018 - 2030 (USD Million)
- 7.7. Asia Pacific
- 7.7.1. Asia Pacific healthcare digital twins market, 2018 - 2030 (USD Million)
- 7.7.2. Japan
- 7.7.2.1. Japan healthcare digital twins market, 2018 - 2030 (USD Million)
- 7.7.3. China
- 7.7.3.1. China healthcare digital twins market, 2018 - 2030 (USD Million)
- 7.7.4. India
- 7.7.4.1. India healthcare digital twins market, 2018 - 2030 (USD Million)
- 7.7.5. Australia
- 7.7.5.1. Australia healthcare digital twins market, 2018 - 2030 (USD Million)
- 7.7.6. South Korea
- 7.7.6.1. South Korea healthcare digital twins market, 2018 - 2030 (USD Million)
- 7.7.7. Thailand
- 7.7.7.1. Thailand healthcare digital twins market, 2018 - 2030 (USD Million)
- 7.8. Latin America
- 7.8.1. Latin America healthcare digital twins market, 2018 - 2030 (USD Million)
- 7.8.2. Brazil
- 7.8.2.1. Brazil healthcare digital twins market, 2018 - 2030 (USD Million)
- 7.8.3. Argentina
- 7.8.3.1. Argentina healthcare digital twins market, 2018 - 2030 (USD Million)
- 7.9. MEA
- 7.9.1. MEA healthcare digital twins market, 2018 - 2030 (USD Million)
- 7.9.2. South Africa
- 7.9.2.1. South Africa healthcare digital twins market, 2018 - 2030 (USD Million)
- 7.9.3. Saudi Arabia
- 7.9.3.1. Saudi Arabia healthcare digital twins market, 2018 - 2030 (USD Million)
- 7.9.4. UAE
- 7.9.4.1. UAE healthcare digital twins market, 2018 - 2030 (USD Million)
- 7.9.5. Kuwait
- 7.9.5.1. Kuwait healthcare digital twins market, 2018 - 2030 (USD Million)
Chapter 8. Competitive Landscape
- 8.1. Recent Developments & Impact Analysis, By Key Market Participants
- 8.2. Company Categorization
- 8.3. Company Profiles
- 8.3.1. Atos
- 8.3.1.1. Company overview
- 8.3.1.2. Financial performance
- 8.3.1.3. Product benchmarking
- 8.3.1.4. Strategic initiatives
- 8.3.2. Microsoft
- 8.3.2.1. Company overview
- 8.3.2.2. Financial performance
- 8.3.2.3. Product benchmarking
- 8.3.2.4. Strategic initiatives
- 8.3.3. Philips Healthcare
- 8.3.3.1. Company overview
- 8.3.3.2. Financial performance
- 8.3.3.3. Product benchmarking
- 8.3.3.4. Strategic initiatives
- 8.3.4. PrediSurge
- 8.3.4.1. Company overview
- 8.3.4.2. Financial performance
- 8.3.4.3. Product benchmarking
- 8.3.4.4. Strategic initiatives
- 8.3.5. Unlearn AI
- 8.3.5.1. Company overview
- 8.3.5.2. Financial performance
- 8.3.5.3. Product benchmarking
- 8.3.5.4. Strategic initiatives
- 8.3.6. QiO Technologies
- 8.3.6.1. Company overview
- 8.3.6.2. Financial performance
- 8.3.6.3. Product benchmarking
- 8.3.6.4. Strategic initiatives
- 8.3.7. Verto Healthcare
- 8.3.7.1. Company overview
- 8.3.7.2. Financial performance
- 8.3.7.3. Product benchmarking
- 8.3.7.4. Strategic initiatives
- 8.3.8. Dassault Systems (3DS System)
- 8.3.8.1. Company overview
- 8.3.8.2. Financial performance
- 8.3.8.3. Product benchmarking
- 8.3.8.4. Strategic initiatives
- 8.3.9. ThoughWire
- 8.3.9.1. Company overview
- 8.3.9.2. Financial performance
- 8.3.9.3. Product benchmarking
- 8.3.9.4. Strategic initiatives
- 8.3.10. Faststream Technologies
- 8.3.10.1. Company overview
- 8.3.10.2. Financial performance
- 8.3.10.3. Product benchmarking
- 8.3.10.4. Strategic initiatives
- 8.3.11. Twin Health.
- 8.3.11.1. Company overview
- 8.3.11.2. Financial performance
- 8.3.11.3. Product benchmarking
- 8.3.11.4. Strategic initiatives
- 8.3.1. Atos

