|
|
市場調査レポート
商品コード
1321460
クラフトソーダの市場規模、シェア、動向分析レポート:フレーバー別、パッケージ別、流通チャネル別、地域別、セグメント予測:2023年~2030年Craft Soda Market Size, Share & Trends Analysis Report By Flavor (Cola, Tropical Fruits, Berries), By Packaging (Glass, Cans, Plastic), By Distribution Channel (On-trade, Off-trade), By Region, And Segment Forecasts, 2023 - 2030 |
||||||
|
|
|||||||
カスタマイズ可能
|
|||||||


| クラフトソーダの市場規模、シェア、動向分析レポート:フレーバー別、パッケージ別、流通チャネル別、地域別、セグメント予測:2023年~2030年 |
|
出版日: 2023年07月31日
発行: Grand View Research
ページ情報: 英文 80 Pages
納期: 2~10営業日
|

- 全表示
- 概要
- 図表
- 目次
クラフトソーダ市場の成長と動向
Grand View Research, Inc.の最新レポートによると、世界のクラフトソーダ市場規模は2030年に10億1,180万米ドルに達すると予測され、2023年から2030年にかけてCAGR 5.1%で拡大すると予測されています。
アルコール飲料だけでなく甘い飲料が引き起こす健康問題に対する社会的意識の高まりが、この産業の主要な促進要因の一つです。市場は、人工甘味料を含む炭酸清涼飲料から、自然な甘味を含む低カロリー飲料に軸足を移すことで改革を進めています。クラフトソーダは、特殊ソーダ、少量生産ソーダ、職人技ソーダとしても知られています。その製法と天然成分、ユニークなパッケージ、革新的なフレーバーにより、競争市場シェアを獲得しています。グルメ志向やウェルネス志向の高まりは、クラフト・ソーダの需要増と好相性であると予想されます。
定評あるブランドは、製品ポートフォリオを強化し、革新的なマーケティング戦略を打ち出して、ブランドに対する消費者の関心を高め、牽引力を獲得しています。例えば、2020年5月、テキサス州サンアントニオを拠点とするSouthside Craft Sodaは、顧客向けにGo Local Giveawayを開始しました。コーラ味セグメントは2022年に最大の売上シェアを占めました。新製品の発売は、このセグメントの成長にとって好材料となりそうです。Jones Soda、Boylan Bottling Co.、Reed's Inc.などの主要民間企業はコーラ味のクラフトソーダを提供しています。しかし、トロピカルフルーツフレーバー分野は予測期間中に最も速い成長率を記録しそうです。2022年に業界をリードしたのは、取引外流通チャネル・セグメントです。
オフトレード流通チャネルの拡大は、消費者がクラフトソーダを容易に入手できることにつながっており、これがセグメントの成長を増大させる主な要因となっています。スーパーマーケットとハイパーマーケットは、その大規模な流通網、のれん、巨大な顧客基盤を理由に、クラフトソーダブランドの主要流通チャネルとして浮上しました。アジア太平洋地域は、予測期間中に最も速いCAGRを記録しそうです。インド、中国、日本、韓国のような国々で、様々なeコマースチャネルや企業のウェブサイトを通じて、地域のクラフトブランドによる製品発売が増加していることが、この地域におけるクラフトソーダの成長傾向を促進する主な要因となっています。主要プレーヤーは互いに激しい競争に直面しています。また、多くの小規模プレーヤーの存在も競争の激化につながっています。
クラフトソーダ市場レポートハイライト
- トロピカルフルーツフレーバー分野は、飲料におけるフルーティーフレーバーの需要拡大により、2023年から2030年にかけて最も速いCAGRで拡大する見込み。
- ガラス包装分野は、利便性の高さとガラス瓶の革新的なデザインにより、2023年から2030年にかけて最も速いCAGRで拡大すると予測されます。
- 商外流通チャネルセグメントは2022年に業界をリードし、予測期間中に最速の成長率を記録すると予想されます。
- アジア太平洋地域は、より健康的な飲料オプションへの消費者の傾倒により、2023年から2030年にかけて最大のCAGRを記録すると予想されます。
目次
第1章 調査手法と範囲
- 市場セグメンテーションと範囲
- 市場の定義
- 情報調達
- 情報分析
- 市場の形成とデータの視覚化
- データの検証と公開
第2章 エグゼクティブサマリー
第3章 クラフトソーダ市場の変数、動向、範囲
- 市場系統の見通し
- 業界のバリューチェーン分析
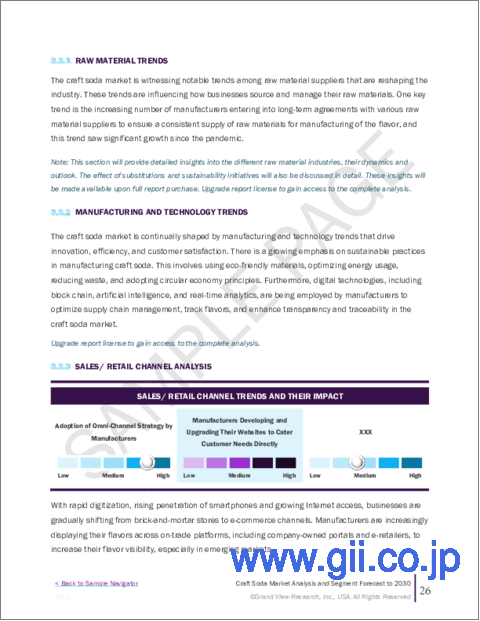
- 販売/小売チャネル分析
- 利益率分析
- 市場力学
- 市場促進要因の分析
- 市場抑制要因分析
- 業界の課題
- 業界のチャンス
- 業界分析- ポーターのファイブフォース分析
- 市場参入戦略
第4章 消費者行動分析
- 人口動態分析
- 消費者の動向と好み
- 購入決定に影響を与える要因
- 消費者向け製品の採用
- 所見と推奨事項
第5章 クラフトソーダ市場:フレーバー別の推定・動向分析
- 変動分析と市場シェア、2022年と2030年
- コーラ
- トロピカルフルーツ
- ベリー類
- その他
第6章 クラフトソーダ市場:パッケージ別の推定・動向分析
- 変動分析と市場シェア、2022年と2030年
- ガラス
- 缶
- プラスチック
- その他
第7章 クラフトソーダ市場:流通チャネル別の推定・動向分析
- 変動分析と市場シェア、2022年と2030年
- オントレード
- オフトレード
第8章 クラフトソーダ市場:地域別の推定・動向分析
- 変動分析と市場シェア、2022年と2030年
- 北米
- 市場推計・予測、2017~2030年
- フレーバー別、2017~2030年
- パッケージ別、2017~2030年
- 流通チャネル別、2017~2030年
- 米国
- カナダ
- メキシコ
- 欧州
- 市場推計・予測、2017~2030年
- フレーバー別、2017~2030年
- パッケージ別、2017~2030年
- 流通チャネル別、2017~2030年
- 英国
- ドイツ
- フランス
- イタリア
- スペイン
- アジア太平洋地域
- 中国
- インド
- 日本
- 韓国
- オーストラリア
- 中南米
- 市場推計・予測、2017~2030年
- フレーバー別、2017~2030年
- パッケージ別、2017~2030年
- 流通チャネル別、2017~2030年
- ブラジル
- 中東とアフリカ
- 市場推計・予測、2017~2030年
- フレーバー別、2017~2030年
- パッケージ別、2017~2030年
- 流通チャネル別、2017~2030年
- 南アフリカ
第9章 企業プロファイル
- 主要市場参入企業による最近の動向と影響分析
- 企業の分類
- 参入企業の概要
- 財務実績
- 製品のベンチマーク
- 企業の市場シェア分析、2022年(%)
- 企業ヒートマップ分析
- 戦略マッピング
- このセクションで分析される主要企業のリストは次のとおりです。
- Jones Soda Co.
- Appalachian Brewing Co.
- Reed's Inc.
- PepsiCo, Inc.
- The Original Craft Soda Company
- The Coca-Cola Company
- Crooked Beverage Co.
- SIPP eco beverage co. Inc.
- Boylan Bottling Co.
- Wild Poppy Company
List of Tables
- Table 1 Craft soda market - Key Market Driver Analysis
- Table 2 Craft soda market - Key Market Restraint Analysis
- Table 3 Craft soda market estimates & forecast, by product (USD Million)
- Table 4 Craft soda market estimates & forecast, by packaging (USD Million)
- Table 5 Craft soda market estimates & forecast, by distribution channel (USD Million)
- Table 6 US macro - economic outlay
- Table 7 Canada macro - economic outlay
- Table 8 Mexico macro - economic outlay
- Table 9 Germany macro - economic outlay
- Table 10 U.K. macro - economic outlay
- Table 11 France macro - economic outlay
- Table 12 Italy macro - economic outlay
- Table 13 Spain macro - economic outlay
- Table 14 China macro - economic outlay
- Table 15 India macro - economic outlay
- Table 16 Japan macro - economic outlay
- Table 17 Australia macro - economic outlay
- Table 18 South Korea macro - economic outlay
- Table 19 Brazil macro - economic outlay
- Table 20 South Africa macro - economic outlay
- Table 21 Recent developments & impact analysis, by key market participants
- Table 22 Company market share, 2022
- Table 23 Company heat map analysis
List of Figures
- Fig. 1 Craft soda market segmentation
- Fig. 2 Information procurement
- Fig. 3 Primary research pattern
- Fig. 4 Primary research approaches
- Fig. 5 Primary research process
- Fig. 6 Market snapshot
- Fig. 7 Segment snapshot
- Fig. 8 Competitive landscape Snapshot
- Fig. 9 Global craft soda market size, 2017 to 2030 (USD Million)
- Fig. 10 Craft soda market: Value chain analysis
- Fig. 11 Craft soda market: Profit-margin analysis
- Fig. 12 Craft soda market: Dynamics
- Fig. 13 Craft soda market: Porter's five forces analysis
- Fig. 14 Factors influencing buying decisions for plant - based beverages products
- Fig. 15 Craft soda market, by type: Key takeaways
- Fig. 16 Craft soda market, by type: Market share, 2022 & 2030
- Fig. 17 Cola craft soda market estimates & forecasts, 2017 - 2030 (USD Million)
- Fig. 18 Tropical fruits craft soda market estimates & forecasts, 2017 - 2030 (USD Million)
- Fig. 19 Almond beverages market estimates & forecasts, 2017 - 2030 (USD Million)
- Fig. 20 Craft soda market, by product: Key takeaways
- Fig. 21 Craft soda market, by product: Market share, 2022 & 2030
- Fig. 22 Plain plant - based beverages market estimates & forecasts, 2017 - 2030 (USD Million)
- Fig. 23 Flavored plant - based beverages market estimates & forecasts, 2017 - 2030 (USD Million)
- Fig. 24 Craft soda market revenue, by region, 2022 & 2030 (USD Million)
- Fig. 25 Regional marketplace: Key takeaways
- Fig. 26 North America plant - based beverages products market estimates & forecast, 2017 - 2030 (USD Million)
- Fig. 27 US plant - based beverages products market estimates & forecast, 2017 - 2030 (USD Million)
- Fig. 28 Canada plant - based beverages products market estimates & forecast, 2017 - 2030 (USD Million)
- Fig. 29 Mexico plant - based beverages products market estimates & forecast, 2017 - 2030 (USD Million)
- Fig. 30 Europe plant - based beverages products market estimates & forecast, 2017 - 2030 (USD Million)
- Fig. 31 Germany plant - based beverages products market estimates & forecast, 2017 - 2030 (USD Million)
- Fig. 32 UK plant - based beverages products market estimates & forecast, 2017 - 2030 (USD Million)
- Fig. 33 France plant - based beverages products market estimates & forecast, 2017 - 2030 (USD Million)
- Fig. 34 Italy plant - based beverages products market estimates & forecast, 2017 - 2030 (USD Million)
- Fig. 35 Spain plant - based beverages products market estimates & forecast, 2017 - 2030 (USD Million)
- Fig. 36 Asia Pacific plant - based beverages products market estimates & forecast, 2017 - 2030 (USD Million)
- Fig. 37 China plant - based beverages products market estimates & forecast, 2017 - 2030 (USD Million)
- Fig. 38 India plant - based beverages products market estimates & forecast, 2017 - 2030 (USD Million)
- Fig. 39 Japan plant - based beverages products market estimates & forecast, 2017 - 2030 (USD Million)
- Fig. 40 South Korea plant - based beverages products market estimates & forecast, 2017 - 2030 (USD Million)
- Fig. 41 Australia plant - based beverages products market estimates & forecast, 2017 - 2030 (USD Million)
- Fig. 42 Middle East & Africa plant - based beverages products market estimates & forecast, 2017 - 2030 (USD Million)
- Fig. 43 South Africa plant - based beverages products market estimates & forecast, 2017 - 2030 (USD Million)
- Fig. 44 Central and South America plant - based beverages products market estimates & forecast, 2017 - 2030 (USD Million)
- Fig. 45 Brazil plant - based beverages products market estimates & forecast, 2017 - 2030 (USD Million)
- Fig. 46 Company market share analysis, 2022
- Fig. 47 Strategic framework of plant - based beverages products market
Craft Soda Market Growth & Trends
The global craft soda market size is expected to reach USD 1,011.8 million in 2030 and is projected to expand at a CAGR of 5.1% from 2023 to 2030, according to a new report by Grand View Research, Inc. Increasing social awareness about the health problems caused by sugary as well as alcoholic drinks is one of the major drivers of this industry. The market is reforming itself by shifting its alignment from carbonated soft drinks containing artificial sweeteners to natural, sweet-laden, low-calorie beverages. Craft sodas are also known as a specialty, small-batch, or artisanal sodas. It is gaining a competitive market share owing to its formulation and natural ingredients, unique packaging, and innovative flavors. The rising trend of gourmet food, as well as wellness food, is expected to bode well with the growing demand for craft sodas.
Established brands have been enhancing their product portfolios and launching innovative marketing strategies to gain traction and increase consumer engagement with the brand. For instance, in May 2020, San Antonio, Texas-based Southside Craft Soda launched a Go Local Giveaway for its customers. The cola-flavored segment held the largest revenue share in 2022. New product launches are likely to bode well with the segment growth. Top private players including Jones Soda, Boylan Bottling Co., and Reed's Inc. offer cola-flavored craft soda. However, the tropical fruit flavors segment is likely to register the fastest growth rate during the forecast period. The off-trade distribution channel segment led the industry in 2022.
The broadening of off-trade distribution channels has led to the easy availability of craft sodas to consumers, which is the primary driver augmenting segment growth. Supermarkets & hypermarkets emerged as the key distribution channel for craft soda brands on account of their large distribution network, goodwill, and huge customer base. Asia Pacific is likely to register the fastest CAGR during the forecast period. Increasing product launches by regional craft brands in countries, such as India, China, Japan, and South Korea, through various e-commerce channels and company websites, are the key factors promoting the growing trend of craft soda in the region. Key players face intense competition from each other, as some of them operate at several locations and have large customer bases. The presence of many small-scale players is also leading to increased competition.
Craft Soda Market Report Highlights
- The tropical fruits flavor segment is expected to expand at the fastest CAGR from 2023 to 2030 due to the growing demand for fruity flavors in beverages
- The glass packaging segment is expected to expand at the fastest CAGR from 2023 to 2030 owing to the convenience offered and the innovative design of glass bottles
- The off-trade distribution channel segment led the industry in 2022 and is expected to register the fastest growth rate during the forecast period
- The Asia Pacific region is expected to witness the maximum CAGR from 2023 to 2030 due to the inclination of consumers toward healthier beverage options
Table of Contents
Chapter 1. Methodology and Scope
- 1.1. Market Segmentation & Scope
- 1.2. Market Definition
- 1.3. Information Procurement
- 1.3.1. Purchased Database
- 1.3.2. GVR's Internal Database
- 1.3.3. Secondary Sources & Third - Party Perspectives
- 1.3.4. Primary Research
- 1.4. Information Analysis
- 1.4.1. Data Analysis Models
- 1.5. Market Formulation & Data Visualization
- 1.6. Data Validation & Publishing
Chapter 2. Executive Summary
- 2.1. Market Outlook
- 2.2. Flavor Outlook
- 2.3. Packaging Outlook
- 2.4. Distribution Channel Outlook
- 2.5. Regional Outlook
Chapter 3. Craft Soda Market Variables, Trends & Scope
- 3.1. Market Lineage Outlook
- 3.2. Industry Value Chain Analysis
- 3.2.1. Sales/Retail Channel Analysis
- 3.2.2. Profit Margin Analysis
- 3.3. Market Dynamics
- 3.3.1. Market Driver Analysis
- 3.3.2. Market Restraint Analysis
- 3.3.3. Industry Challenges
- 3.3.4. Industry Opportunities
- 3.3.5. Industry Analysis - Porter's Five Force Analysis
- 3.4. Market Entry Strategies
Chapter 4. Consumer Behavior Analysis
- 4.1. Demographic Analysis
- 4.2. Consumer Trends and Preferences
- 4.3. Factors Affecting Buying Decision
- 4.4. Consumer Product Adoption
- 4.5. Observations & Recommendations
Chapter 5. Craft Soda Market: Flavor Estimates & Trend Analysis
- 5.1. Flavor Movement Analysis & Market Share, 2022 & 2030
- 5.2. Cola
- 5.2.1. Cola craft soda market estimates and forecast, 2017 - 2030 (USD Million)
- 5.3. Tropical Fruits
- 5.3.1. Tropical fruits craft soda market estimates and forecast, 2017 - 2030 (USD Million)
- 5.4. Berries
- 5.4.1. Berries craft soda market estimates and forecast, 2017 - 2030 (USD Million)
- 5.5. Others
- 5.5.1. Other flavored craft soda market estimates and forecast, 2017 - 2030 (USD Million)
Chapter 6. Craft Soda Market: Packaging Estimates & Trend Analysis
- 6.1. Packaging Movement Analysis & Market Share, 2022 & 2030
- 6.2. Glass
- 6.2.1. Glass craft soda packaging market estimates and forecast, 2017 - 2030 (USD Million)
- 6.3. Cans
- 6.3.1. Canned craft soda packaging market estimates and forecast, 2017 - 2030 (USD Million)
- 6.4. Plastic
- 6.4.1. Plastic craft soda packaging market estimates and forecast, 2017 - 2030 (USD Million)
- 6.5. Others
- 6.5.1. Other craft soda packaging market estimates and forecast, 2017 - 2030 (USD Million)
Chapter 7. Craft Soda Market: Distribution Channel Estimates & Trend Analysis
- 7.1. Distribution Channel Movement Analysis & Market Share, 2022 & 2030
- 7.2. On-Trade
- 7.2.1. Market estimates and forecast, through on-trade, 2017 - 2030 (USD Million)
- 7.3. Off-Trade
- 7.3.1. Market estimates and forecast, through off-trade, 2017 - 2030 (USD Million)
Chapter 8. Craft Soda Market: Regional Estimates & Trend Analysis
- 8.1. Regional Movement Analysis & Market Share, 2022 & 2030
- 8.2. Regional Movement Analysis & Market Share, 2022 & 2030
- 8.3. North America
- 8.3.1. Market estimates and forecast, 2017 - 2030 (USD Million)
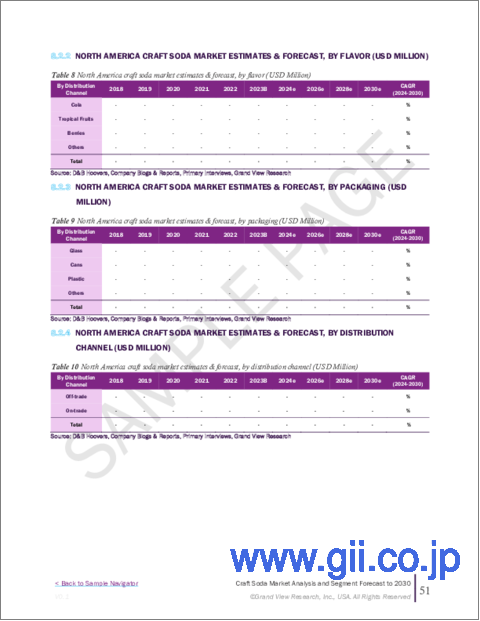
- 8.3.2. Market estimates and forecast, by flavor, 2017 - 2030 (USD Million)
- 8.3.3. Market estimates and forecast, by packaging, 2017 - 2030 (USD Million)
- 8.3.4. Market estimates and forecast, by distribution channel, 2017 - 2030 (USD Million)
- 8.3.5. U.S.
- 8.3.5.1. Market estimates and forecast, 2017 - 2030 (USD Million)
- 8.3.5.2. Market estimates and forecast, by flavor, 2017 - 2030 (USD Million)
- 8.3.5.3. Market estimates and forecast, by packaging, 2017 - 2030 (USD Million)
- 8.3.5.4. Market estimates and forecast, by distribution channel, 2017 - 2030 (USD Million)
- 8.3.6. Canada
- 8.3.6.1. Market estimates and forecast, 2017 - 2030 (USD Million)
- 8.3.6.2. Market estimates and forecast, by flavor, 2017 - 2030 (USD Million)
- 8.3.6.3. Market estimates and forecast, by packaging, 2017 - 2030 (USD Million)
- 8.3.6.4. Market estimates and forecast, by distribution channel, 2017 - 2030 (USD Million)
- 8.3.7. Mexico
- 8.3.7.1. Market estimates and forecast, 2017 - 2030 (USD Million)
- 8.3.7.2. Market estimates and forecast, by flavor, 2017 - 2030 (USD Million)
- 8.3.7.3. Market estimates and forecast, by packaging, 2017 - 2030 (USD Million)
- 8.3.7.4. Market estimates and forecast, by distribution channel, 2017 - 2030 (USD Million)
- 8.4. Europe
- 8.4.1. Market estimates and forecast, 2017 - 2030 (USD Million)
- 8.4.2. Market estimates and forecast, by flavor, 2017 - 2030 (USD Million)
- 8.4.3. Market estimates and forecast, by packaging, 2017 - 2030 (USD Million)
- 8.4.4. Market estimates and forecast, by distribution channel, 2017 - 2030 (USD Million)
- 8.4.2. U.K.
- 8.4.2.1. Market estimates and forecast, 2017 - 2030 (USD Million)
- 8.4.2.2. Market estimates and forecast, by flavor, 2017 - 2030 (USD Million)
- 8.4.2.3. Market estimates and forecast, by packaging, 2017 - 2030 (USD Million)
- 8.4.2.4. Market estimates and forecast, by distribution channel, 2017 - 2030 (USD Million)
- 8.4.3. Germany
- 8.4.3.1. Market estimates and forecast, 2017 - 2030 (USD Million)
- 8.4.3.2. Market estimates and forecast, by flavor, 2017 - 2030 (USD Million)
- 8.4.3.3. Market estimates and forecast, by packaging, 2017 - 2030 (USD Million)
- 8.4.3.4. Market estimates and forecast, by distribution channel, 2017 - 2030 (USD Million)
- 8.4.4. France
- 8.4.4.1. Market estimates and forecast, 2017 - 2030 (USD Million)
- 8.4.4.2. Market estimates and forecast, by flavor, 2017 - 2030 (USD Million)
- 8.4.4.3. Market estimates and forecast, by packaging, 2017 - 2030 (USD Million)
- 8.4.4.4. Market estimates and forecast, by distribution channel, 2017 - 2030 (USD Million)
- 8.4.5. Italy
- 8.4.5.1. Market estimates and forecast, 2017 - 2030 (USD Million)
- 8.4.5.2. Market estimates and forecast, by flavor, 2017 - 2030 (USD Million)
- 8.4.5.3. Market estimates and forecast, by packaging, 2017 - 2030 (USD Million)
- 8.4.5.4. Market estimates and forecast, by distribution channel, 2017 - 2030 (USD Million)
- 8.4.6. Spain
- 8.4.6.1. Market estimates and forecast, 2017 - 2030 (USD Million)
- 8.4.6.2. Market estimates and forecast, by flavor, 2017 - 2030 (USD Million)
- 8.4.6.3. Market estimates and forecast, by packaging, 2017 - 2030 (USD Million)
- 8.4.6.4. Market estimates and forecast, by distribution channel, 2017 - 2030 (USD Million)
- 8.5. Asia Pacific
- 8.5.1.1. Market estimates and forecast, 2017 - 2030 (USD Million)
- 8.5.1.2. Market estimates and forecast, by flavor, 2017 - 2030 (USD Million)
- 8.5.1.3. Market estimates and forecast, by packaging, 2017 - 2030 (USD Million)
- 8.5.1.4. Market estimates and forecast, by distribution channel, 2017 - 2030 (USD Million)
- 8.5.2. China
- 8.5.2.1. Market estimates and forecast, 2017 - 2030 (USD Million)
- 8.5.2.2. Market estimates and forecast, by flavor, 2017 - 2030 (USD Million)
- 8.5.2.3. Market estimates and forecast, by packaging, 2017 - 2030 (USD Million)
- 8.5.2.4. Market estimates and forecast, by distribution channel, 2017 - 2030 (USD Million)
- 8.5.3. India
- 8.5.3.1. Market estimates and forecast, 2017 - 2030 (USD Million)
- 8.5.3.2. Market estimates and forecast, by flavor, 2017 - 2030 (USD Million)
- 8.5.3.3. Market estimates and forecast, by packaging, 2017 - 2030 (USD Million)
- 8.5.3.4. Market estimates and forecast, by distribution channel, 2017 - 2030 (USD Million)
- 8.5.4. Japan
- 8.5.4.1. Market estimates and forecast, 2017 - 2030 (USD Million)
- 8.5.4.2. Market estimates and forecast, by flavor, 2017 - 2030 (USD Million)
- 8.5.4.3. Market estimates and forecast, by packaging, 2017 - 2030 (USD Million)
- 8.5.4.4. Market estimates and forecast, by distribution channel, 2017 - 2030 (USD Million)
- 8.5.5. South Korea
- 8.5.5.1. Market estimates and forecast, 2017 - 2030 (USD Million)
- 8.5.5.2. Market estimates and forecast, by flavor, 2017 - 2030 (USD Million)
- 8.5.5.3. Market estimates and forecast, by packaging, 2017 - 2030 (USD Million)
- 8.5.5.4. Market estimates and forecast, by distribution channel, 2017 - 2030 (USD Million)
- 8.5.6. Australia
- 8.5.6.1. Market estimates and forecast, 2017 - 2030 (USD Million)
- 8.5.6.2. Market estimates and forecast, by flavor, 2017 - 2030 (USD Million)
- 8.5.6.3. Market estimates and forecast, by packaging, 2017 - 2030 (USD Million)
- 8.5.6.4. Market estimates and forecast, by distribution channel, 2017 - 2030 (USD Million)
- 8.6. Central & South America
- 8.6.1. Market estimates and forecast, 2017 - 2030 (USD Million)
- 8.6.2. Market estimates and forecast, by flavor, 2017 - 2030 (USD Million)
- 8.6.3. Market estimates and forecast, by packaging, 2017 - 2030 (USD Million)
- 8.6.4. Market estimates and forecast, by distribution channel, 2017 - 2030 (USD Million)
- 8.6.5. Brazil
- 8.6.5.1. Market estimates and forecast, 2017 - 2030 (USD Million)
- 8.6.5.2. Market estimates and forecast, by flavor, 2017 - 2030 (USD Million)
- 8.6.5.3. Market estimates and forecast, by packaging, 2017 - 2030 (USD Million)
- 8.6.5.4. Market estimates and forecast, by distribution channel, 2017 - 2030 (USD Million)
- 8.7. Middle East & Africa
- 8.7.1. Market estimates and forecast, 2017 - 2030 (USD Million)
- 8.7.2. Market estimates and forecast, by flavor, 2017 - 2030 (USD Million)
- 8.7.3. Market estimates and forecast, by packaging, 2017 - 2030 (USD Million)
- 8.7.4. Market estimates and forecast, by distribution channel, 2017 - 2030 (USD Million)
- 8.7.5. South Africa
- 8.7.5.1. Market estimates and forecast, 2017 - 2030 (USD Million)
- 8.7.5.2. Market estimates and forecast, by flavor, 2017 - 2030 (USD Million)
- 8.7.5.3. Market estimates and forecast, by packaging, 2017 - 2030 (USD Million)
- 8.7.5.4. Market estimates and forecast, by distribution channel, 2017 - 2030 (USD Million)
Chapter 9. Company Profiles
- 9.1. Recent developments & impact analysis, by key market participants
- 9.2. Company Categorization
- 9.3. Participant's Overview
- 9.4. Financial Performance
- 9.5. Product Benchmarking
- 9.6. Company Market Share Analysis, 2022 (%)
- 9.7. Company Heat Map Analysis
- 9.8. Strategy Mapping
- 9.9. List of key companies analyzed in this section include:
- 9.9.1. Jones Soda Co.
- 9.9.2. Appalachian Brewing Co.
- 9.9.3. Reed's Inc.
- 9.9.4. PepsiCo, Inc.
- 9.9.5. The Original Craft Soda Company
- 9.9.6. The Coca-Cola Company
- 9.9.7. Crooked Beverage Co.
- 9.9.8. SIPP eco beverage co. Inc.
- 9.9.9. Boylan Bottling Co.
- 9.9.10. Wild Poppy Company
