|
|
市場調査レポート
商品コード
1321446
モバイルアクセサリーの市場規模、シェア、動向分析レポート:製品別、流通チャネル別、地域別、セグメント予測:2023年~2030年Mobile Accessories Market Size, Share & Trend Analysis Report By Product (Headphone, Charger, Power Bank, Protective Case, Others), By Distribution Channel (Online, Offline), By Region, And Segment Forecasts, 2023 - 2030 |
||||||
|
|
|||||||
カスタマイズ可能
|
|||||||


| モバイルアクセサリーの市場規模、シェア、動向分析レポート:製品別、流通チャネル別、地域別、セグメント予測:2023年~2030年 |
|
出版日: 2023年07月28日
発行: Grand View Research
ページ情報: 英文 80 Pages
納期: 2~10営業日
|

- 全表示
- 概要
- 図表
- 目次
モバイルアクセサリー市場の成長と動向
Grand View Research, Inc.の最新レポートによると、世界のモバイルアクセサリー市場規模は2023年から2030年にかけてCAGR 6.8%で拡大し、2030年には1,488億1,000万米ドルに達すると予測されています。
スマートフォンは世界中で有効な通信手段であるため、需要の増加が予測期間の市場を牽引すると見られています。また、無線機器に対する需要の増加と、技術の頻繁な変化が相まって、近い将来の市場を牽引しています。例えば、企業はワイヤレスヘッドセットやスピーカーなどの最新技術を打ち出しています。これが、最近の業界の市場需要を押し上げています。さらに、ティーンエイジャーの間でスマートフォンの普及が進んでいることから、市場の変化する技術に対応するため、モバイルカバーやヘッドフォンなど特定のアクセサリーの需要が高まっています。
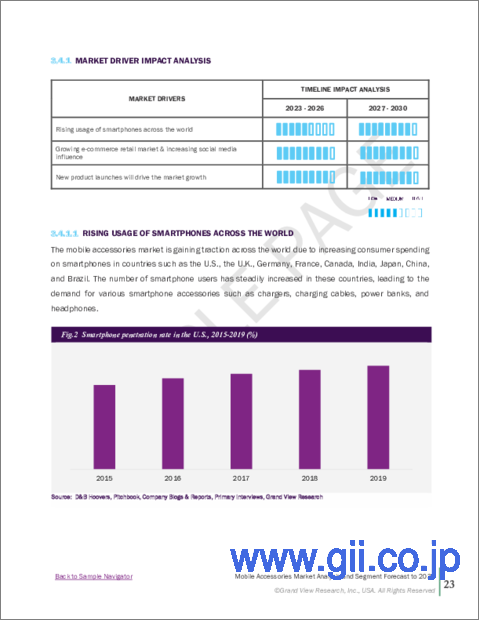
モバイルアクセサリー市場は、世界レベルでの携帯電話普及率の上昇により成長しています。sell cellが発表したレポートによると、2021年の世界の携帯電話販売台数は17億4,880万台に達し、これは2021年に世界人口の22.2%が携帯電話を購入したことを意味します。世界市場の成長を促進する要因としては、IoTやAI技術の採用の増加、音声認識システム、ワイヤレスオーディオデバイス、クリップ式ヘッドフォン、音声認識ソフトウェアの精密な統合などの最先端技術の進歩が挙げられます。世界のモバイルアクセサリー市場の競争は激化しているため、メーカーは高ビデオ解像度、セルフィー、ゲームなど、製品ラインの革新的な機能や技術に注力しています。これらの機能はすべて、パワーバンク、イヤホン、ヘッドホンなどの需要を生み出しています。
COVID-19の期間中、世界の多くの地域でロックダウンが実施され、人々は自宅待機や行動制限を余儀なくされました。また、パンデミック中は学校が閉鎖され、携帯電話を使用する人々の行動にも変化が見られました。多くの授業や活動がオンラインで行われました。普通の携帯電話を持っていた人々がスマートフォンに機種変更しました。スマートフォンの普及に伴い、デジタルアプリの使用もユーザーの間で一般的になっています。例えば、sell cellが発表したレポートによると、2021年には2020年と比較して1510.3台のスマートフォンが販売されます。2021年には1億1,300万人が携帯電話を更新しています。しかし、人々が通常の生活を取り戻すにつれて、市場はやがてパンデミック以前の状況に戻っていくと予想されます。この動向は予測期間中プラスに働くと予想されます。
オフライン・セグメントが市場シェアをリードしており、予測期間中も需要の漸進的な伸びが見込まれます。オフライン・セグメントは市場全体の売上高の69.0%以上を占めるトップシェアであり、近い将来大きな成長が見込まれます。スマートウォッチのような高価なデバイスやモバイルカメラレンズの需要の増加、壊れやすいアイテムの配送に対する問題意識が、このセグメントの成長を促進する要因となっています。伝統的な買い物の方法と、地元の小売店やその他の卸売市場での価格差が、このセグメントの成長の理由です。
ヘッドフォン分野は、予測期間中にCAGR 7.3%を記録すると予想されます。現在、モバイル業界で最も発展している動向の1つは、ヘッドフォンの高機能化が進んでいることです。また、タイプCのUSBポートケーブルのような無条件コネクタの市場成長にも拍車をかけています。若年層におけるフィットネス意識の高まりが、最近のスポーツ・フィットネス用ヘッドフォン需要を牽引しています。単体での旅行動向の高まりにより、経済的な消費者層の間で安価なヘッドホンの人気が高まっています。
2022年には、アジア太平洋地域が約46.5%の市場シェアでリードし、近い将来大きなCAGRで成長すると予想されています。アジア太平洋では、中国がシェアの大半を占め、2022年の全体売上高の55.2%を占めました。欧州は第2位のセグメントで、2021年の市場シェアは約21.0%です。西欧は、ドイツや英国などの国々における高い購買力と流行に敏感な消費者のため、欧州では支配的なセグメントです。
市場には多くの非構造化ディーラーが存在するため、参入障壁は中程度から低いです。さらに、技術革新、M&A、合弁事業が市場を牽引しています。また、この業界では技術の変化が頻繁に起こるため、企業は収益の大部分を研究開発に費やしています。競争優位に立つためには、市場参入企業は消費者の製品ニーズを理解する必要があります。
モバイルアクセサリー市場レポートハイライト
- 2023年から2030年にかけて、オンラインセグメントが最も速いCAGRを達成すると予想されます。同分野の成長は、地方におけるインターネット普及率の上昇が同分野の成長を促進すると予測されるためです。
- ヘッドフォン分野は、2023年から2030年にかけて最も速いCAGRを達成する見込みです。若年層におけるフィットネス意識の高まりが、最近のスポーツ・フィットネス用ヘッドフォン需要を牽引しており、同分野の成長を促進すると予測されます。
- アジア太平洋地域は約46.5%の市場シェアでリードしており、近い将来大きなCAGRが見込まれます。アジア太平洋では、中国がシェアの大半を占め、2022年の全体売上高の55.2%を占めました。
目次
第1章 調査手法と範囲
- 市場セグメンテーションと範囲
- 市場の定義
- 情報調達
- 情報分析
- 市場形成とデータの可視化
- データの検証と公開
第2章 エグゼクティブサマリー
第3章 モバイルアクセサリー市場の変数、動向、範囲
- 市場系統の見通し
- 業界のバリューチェーン分析
- 原材料の見通し
- 製造と技術の展望
- 利益率分析
- 市場力学
- 市場促進要因の分析
- 市場抑制要因分析
- 市場機会
- 市場の課題
- 業界分析- ポーターのファイブフォース分析
- 市場参入戦略
第4章 消費者行動分析
- 人口動向分析
- 消費者の動向と好み
- 購入決定に影響を与える要因
- 消費者向け製品の採用
- 主な観察と調査結果
第5章 モバイルアクセサリー市場:製品タイプの推定・動向分析
- 製品タイプの変動分析と市場シェア、2022年と2030年
- ヘッドホン
- 充電器
- パワー・バンク
- 保護ケース
- その他
- その他のモバイルアクセサリー市場推計・予測、2017~2030年
第6章 モバイルアクセサリー市場:流通チャネルの推定・動向分析
- 流通チャネルの変動分析と市場シェア、2022年と2030年
- オンライン
- オフライン
第7章 モバイルアクセサリー市場:地域別推定・動向分析
- 地域別の変動分析と市場シェア、2022年と2030年
- 北米
- 市場推計・予測、2017~2030年
- 製品タイプ別、2017~2030年
- 流通チャネル別、2017~2030年
- 米国
- カナダ
- メキシコ
- 欧州
- 市場推計・予測、2017~2030年
- 製品タイプ別、2017~2030年
- 流通チャネル別、2017~2030年
- 英国
- ドイツ
- フランス
- イタリア
- スペイン
- アジア太平洋地域
- 市場推計・予測、2017~2030年
- 製品タイプ別、2017~2030年
- 流通チャネル別、2017~2030年
- 中国
- 日本
- インド
- 韓国
- オーストラリア
- 中南米
- 市場推計・予測、2017~2030年
- 製品タイプ別、2017~2030年
- 流通チャネル別、2017~2030年
- ブラジル
- 中東とアフリカ
- 市場推計・予測、2017~2030年
- 製品タイプ別、2017~2030年
- 流通チャネル別、2017~2030年
- サウジアラビア
第8章 競合分析
- 主要市場参入企業による最近の動向と影響分析
- 企業の分類
- 参入企業の概要
- 財務実績
- 製品のベンチマーク
- 企業の市場シェア分析、2022年(%)
- 企業ヒートマップ分析
- 戦略マッピング
- 主要企業のリスト
- Belkin International Inc.
- Harman International
- Aukey
- Groovemade
- Anket Innovations
- Samsung
- Apple Inc.
- SanDisk
List of Tables
- Table 1 Mobile Accessories Market - Key Market Driver Analysis
- Table 2 Mobile Accessories Market - Key Market Restraint Analysis
- Table 3 Mobile Accessories market estimates & forecast, by product type (USD Million)
- Table 4 Mobile Accessories market estimates & forecast, by distribution channel (USD Million)
- Table 5 US macro-economic outlay
- Table 6 Canada macro-economic outlay
- Table 7 Mexico macro-economic outlay
- Table 8 Germany macro-economic outlay
- Table 9 UK macro-economic outlay
- Table 10 France macro-economic outlay
- Table 11 Italy macro-economic outlay
- Table 12 Spain macro-economic outlay
- Table 13 China macro-economic outlay
- Table 14 India macro-economic outlay
- Table 15 Japan macro-economic outlay
- Table 16 Australia macro-economic outlay
- Table 17 South Korea macro-economic outlay
- Table 18 Brazil macro-economic outlay
- Table 19 Saudi Arabia macro-economic outlay
- Table 20 Recent developments & impact analysis, by key market participants
- Table 21 Company market share, 2022
- Table 22 Company heat map analysis
List of Figures
- Fig. 1 Mobile accessories market segmentation
- Fig. 2 Information procurement
- Fig. 3 Primary research pattern
- Fig. 4 Primary research approaches
- Fig. 5 Primary research process
- Fig. 6 Market snapshot
- Fig. 7 Segment snapshot
- Fig. 8 Competitive landscape Snapshot
- Fig. 9 Global mobile accessories market size, 2017 to 2030 (USD Million)
- Fig. 10 Mobile accessories market: Value chain analysis
- Fig. 11 Mobile accessories market: Profit-margin analysis
- Fig. 12 Mobile accessories market: Dynamics
- Fig. 13 Mobile accessories market: Porter's five forces analysis
- Fig. 14 Factors influencing buying decisions for mobile accessories
- Fig. 15 Mobile accessories market, by product type: Key takeaways
- Fig. 16 Mobile accessories market, by product type: Market share, 2022 & 2030
- Fig. 17 Headphone mobile accessories market estimates & forecasts, 2017 - 2030 (USD Million)
- Fig. 18 Charger mobile accessories market estimates & forecasts, 2017 - 2030 (USD Million)
- Fig. 19 Power Bank mobile accessories market estimates & forecasts, 2017 - 2030 (USD Million)
- Fig. 20 Protective Case mobile accessories market estimates & forecasts, 2017 - 2030 (USD Million)
- Fig. 21 Others mobile accessories market estimates & forecasts, 2017 - 2030 (USD Million)
- Fig. 22 Mobile accessories market, by distribution channel: Key takeaways
- Fig. 23 Mobile accessories market, by distribution channel: Market share, 2022 & 2030
- Fig. 24 Mobile accessories market estimates & forecasts, through offline channel, 2017 - 2030 (USD Million)
- Fig. 25 Mobile accessories market estimates & forecasts, through online channel, 2017 - 2030 (USD Million)
- Fig. 26 Mobile accessories market revenue, by region, 2022 & 2030, (USD Million)
- Fig. 27 Regional marketplace: Key takeaways
- Fig. 28 North America mobile accessories market estimates & forecast, 2017 - 2030 (USD Million)
- Fig. 29 US mobile accessories market estimates & forecast, 2017 - 2030 (USD Million)
- Fig. 30 Canada mobile accessories market estimates & forecast, 2017 - 2030 (USD Million)
- Fig. 31 Mexico mobile accessories market estimates & forecast, 2017 - 2030 (USD Million)
- Fig. 32 Europe mobile accessories market estimates & forecast, 2017 - 2030 (USD Million)
- Fig. 33 Germany mobile accessories market estimates & forecast, 2017 - 2030 (USD Million)
- Fig. 34 UK mobile accessories market estimates & forecast, 2017 - 2030 (USD Million)
- Fig. 35 France mobile accessories market estimates & forecast, 2017 - 2030 (USD Million)
- Fig. 36 Italy mobile accessories market estimates & forecast, 2017 - 2030 (USD Million)
- Fig. 37 Spain mobile accessories market estimates & forecast, 2017 - 2030 (USD Million)
- Fig. 38 Asia Pacific mobile accessories market estimates & forecast, 2017 - 2030 (USD Million)
- Fig. 39 China mobile accessories market estimates & forecast, 2017 - 2030 (USD Million)
- Fig. 40 India mobile accessories market estimates & forecast, 2017 - 2030 (USD Million)
- Fig. 41 Japan mobile accessories market estimates & forecast, 2017 - 2030 (USD Million)
- Fig. 42 South Korea mobile accessories market estimates & forecast, 2017 - 2030 (USD Million)
- Fig. 43 Australia mobile accessories market estimates & forecast, 2017 - 2030 (USD Million)
- Fig. 44 Middle East & Africa mobile accessories market estimates & forecast, 2017 - 2030 (USD Million)
- Fig. 45 Saudi Arabia mobile accessories market estimates & forecast, 2017 - 2030 (USD Million)
- Fig. 46 Central and South America mobile accessories market estimates & forecast, 2017 - 2030 (USD Million)
- Fig. 47 Brazil mobile accessories market estimates & forecast, 2017 - 2030 (USD Million)
- Fig. 48 Company market share analysis, 2022
- Fig. 49 Strategic framework of mobile accessories market
Mobile Accessories Market Growth & Trends
The global mobile accessories market size is expected to reach USD 148.81 billion by 2030, expanding at a CAGR of 6.8% from 2023 to 2030, according to a new report by Grand View Research, Inc. Increasing demand for smartphones, as they are an effective means of communication around the globe, is expected to drive the market in the forecast period. In addition, increasing demand for wireless devices, coupled with frequent changes in technologies is driving the market in the near future. For instance, companies are coming up with the latest technologies such as wireless headsets and speakers. This has boosted the market demand for the industry in recent times. Furthermore, the increasing adoption of smartphones among teenagers has increased the demand for certain accessories such as mobile covers and headphones as they keep themselves updated with the changing technologies in the market.
The mobile accessories market is growing due to the higher adoption of mobile phones at the global level. According to a report published by sell cell, in 2021 global mobile phone sales reached 1748.8 million, which means 22.2% of the global population purchased a mobile phone in 2021. The factors driving the growth of the global market include increasing adoption of the IoT and AI technologies, as well as cutting-edge technological advancements in voice recognition systems, wireless audio devices, clip-on headphones, and precise integration of speech recognition software. The competition in the global mobile accessories market is increasing thus the manufacturers are focusing on innovative features and technologies in the product line like high video resolution, selfies, games, etc. All these features generate the demand for power banks, earphones, headphones, etc.
During COVID-19, lockdowns were enforced in many regions of the world, and people were forced to stay at home and restrict their activities. In addition, schools were shut down during the pandemic and there was a change in the behavior of people using mobile phones. A lot of classes and activities happened online. People who had normal phones changed their phones to smartphones. With the increasing popularity of smartphones, the use of digital apps is also becoming more common among users. For instance, according to a report published by sell cell, in 2021 1510.3 smartphones are sold as compared to 2020. 113.0 million People have updated their mobile phones in 2021. However, the market is expected to eventually return to the pre-pandemic situation as people resume their normal life. This trend is anticipated to impact positively during the forecast period.
The offline segment led the market share and is expected to witness progressive growth in demand during the forecast period. The offline segment accounted for the leading market share of more than 69.0% share of the overall revenue and is expected to witness significant growth in the near future. Increasing demand for costly devices such as smartwatches along with mobile camera lenses and perception of issues with the delivery of fragile items are the factors propelling the segment's growth. Traditional methods of shopping and difference in price in local retail outlets and other wholesale markets are the reasons for the segment growth.
The headphone segment is expected to register a CAGR of 7.3% during the forecast period. One of the most developing trends in the mobile industry at present is the growing sophistication of headphones. It also fuels the market growth for unconditional connectors such as type-c USB Ports cables. Growing fitness consciousness among the young population has driven demand for sports and fitness headphones in recent times. The popularity of cheap headphones has increased among the economical consumer group due to a rise in traveling trends standalone.
In 2022, Asia Pacific led with a market share of around 46.5% and is anticipated to witness a significant CAGR in near future. In Asia Pacific, China contributed to the majority of the share and accounted for 55.2% share of the overall revenue in 2022. Europe is the second-largest segment with a market share of around 21.0% in 2021. Western Europe is the dominant segment in Europe, due to the high purchasing power and fashion-conscious consumers in countries, such as Germany, and the U.K.
The market presents moderate to low entry barriers due to the presence of a large number of unstructured dealers in the market. The market is further driven by innovation in technology, mergers & acquisitions, and joint ventures. The companies also spend a huge chunk of their revenue on research and development as the industry witnessed frequent changes in technologies. In order to gain a competitive edge, the market players must understand the need for the product among the consumers.
Mobile Accessories Market Report Highlights
- The online segment is expected to attain the fastest CAGR from 2023 to 2030. The segment growth can be attributed to the increasing internet penetration in rural areas are anticipated to propel the segment growth.
- The headphone segment is expected to attain the fastest CAGR from 2023 to 2030, Growing fitness consciousness among the young population has driven demand for sports and fitness headphones in recent times thus, it is anticipated to propel segment growth.
- Asia Pacific led with a market share of around 46.5% and is anticipated to witness a significant CAGR in near future. In Asia Pacific, China contributed to the majority of the share and accounted for 55.2% share of the overall revenue in 2022.
Table of Contents
Chapter 1. Methodology and Scope
- 1.1. Market Segmentation & Scope
- 1.2. Market Definition
- 1.3. Information Procurement
- 1.3.1. Purchased Database
- 1.3.2. GVR's Internal Database
- 1.3.3. Secondary Sources & Third-Party Perspectives
- 1.3.4. Primary Research
- 1.4. Information Analysis
- 1.4.1. Data Analysis Models
- 1.5. Market Formulation & Data Visualization
- 1.6. Data Validation & Publishing
Chapter 2. Executive Summary
- 2.1. Market Outlook
- 2.2. Product Type Outlook
- 2.3. Distribution Channel Outlook
- 2.4. Regional Outlook
- 2.5. Competition Outlook
Chapter 3. Mobile Accessories Market Variables, Trends & Scope
- 3.1. Market Lineage Outlook
- 3.2. Industry Value Chain Analysis
- 3.2.1. Raw Material Outlook
- 3.2.2. Manufacturing and Technology Outlook
- 3.2.3. Profit Margin Analysis
- 3.3. Market Dynamics
- 3.3.1. Market Driver Analysis
- 3.3.2. Market Restraint Analysis
- 3.3.3. Market Opportunities
- 3.3.4. Market Challenges
- 3.4. Industry Analysis - Porter's Five Forces Analysis
- 3.5. Market Entry Strategies
Chapter 4. Consumer Behavior Analysis
- 4.1. Demographics Analysis
- 4.2. Consumer Trends and Preferences
- 4.3. Factors Affecting Buying Decision
- 4.4. Consumer Product Adoption
- 4.5. Key Observations & Findings
Chapter 5. Mobile Accessories Market: Product Type Estimates & Trend Analysis
- 5.1. Product Type Movement Analysis & Market Share, 2022 & 2030
- 5.2. Headphone
- 5.2.1. Headphone mobile accessories market estimates and forecast, 2017 - 2030 (USD Million)
- 5.3. Charger
- 5.3.1. Charger mobile accessories market estimates and forecast, 2017 - 2030 (USD Million)
- 5.4. Power Bank
- 5.4.1. Power Bank mobile accessories market estimates and forecast, 2017 - 2030 (USD Million)
- 5.5. Protective Case
- 5.5.1. Protective Case mobile accessories market estimates and forecast, 2017 - 2030 (USD Million)
- 5.6. Others
- 5.6.1. Others mobile accessories market estimates and forecast, 2017 - 2030 (USD Million)
Chapter 6. Mobile Accessories Market: Distribution Channel Estimates & Trend Analysis
- 6.1. Distribution Channel Movement Analysis & Market Share, 2022 & 2030
- 6.2. Online
- 6.2.1. Mobile accessories market estimates and forecast through online distribution channel, 2017 - 2030 (USD Million)
- 6.3. Offline
- 6.3.1. Mobile accessories market estimates and forecast through offline distribution channel, 2017 - 2030 (USD Million)
Chapter 7. Mobile Accessories Market: Regional Estimates & Trend Analysis
- 7.1. Regional Movement Analysis & Market Share, 2022 & 2030
- 7.2. North America
- 7.2.1. Market estimates and forecast, 2017 - 2030 (USD Million)
- 7.2.2. Market estimates and forecast, by product type, 2017 - 2030 (USD Million)
- 7.2.3. Market estimates and forecast, by distribution channel, 2017 - 2030 (USD Million)
- 7.2.4. U.S.
- 7.2.4.1. Market estimates and forecast, 2017 - 2030 (USD Million)
- 7.2.4.2. Market estimates and forecast, by product type, 2017 - 2030 (USD Million)
- 7.2.4.3. Market estimates and forecast, by distribution channel, 2017 - 2030 (USD Million)
- 7.2.5. Canada
- 7.2.5.1. Market estimates and forecast, 2017 - 2030 (USD Million)
- 7.2.5.2. Market estimates and forecast, by product type, 2017 - 2030 (USD Million)
- 7.2.5.3. Market estimates and forecast, by distribution channel, 2017 - 2030 (USD Million)
- 7.2.6. Mexico
- 7.2.6.1. Market estimates and forecast, 2017 - 2030 (USD Million)
- 7.2.6.2. Market estimates and forecast, by product type, 2017 - 2030 (USD Million)
- 7.2.6.3. Market estimates and forecast, by distribution channel, 2017 - 2030 (USD Million)
- 7.3. Europe
- 7.3.1. Market estimates and forecast, 2017 - 2030 (USD Million)
- 7.3.2. Market estimates and forecast, by product type, 2017 - 2030 (USD Million)
- 7.3.3. Market estimates and forecast, by distribution channel, 2017 - 2030 (USD Million)
- 7.3.4. U.K.
- 7.3.4.1. Market estimates and forecast, 2017 - 2030 (USD Million)
- 7.3.4.2. Market estimates and forecast, by product type, 2017 - 2030 (USD Million)
- 7.3.4.3. Market estimates and forecast, by distribution channel, 2017 - 2030 (USD Million)
- 7.3.5. Germany
- 7.3.5.1. Market estimates and forecast, 2017 - 2030 (USD Million)
- 7.3.5.2. Market estimates and forecast, by product type, 2017 - 2030 (USD Million)
- 7.3.5.3. Market estimates and forecast, by distribution channel, 2017 - 2030 (USD Million)
- 7.3.6. France
- 7.3.6.1. Market estimates and forecast, 2017 - 2030 (USD Million)
- 7.3.6.2. Market estimates and forecast, by product type, 2017 - 2030 (USD Million)
- 7.3.6.3. Market estimates and forecast, by distribution channel, 2017 - 2030 (USD Million)
- 7.3.7. Italy
- 7.3.7.1. Market estimates and forecast, 2017 - 2030 (USD Million)
- 7.3.7.2. Market estimates and forecast, by product type, 2017 - 2030 (USD Million)
- 7.3.7.3. Market estimates and forecast, by distribution channel, 2017 - 2030 (USD Million)
- 7.3.8. Spain
- 7.3.8.1. Market estimates and forecast, 2017 - 2030 (USD Million)
- 7.3.8.2. Market estimates and forecast, by product type, 2017 - 2030 (USD Million)
- 7.3.8.3. Market estimates and forecast, by distribution channel, 2017 - 2030 (USD Million)
- 7.4. Asia Pacific
- 7.4.1. Market estimates and forecast, 2017 - 2030 (USD Million)
- 7.4.2. Market estimates and forecast, by product type, 2017 - 2030 (USD Million)
- 7.4.3. Market estimates and forecast, by distribution channel, 2017 - 2030 (USD Million)
- 7.4.4. China
- 7.4.4.1. Market estimates and forecast, 2017 - 2030 (USD Million)
- 7.4.4.2. Market estimates and forecast, by product type, 2017 - 2030 (USD Million)
- 7.4.4.3. Market estimates and forecast, by distribution channel, 2017 - 2030 (USD Million)
- 7.4.5. Japan
- 7.4.5.1. Market estimates and forecast, 2017 - 2030 (USD Million)
- 7.4.5.2. Market estimates and forecast, by product type, 2017 - 2030 (USD Million)
- 7.4.5.3. Market estimates and forecast, by distribution channel, 2017 - 2030 (USD Million)
- 7.4.6. India
- 7.4.6.1. Market estimates and forecast, 2017 - 2030 (USD Million)
- 7.4.6.2. Market estimates and forecast, by product type, 2017 - 2030 (USD Million)
- 7.4.6.3. Market estimates and forecast, by distribution channel, 2017 - 2030 (USD Million)
- 7.4.7. South Korea
- 7.4.7.1. Market estimates and forecast, 2017 - 2030 (USD Million)
- 7.4.7.2. Market estimates and forecast, by product type, 2017 - 2030 (USD Million)
- 7.4.7.3. Market estimates and forecast, by distribution channel, 2017 - 2030 (USD Million)
- 7.4.8. Australia
- 7.4.8.1. Market estimates and forecast, 2017 - 2030 (USD Million)
- 7.4.8.2. Market estimates and forecast, by product type, 2017 - 2030 (USD Million)
- 7.4.8.3. Market estimates and forecast, by distribution channel, 2017 - 2030 (USD Million)
- 7.5. Central & South America
- 7.5.1. Market estimates and forecast, 2017 - 2030 (USD Million)
- 7.5.2. Market estimates and forecast, by product type, 2017 - 2030 (USD Million)
- 7.5.3. Market estimates and forecast, by distribution channel, 2017 - 2030 (USD Million)
- 7.5.4. Brazil
- 7.5.4.1. Market estimates and forecast, 2017 - 2030 (USD Million)
- 7.5.4.2. Market estimates and forecast, by product type, 2017 - 2030 (USD Million)
- 7.5.4.3. Market estimates and forecast, by distribution channel, 2017 - 2030 (USD Million)
- 7.6. Middle East & Africa
- 7.6.1. Market estimates and forecast, 2017 - 2030 (USD Million)
- 7.6.2. Market estimates and forecast, by product type, 2017 - 2030 (USD Million)
- 7.6.3. Market estimates and forecast, by distribution channel, 2017 - 2030 (USD Million)
- 7.6.4. Saudi Arabia
- 7.6.4.1. Market estimates and forecast, 2017 - 2030 (USD Million)
- 7.6.4.2. Market estimates and forecast, by product type, 2017 - 2030 (USD Million)
- 7.6.4.3. Market estimates and forecast, by distribution channel, 2017 - 2030 (USD Million)
Chapter 8. Competitive Analysis
- 8.1. Recent developments & impact analysis, by key market participants
- 8.2. Company Categorization
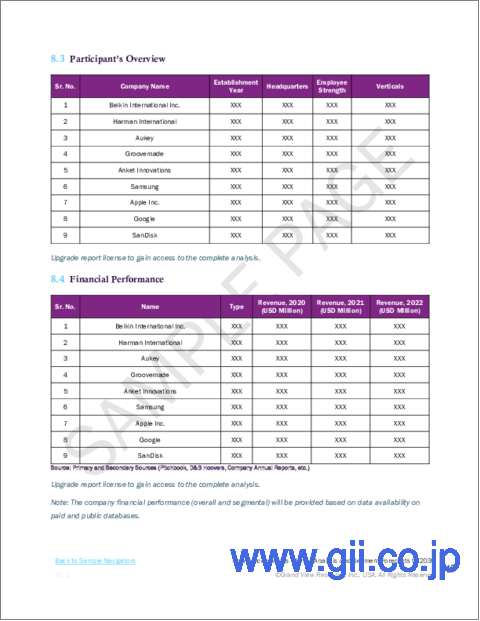
- 8.3. Participant's Overview
- 8.4. Financial Performance
- 8.5. Product Benchmarking
- 8.6. Company Market Share Analysis, 2022 (%)
- 8.7. Company Heat Map Analysis
- 8.8. Strategy Mapping
- 8.9. List of key companies analyzed in this section include:
- 8.9.1. Belkin International Inc.
- 8.9.2. Harman International
- 8.9.3. Aukey
- 8.9.4. Groovemade
- 8.9.5. Anket Innovations
- 8.9.6. Samsung
- 8.9.7. Apple Inc.
- 8.9.8. Google
- 8.9.9. SanDisk
