|
|
市場調査レポート
商品コード
1678505
男性用健康サプリメントの世界市場規模、シェア、動向分析レポート:タイプ別、年齢層別、処方別、流通チャネル別、地域別、セグメント別予測(2025年~2030年)Men's Health Supplements Market Size, Share & Trends Analysis Report, By Type (Sports Supplements, Reproductive Health Supplements), By Age Group, By Formulation, By Distribution Channel, By Region, And Segment Forecasts, 2025 - 2030 |
||||||
|
|||||||
カスタマイズ可能
|
|||||||

| 男性用健康サプリメントの世界市場規模、シェア、動向分析レポート:タイプ別、年齢層別、処方別、流通チャネル別、地域別、セグメント別予測(2025年~2030年) |
|
出版日: 2025年02月05日
発行: Grand View Research
ページ情報: 英文 200 Pages
納期: 2~10営業日
|

全表示
- 概要
- 図表
- 目次
男性用健康サプリメント市場の成長と動向:
Grand View Research, Inc.の最新レポートによると、世界の男性用健康サプリメントの市場規模は、2030年までに1,321億3,000万米ドルに達する見込みです。
同市場は2025年~2030年にCAGR10.07%を記録すると推定されます。ライフスタイルの変化やストレスの多い職場環境、加齢に伴う健康不安の高まりなどの要因が、市場の成長を促進すると予測されています。加えて、消費者の高い需要に起因する市場競争の激化や、市場企業が高品質のサプリメントを製造することに重点を置くようになったことも、成長を後押しする重要な要因です。
男性の間で加齢に関連した懸念が高まっていることも、健康サプリメントの需要を高める主な要因の一つです。男性は年齢を重ねるにつれて、薄毛、心血管の問題、免疫力の問題、パフォーマンスの問題、前立腺の健康問題など、数多くの問題に直面するようになります。健康サプリメントは多くの場合、こうした加齢に関連する根本的な問題に対処し、活力と全体的な健康をサポートします。男性の健康のために最も売れているサプリメントには、ADAM Superior Men's MultivitaminやSmartyPants Men's Completeなどがあります。
さらに、世界中で急増する菜食主義の動向は、植物由来のサプリメント製品に恩恵をもたらすと予測されており、予測期間中に植物由来の栄養補助食品の需要を煽ると予想されています。例えば、American Botanical Councilによると、米国におけるハーブサプリメントの小売売上高は2021年に9.7%増加しました。米国で最も売れているハーブサプリメント製品は、エルダーベリー、アシュワガンダ、ギンコを含む製剤であり、これらは男性の健康増進に重要な役割を果たしています。
さらに、生活習慣病の高い有病率と、正常な身体機能をサポートするサプリメントへの旺盛な需要が、新規製品の導入とイノベーションを促進しています。例えば、ファーマアクティブ・バイオテック・プロダクツは2022年10月、女性と男性の両方の性機能を高めるターネラ・ディフサの抽出物であるLiboostを発売しました。この新発売の製品は、性欲と性機能を高めることが科学的に裏付けられています。
男性用健康サプリメント市場レポートのハイライト
- 体重管理サプリメントは2024年に36.16%の売上シェアで市場を席巻しました。この大きなシェアは、肥満と、糖尿病、心血管疾患(CVDs)、高血圧などの関連する健康疾患の増加によるものです。
- 年齢層別では、31~45歳のセグメントが2024年に30.53%のシェアを占め、業界最大の収益貢献者でした。60歳以上のセグメントは、平均寿命の伸び、ウェルビーイングに対する意識の高まり、可処分所得の増加により、予測期間中に最も速いCAGRを記録すると予想されます。
- 処方別では、カプセルセグメントが2024年の売上シェア35.70%で市場を独占しました。収益シェアが高いのは、低コスト、高い利便性、高い保存可能期間、患者のコンプライアンス向上により、カプセルで入手可能な製品の数が多いためです。
- オフライン流通チャネルは2024年に75.20%のシェアで世界の業界を支配しましたが、予測期間中はオンラインセグメントが最も高いCAGRを記録すると予測されます。
- アジア太平洋は、大規模な患者層の存在とサプリメントに対する強い需要により、2024年に37.98%の収益シェアを占め、世界の業界をリードしました。
目次
第1章 調査手法と範囲
第2章 エグゼクティブサマリー
第3章 市場の変数、動向、範囲
- 市場系統の見通し
- 親市場の見通し
- 関連/補助市場見通し
- 市場力学
- 市場促進要因分析
- 市場抑制要因分析
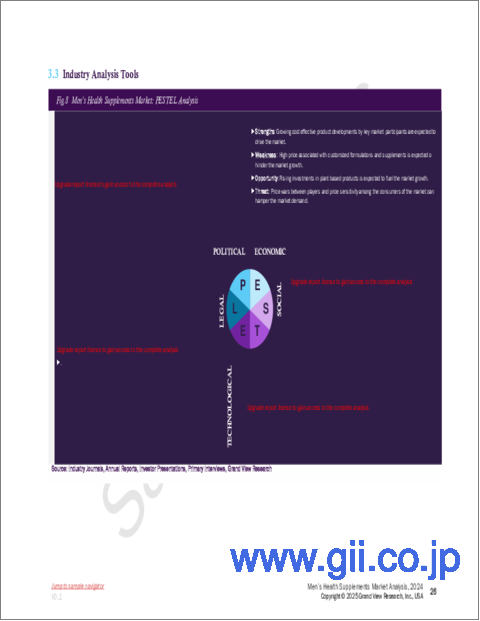
- 業界分析ツール
- ポーターのファイブフォース分析
- PESTEL分析
- COVID-19の影響分析
第4章 タイプのビジネス分析
- タイプのセグメントダッシュボード
- 世界の男性用健康サプリメント市場:タイプの変動分析
- 世界の男性用健康サプリメント市場規模と動向分析:タイプ別(2018年~2030年)
- スポーツサプリメント
- スポーツサプリメント市場(2018年~2030年)
- 生殖健康サプリメント
- 生殖健康サプリメント市場(2018年~2030年)
- 骨と関節の健康サプリメント
- 骨と関節の健康サプリメント市場(2018年~2030年)
- 心臓血管の健康サプリメント
- 心臓血管の健康サプリメント市場(2018年~2030年)
- プロバイオティクスサプリメント
- プロバイオティクスサプリメント市場(2018年~2030年)
- アンチエイジングサプリメント
- アンチエイジングサプリメント市場(2018年~2030年)
- 育毛サプリメント
- 育毛サプリメント市場(2018年~2030年)
- 体重管理サプリメント
- 体重管理サプリメント市場(2018年~2030年)
- 免疫健康サプリメント
- 免疫健康サプリメント市場(2018年~2030年)
- その他
- その他のタイプの市場(2018年~2030年)
第5章 年齢層のビジネス分析
- 年齢層のセグメントダッシュボード
- 世界の男性用健康サプリメント市場:年齢層の変動分析
- 世界の男性用健康サプリメント市場規模と動向分析:年齢層別(2018年~2030年)
- 20~30歳
- 20~30歳市場(2018年~2030年)
- 31~45歳
- 31~45歳市場(2018年~2030年)
- 46~60歳
- 46~60歳市場(2018年~2030年)
- 60歳超
- 60歳超市場(2018年~2030年)
第6章 処方のビジネス分析
- 処方のセグメントダッシュボード
- 世界の男性用健康サプリメント市場:処方の変動分析
- 世界の男性用健康サプリメント市場規模と動向分析:処方別(2018年~2030年)
- 錠剤
- 錠剤市場(2018年~2030年)
- カプセル
- カプセル市場(2018年~2030年)
- 液体
- 液体市場(2018年~2030年)
- 粉末
- 粉末市場(2018年~2030年)
- グミ
- グミ市場(2018年~2030年)
- その他
- その他の処方市場(2018年~2030年)
第7章 流通チャネルのビジネス分析
- 流通チャネルのセグメントダッシュボード
- 世界の男性用健康サプリメント市場:流通チャネルの変動分析
- 世界の男性用健康サプリメント市場規模と動向分析:流通チャネル別(2018年~2030年)
- オンライン
- オンライン市場(2018年~2030年)
- オフライン
- オフライン市場(2018年~2030年)
第8章 地域のビジネス分析
- 地域別市場シェア分析(2024年・2030年)
- 地域市場ダッシュボード
- 市場規模と予測および動向分析(2018年~2030年)
- 北米
- 北米の男性用健康サプリメント市場(2018年~2030年)
- 米国
- カナダ
- 欧州
- 欧州の男性用健康サプリメント市場(2018年~2030年)
- 英国
- ドイツ
- フランス
- イタリア
- スペイン
- デンマーク
- スウェーデン
- ノルウェー
- アジア太平洋
- アジア太平洋の男性用健康サプリメント市場(2018年~2030年)
- 日本
- 中国
- インド
- オーストラリア
- タイ
- 韓国
- ラテンアメリカ
- ラテンアメリカの男性用健康サプリメント市場(2018年~2030年)
- ブラジル
- メキシコ
- アルゼンチン
- 中東・アフリカ
- 中東・アフリカの男性用健康サプリメント市場(2018年~2030年)
- 南アフリカ
- サウジアラビア
- アラブ首長国連邦
- クウェート
第9章 競合情勢
- 参入企業
- 企業市況分析、2024年
- 参入企業の概要
- Nature's Lab
- Nordic Naturals
- NOW Foods
- Irwin Naturals
- GNC
- Vitamin Shopee
- Amway
- Life Extension
- New Chapter, Inc.
- Metagenics LLC
List of Tables
- TABLE 1 List of Secondary Sources
- TABLE 2 List of Abbreviations
- TABLE 3 Global Men's Health Supplements Market, By Type, 2018 - 2030 (USD Million)
- TABLE 4 Global Men's Health Supplements Market, By Age Group, 2018 - 2030 (USD Million)
- TABLE 5 Global Men's Health Supplements Market, By Formulation, 2018 - 2030 (USD Million)
- TABLE 6 Global Men's Health Supplements Market, By Distribution Channel, 2018 - 2030 (USD Million)
- TABLE 7 Global Men's Health Supplements Market, By Region, 2018 - 2030 (USD Million)
- TABLE 8 North America Men's Health Supplements Market, By Country, 2018 - 2030 (USD Million)
- TABLE 9 North America Men's Health Supplements Market, By Type, 2018 - 2030 (USD Million)
- TABLE 10 North America Men's Health Supplements Market, By Age Group, 2018 - 2030 (USD Million)
- TABLE 11 North America Men's Health Supplements Market, By Formulation, 2018 - 2030 (USD Million)
- TABLE 12 North America Men's Health Supplements Market, By Distribution Channel, 2018 - 2030 (USD Million)
- TABLE 13 U.S. Men's Health Supplements Market, By Type, 2018 - 2030 (USD Million)
- TABLE 14 U.S. Men's Health Supplements Market, By Age Group, 2018 - 2030 (USD Million)
- TABLE 15 U.S. Men's Health Supplements Market, By Formulation, 2018 - 2030 (USD Million)
- TABLE 16 U.S. Men's Health Supplements Market, By Distribution Channel, 2018 - 2030 (USD Million)
- TABLE 17 Canada Men's Health Supplements Market, By Type, 2018 - 2030 (USD Million)
- TABLE 18 Canada Men's Health Supplements Market, By Age Group, 2018 - 2030 (USD Million)
- TABLE 19 Canada Men's Health Supplements Market, By Formulation, 2018 - 2030 (USD Million)
- TABLE 20 Canada Men's Health Supplements Market, By Distribution Channel, 2018 - 2030 (USD Million)
- TABLE 21 Mexico Men's Health Supplements Market, By Type, 2018 - 2030 (USD Million)
- TABLE 22 Mexico Men's Health Supplements Market, By Age Group, 2018 - 2030 (USD Million)
- TABLE 23 Mexico Men's Health Supplements Market, By Formulation, 2018 - 2030 (USD Million)
- TABLE 24 Mexico Men's Health Supplements Market, By Distribution Channel, 2018 - 2030 (USD Million)
- TABLE 25 Europe Men's Health Supplements Market, By Country, 2018 - 2030 (USD Million)
- TABLE 26 Europe Men's Health Supplements Market, By Type, 2018 - 2030 (USD Million)
- TABLE 27 Europe Men's Health Supplements Market, By Age Group, 2018 - 2030 (USD Million)
- TABLE 28 Europe Men's Health Supplements Market, By Formulation, 2018 - 2030 (USD Million)
- TABLE 29 Europe Men's Health Supplements Market, By Distribution Channel, 2018 - 2030 (USD Million)
- TABLE 30 UK Men's Health Supplements Market, By Type, 2018 - 2030 (USD Million)
- TABLE 31 UK Men's Health Supplements Market, By Age Group, 2018 - 2030 (USD Million)
- TABLE 32 UK Men's Health Supplements Market, By Formulation, 2018 - 2030 (USD Million)
- TABLE 33 UK Men's Health Supplements Market, By Distribution Channel, 2018 - 2030 (USD Million)
- TABLE 34 Germany Men's Health Supplements Market, By Type, 2018 - 2030 (USD Million)
- TABLE 35 Germany Men's Health Supplements Market, By Age Group, 2018 - 2030 (USD Million)
- TABLE 36 Germany Men's Health Supplements Market, By Formulation, 2018 - 2030 (USD Million)
- TABLE 37 Germany Men's Health Supplements Market, By Distribution Channel, 2018 - 2030 (USD Million)
- TABLE 38 France Men's Health Supplements Market, By Type, 2018 - 2030 (USD Million)
- TABLE 39 France Men's Health Supplements Market, By Age Group, 2018 - 2030 (USD Million)
- TABLE 40 France Men's Health Supplements Market, By Formulation, 2018 - 2030 (USD Million)
- TABLE 41 France Men's Health Supplements Market, By Distribution Channel, 2018 - 2030 (USD Million)
- TABLE 42 Spain Men's Health Supplements Market, By Type, 2018 - 2030 (USD Million)
- TABLE 43 Spain Men's Health Supplements Market, By Age Group, 2018 - 2030 (USD Million)
- TABLE 44 Spain Men's Health Supplements Market, By Formulation, 2018 - 2030 (USD Million)
- TABLE 45 Spain Men's Health Supplements Market, By Distribution Channel, 2018 - 2030 (USD Million)
- TABLE 46 Italy Men's Health Supplements Market, By Type, 2018 - 2030 (USD Million)
- TABLE 47 Italy Men's Health Supplements Market, By Age Group, 2018 - 2030 (USD Million)
- TABLE 48 Italy Men's Health Supplements Market, By Formulation, 2018 - 2030 (USD Million)
- TABLE 49 Italy Men's Health Supplements Market, By Distribution Channel, 2018 - 2030 (USD Million)
- TABLE 50 Denmark Men's Health Supplements Market, By Type, 2018 - 2030 (USD Million)
- TABLE 51 Denmark Men's Health Supplements Market, By Age Group, 2018 - 2030 (USD Million)
- TABLE 52 Denmark Men's Health Supplements Market, By Formulation, 2018 - 2030 (USD Million)
- TABLE 53 Denmark Men's Health Supplements Market, By Distribution Channel, 2018 - 2030 (USD Million)
- TABLE 54 Norway Men's Health Supplements Market, By Type, 2018 - 2030 (USD Million)
- TABLE 55 Norway Men's Health Supplements Market, By Age Group, 2018 - 2030 (USD Million)
- TABLE 56 Norway Men's Health Supplements Market, By Formulation, 2018 - 2030 (USD Million)
- TABLE 57 Norway Men's Health Supplements Market, By Distribution Channel, 2018 - 2030 (USD Million)
- TABLE 58 Sweden Men's Health Supplements Market, By Type, 2018 - 2030 (USD Million)
- TABLE 59 Sweden Men's Health Supplements Market, By Age Group, 2018 - 2030 (USD Million)
- TABLE 60 Sweden Men's Health Supplements Market, By Formulation, 2018 - 2030 (USD Million)
- TABLE 61 Sweden Men's Health Supplements Market, By Distribution Channel, 2018 - 2030 (USD Million)
- TABLE 62 Asia Pacific Men's Health Supplements Market, By Country, 2018 - 2030 (USD Million)
- TABLE 63 Asia Pacific Men's Health Supplements Market, By Type, 2018 - 2030 (USD Million)
- TABLE 64 Asia Pacific Men's Health Supplements Market, By Age Group, 2018 - 2030 (USD Million)
- TABLE 65 Asia Pacific Men's Health Supplements Market, By Formulation, 2018 - 2030 (USD Million)
- TABLE 66 Asia Pacific Men's Health Supplements Market, By Distribution Channel, 2018 - 2030 (USD Million)
- TABLE 67 China Men's Health Supplements Market, By Type, 2018 - 2030 (USD Million)
- TABLE 68 China Men's Health Supplements Market, By Age Group, 2018 - 2030 (USD Million)
- TABLE 69 China Men's Health Supplements Market, By Formulation, 2018 - 2030 (USD Million)
- TABLE 70 China Men's Health Supplements Market, By Distribution Channel, 2018 - 2030 (USD Million)
- TABLE 71 Japan Men's Health Supplements Market, By Type, 2018 - 2030 (USD Million)
- TABLE 72 Japan Men's Health Supplements Market, By Age Group, 2018 - 2030 (USD Million)
- TABLE 73 Japan Men's Health Supplements Market, By Formulation, 2018 - 2030 (USD Million)
- TABLE 74 Japan Men's Health Supplements Market, By Distribution Channel, 2018 - 2030 (USD Million)
- TABLE 75 India Men's Health Supplements Market, By Type, 2018 - 2030 (USD Million)
- TABLE 76 India Men's Health Supplements Market, By Age Group, 2018 - 2030 (USD Million)
- TABLE 77 India Men's Health Supplements Market, By Formulation, 2018 - 2030 (USD Million)
- TABLE 78 India Men's Health Supplements Market, By Distribution Channel, 2018 - 2030 (USD Million)
- TABLE 79 South Korea Men's Health Supplements Market, By Type, 2018 - 2030 (USD Million)
- TABLE 80 South Korea Men's Health Supplements Market, By Age Group, 2018 - 2030 (USD Million)
- TABLE 81 South Korea Men's Health Supplements Market, By Formulation, 2018 - 2030 (USD Million)
- TABLE 82 South Korea Men's Health Supplements Market, By Distribution Channel, 2018 - 2030 (USD Million)
- TABLE 83 Australia Men's Health Supplements Market, By Type, 2018 - 2030 (USD Million)
- TABLE 84 Australia Men's Health Supplements Market, By Age Group, 2018 - 2030 (USD Million)
- TABLE 85 Australia Men's Health Supplements Market, By Formulation, 2018 - 2030 (USD Million)
- TABLE 86 Australia Men's Health Supplements Market, By Distribution Channel, 2018 - 2030 (USD Million)
- TABLE 87 Thailand Men's Health Supplements Market, By Type, 2018 - 2030 (USD Million)
- TABLE 88 Thailand Men's Health Supplements Market, By Age Group, 2018 - 2030 (USD Million)
- TABLE 89 Thailand Men's Health Supplements Market, By Formulation, 2018 - 2030 (USD Million)
- TABLE 90 Thailand Men's Health Supplements Market, By Distribution Channel, 2018 - 2030 (USD Million)
- TABLE 91 Latin America Men's Health Supplements Market, By Country, 2018 - 2030 (USD Million)
- TABLE 92 Latin America Men's Health Supplements Market, By Type, 2018 - 2030 (USD Million)
- TABLE 93 Latin America Men's Health Supplements Market, By Age Group, 2018 - 2030 (USD Million)
- TABLE 94 Latin America Men's Health Supplements Market, By Formulation, 2018 - 2030 (USD Million)
- TABLE 95 Latin America Men's Health Supplements Market, By Distribution Channel, 2018 - 2030 (USD Million)
- TABLE 96 Brazil Men's Health Supplements Market, By Type, 2018 - 2030 (USD Million)
- TABLE 97 Brazil Men's Health Supplements Market, By Age Group, 2018 - 2030 (USD Million)
- TABLE 98 Brazil Men's Health Supplements Market, By Formulation, 2018 - 2030 (USD Million)
- TABLE 99 Brazil Men's Health Supplements Market, By Distribution Channel, 2018 - 2030 (USD Million)
- TABLE 100 Argentina Men's Health Supplements Market, By Type, 2018 - 2030 (USD Million),
- TABLE 101 Argentina Men's Health Supplements Market, By Age Group, 2018 - 2030 (USD Million)
- TABLE 102 Argentina Men's Health Supplements Market, By Formulation, 2018 - 2030 (USD Million)
- TABLE 103 Argentina Men's Health Supplements Market, By Distribution Channel, 2018 - 2030 (USD Million)
- TABLE 104 MEA Men's Health Supplements Market, By Country, 2018 - 2030 (USD Million)
- TABLE 105 MEA Men's Health Supplements Market, By Type, 2018 - 2030 (USD Million)
- TABLE 106 MEA Men's Health Supplements Market, By Age Group, 2018 - 2030 (USD Million)
- TABLE 107 MEA Men's Health Supplements Market, By Formulation, 2018 - 2030 (USD Million)
- TABLE 108 MEA Men's Health Supplements Market, By Distribution Channel, 2018 - 2030 (USD Million)
- TABLE 109 South Africa Men's Health Supplements Market, By Type, 2018 - 2030 (USD Million)
- TABLE 110 South Africa Men's Health Supplements Market, By Age Group, 2018 - 2030 (USD Million)
- TABLE 111 South Africa Men's Health Supplements Market, By Formulation, 2018 - 2030 (USD Million)
- TABLE 112 South Africa Men's Health Supplements Market, By Distribution Channel, 2018 - 2030 (USD Million)
- TABLE 113 UAE Men's Health Supplements Market, By Type, 2018 - 2030 (USD Million)
- TABLE 114 UAE Men's Health Supplements Market, By Age Group, 2018 - 2030 (USD Million)
- TABLE 115 UAE Men's Health Supplements Market, By Formulation, 2018 - 2030 (USD Million)
- TABLE 116 UAE Men's Health Supplements Market, By Distribution Channel, 2018 - 2030 (USD Million)
- TABLE 117 Saudi Arabia Men's Health Supplements Market, By Type, 2018 - 2030 (USD Million),
- TABLE 118 Saudi Arabia Men's Health Supplements Market, By Age Group, 2018 - 2030 (USD Million)
- TABLE 119 Saudi Arabia Men's Health Supplements Market, By Formulation, 2018 - 2030 (USD Million)
- TABLE 120 Saudi Arabia Men's Health Supplements Market, By Distribution Channel, 2018 - 2030 (USD Million)
- TABLE 121 Kuwait Men's Health Supplements Market, By Type, 2018 - 2030 (USD Million)
- TABLE 122 Kuwait Men's Health Supplements Market, By Age Group, 2018 - 2030 (USD Million)
- TABLE 123 Kuwait Men's Health Supplements Market, By Formulation, 2018 - 2030 (USD Million)
- TABLE 124 Kuwait Men's Health Supplements Market, By Distribution Channel, 2018 - 2030 (USD Million)
List of Figures
- Figure 1. Market research process
- Figure 2. Data triangulation techniques
- Figure 3. Primary research pattern
- Figure 4. Market research approaches
- Figure 5. Value-chain-based sizing & forecasting
- Figure 6. QFD modeling for market share assessment
- Figure 7. Market formulation & validation
- Figure 8. Parent market outlook
- Figure 9. Related/ancillary market outlook
- Figure 10. Market driver relevance analysis (current & future impact)
- Figure 11. Market restraint relevance analysis (current & future impact)
- Figure 12. PESTEL analysis
- Figure 13. Porter's five forces analysis
- Figure 14. Global men's health supplements market: Type outlook and key takeaways
- Figure 15. Global men's health supplements market: Type movement analysis
- Figure 16. Global men's health supplements market, for sports supplements, 2018 - 2030 (USD Million)
- Figure 17. Global men's health supplements market, for reproductive health supplements, 2018 - 2030 (USD Million)
- Figure 18. Global men's health supplements market, for bone & joint health supplements, 2018 - 2030 (USD Million)
- Figure 19. Global men's health supplements market, for cardiovascular health supplements, 2018 - 2030 (USD Million)
- Figure 20. Global men's health supplements market, for probiotic supplements, 2018 - 2030 (USD Million)
- Figure 21. Global men's health supplements market, for anti-aging supplements, 2018 - 2030 (USD Million)
- Figure 22. Global men's health supplements market, for hair growth supplements, 2018 - 2030 (USD Million)
- Figure 23. Global men's health supplements market, for weight management supplements, 2018 - 2030 (USD Million)
- Figure 24. Global men's health supplements market, for immune health supplements, 2018 - 2030 (USD Million)
- Figure 25. Global men's health supplements market, for other types, 2018 - 2030 (USD Million)
- Figure 26. Global men's health supplements market: Age group outlook and key takeaways
- Figure 27. Global men's health supplements market: Age group movement analysis
- Figure 28. Global men's health supplements market, for 20-30 , 2018 - 2030 (USD Million)
- Figure 29. Global men's health supplements market, for 31-45, 2018 - 2030 (USD Million)
- Figure 30. Global men's health supplements market, for 46-60, 2018 - 2030 (USD Million)
- Figure 31. Global men's health supplements market, for above 60, 2018 - 2030 (USD Million)
- Figure 32. Global men's health supplements market: Formulation outlook and key takeaways
- Figure 33. Global men's health supplements market: Formulation movement analysis
- Figure 34. Global men's health supplements market, for tablets, 2018 - 2030 (USD Million)
- Figure 35. Global men's health supplements market, for capsules, 2018 - 2030 (USD Million)
- Figure 36. Global men's health supplements market, for liquids, 2018 - 2030 (USD Million)
- Figure 37. Global men's health supplements market, for powders, 2018 - 2030 (USD Million)
- Figure 38. Global men's health supplements market, for gummies , 2018 - 2030 (USD Million)
- Figure 39. Global men's health supplements market, for others, 2018 - 2030 (USD Million)
- Figure 40. Global men's health supplements market: Distribution channel outlook and key takeaways
- Figure 41. Global men's health supplements market: Distribution channel movement analysis
- Figure 42. Global men's health supplements market, for online, 2018 - 2030 (USD Million)
- Figure 43. Global men's health supplements market, for offline, 2018 - 2030 (USD Million)
- Figure 44. Regional marketplace: Key takeaways
- Figure 45. Regional outlook, 2024 & 2030
- Figure 46. Global men's health supplements market: Region movement analysis
- Figure 47. North America men's health supplements market, 2018 - 2030 (USD Million)
- Figure 48. U.S. men's health supplements market, 2018 - 2030 (USD Million)
- Figure 49. Canada men's health supplements market, 2018 - 2030 (USD Million)
- Figure 50. Mexico men's health supplements market, 2018 - 2030 (USD Million)
- Figure 51. Europe men's health supplements market, 2018 - 2030 (USD Million)
- Figure 52. Germany men's health supplements market, 2018 - 2030 (USD Million)
- Figure 53. UK men's health supplements market, 2018 - 2030 (USD Million)
- Figure 54. France men's health supplements market, 2018 - 2030 (USD Million)
- Figure 55. Italy men's health supplements market, 2018 - 2030 (USD Million)
- Figure 56. Spain men's health supplements market, 2018 - 2030 (USD Million)
- Figure 57. Denmark men's health supplements market, 2018 - 2030 (USD Million)
- Figure 58. Sweden men's health supplements market, 2018 - 2030 (USD Million)
- Figure 59. Norway men's health supplements market, 2018 - 2030 (USD Million)
- Figure 60. Asia Pacific men's health supplements market, 2018 - 2030 (USD Million)
- Figure 61. Japan men's health supplements market, 2018 - 2030 (USD Million)
- Figure 62. China men's health supplements market, 2018 - 2030 (USD Million)
- Figure 63. India men's health supplements market, 2018 - 2030 (USD Million)
- Figure 64. Australia men's health supplements market, 2018 - 2030 (USD Million)
- Figure 65. South Korea men's health supplements market, 2018 - 2030 (USD Million)
- Figure 66. Thailand men's health supplements market, 2018 - 2030 (USD Million)
- Figure 67. Latin America men's health supplements market, 2018 - 2030 (USD Million)
- Figure 68. Brazil men's health supplements market, 2018 - 2030 (USD Million)
- Figure 69. Argentina men's health supplements market, 2018 - 2030 (USD Million)
- Figure 70. Middle East and Africa men's health supplements market, 2018 - 2030 (USD Million)
- Figure 71. South Africa men's health supplements market, 2018 - 2030 (USD Million)
- Figure 72. Saudi Arabia men's health supplements market, 2018 - 2030 (USD Million)
- Figure 73. UAE men's health supplements market, 2018 - 2030 (USD Million)
- Figure 74. Kuwait men's health supplements market, 2018 - 2030 (USD Million)
Men's Health Supplements Market Growth & Trends:
The global men's health supplements market size is expected to reach USD 132.13 billion by 2030, according to a new report by Grand View Research, Inc. The market is estimated to register a CAGR of 10.07% from 2025 to 2030. Factors such as the changing lifestyle & stressful work environment along with rising age-related health concerns are projected to drive the market's growth. In addition, rising competition in the market owing to the high consumer demand and rising emphasis of market players to manufacture quality supplements is another vital factor propelling the growth.
Rising age-related concerns among men are one of the major factors bolstering the demand for health supplements. As men age, they face a number of issues such as hair thinning, cardiovascular issues, immunity issues, performance issues, and prostate health issues among others. Health supplements often address these underlying age-related issues and support vitality and overall well-being. Some of the most selling supplements for male health are ADAM Superior Men's Multivitamin and SmartyPants Men's Complete, among others.
Moreover, the surging trend of veganism across the globe is projected to benefit the plant-based supplementation products which are anticipated to fuel the demand for plant-based dietary supplements over the forecast period. For instance, according to American Botanical Council, the retail sales of herbal supplements in the U.S. increased by 9.7% in the year 2021. The highest-selling herbal supplementation products in the U.S. were formulations containing elderberry, ashwagandha, and ginko which have a significant role in improving male health.
Furthermore, the high prevalence of lifestyle-associated disorders and robust demand for supplements to support normal body functions have facilitated novel product introductions and innovations. For instance, in October 2022 Pharmactive Biotech Products launched Liboost, an extract of Turnera diffusa to enhance sexual function in both women and men. The newly launched product is scientifically backed to boost sexual appetite and function.
Men's Health Supplements Market Report Highlights:
- Weight management supplements dominated the market in 2024 with a revenue share of 36.16%. This large share can be attributed to the rising cases of obesity and related health ailments such as diabetes, cardiovascular diseases (CVDs), and hypertension
- Based on age group, the 31-45 segment was the largest revenue contributor for the industry with a share of 30.53% in 2024. The above 60 segment is expected to witness the fastest CAGR over the forecast period, owing to increasing life expectancy, rising awareness about wellbeing, and increasing disposable income
- Based on formulation, the capsule segment dominated the market with a revenue share of 35.70% in 2024. The higher revenue share is attributed to the high number of products available in capsule form owing to its lower cost, high convenience, high shelf life, and greater patient compliance
- Offline distribution channel segment dominated the global industry with a share of 75.20% in 2024, whereas the online segment is projected to register the highest CAGR during the projected period
- Asia Pacific region dominated the global industry in 2024 with a revenue share of 37.98%, owing to the availability large patient pool and robust demand for supplements
Table of Contents
Chapter 1. Methodology and Scope
- 1.1. Market Segmentation & Scope
- 1.1.1. Market Definitions
- 1.1.1.1. Type segment
- 1.1.1.2. Age group segment
- 1.1.1.3. Formulation segment
- 1.1.1.4. Distribution channel segment
- 1.1.1. Market Definitions
- 1.2. Information analysis
- 1.3. Market formulation & data visualization
- 1.4. Data validation & publishing
- 1.5. Information Procurement
- 1.6. Primary Research
- 1.7. Information or Data Analysis
- 1.8. Market Formulation & Validation
- 1.9. Market Model
- 1.10. Objectives
Chapter 2. Executive Summary
- 2.1. Market Outlook
- 2.2. Segment Outlook
- 2.3. Competitive Insights
Chapter 3. Market Variables, Trends, & Scope
- 3.1. Market Lineage Outlook
- 3.1.1. Parent Market Outlook
- 3.1.2. Related/Ancillary Market Outlook
- 3.2. Market Dynamics
- 3.2.1. Market Driver Analysis
- 3.2.1.1. Increasing Awareness About Men's Health Supplements
- 3.2.1.2. Rising Inclination Towards Preventive Healthcare
- 3.2.1.3. Increasing Accessibility Of Supplements
- 3.2.2. Market Restraint Analysis
- 3.2.2.1. High Cost Of Supplements
- 3.2.2.2. Less Product Penetration In Developing Economies
- 3.2.1. Market Driver Analysis
- 3.3. Industry Analysis Tools
- 3.3.1. Porter's Five Forces Analysis
- 3.3.2. PESTEL Analysis
- 3.3.3. COVID-19 Impact Analysis
Chapter 4. Type Business Analysis
- 4.1. Type Segment Dashboard
- 4.2. Global Men's Health Supplements Market Type Movement Analysis
- 4.3. Global Men's Health Supplements Market Size & Trend Analysis, by Type, 2018 to 2030 (USD Million)
- 4.4. Sports Supplements
- 4.4.1. Sports Supplements Market, 2018 - 2030 (USD Million)
- 4.5. Reproductive Health Supplements
- 4.5.1. Reproductive Health Supplements Market, 2018 - 2030 (USD Million)
- 4.6. Bone & Joint Health Supplements
- 4.6.1. Bone & Joint Health Supplements Market, 2018 - 2030 (USD Million)
- 4.7. Cardiovascular Health Supplement
- 4.7.1. Cardiovascular Health Supplement Market, 2018 - 2030 (USD Million)
- 4.8. Probiotic Supplements
- 4.8.1. Probiotic Supplements Market, 2018 - 2030 (USD Million)
- 4.9. Anti-Aging Supplements
- 4.9.1. Anti-Aging Supplements Market, 2018 - 2030 (USD Million)
- 4.10. Hair Growth Supplements
- 4.10.1. Hair Growth Supplements Market, 2018 - 2030 (USD Million)
- 4.11. Weight Management Supplements
- 4.11.1. Weight Management Supplements Market, 2018 - 2030 (USD Million)
- 4.12. Immune Health Supplements
- 4.12.1. Immune Health Supplements Market, 2018 - 2030 (USD Million)
- 4.13. Others
- 4.13.1. Other Types Market, 2018 - 2030 (USD Million)
Chapter 5. Age Group Business Analysis
- 5.1. Age Group Segment Dashboard
- 5.2. Global Men's Health Supplements Market Age Group Movement Analysis
- 5.3. Global Men's Health Supplements Market Size & Trend Analysis, by Age Group, 2018 to 2030 (USD Million)
- 5.4. 20-30
- 5.4.1. 20-30 Market, 2018 - 2030 (USD Million)
- 5.5. 31-45
- 5.5.1. 31-45 Market, 2018 - 2030 (USD Million)
- 5.6. 46-60
- 5.6.1. 46-60 Market, 2018 - 2030 (USD Million)
- 5.7. Above 60
- 5.7.1. Above 60 Market, 2018 - 2030 (USD Million)
Chapter 6. Formulation Business Analysis
- 6.1. Formulation Segment Dashboard
- 6.2. Global Men's Health Supplements Market Formulation Movement Analysis
- 6.3. Global Men's Health Supplements Market Size & Trend Analysis, by Formulation, 2018 to 2030 (USD Million)
- 6.4. Tablets
- 6.4.1. Tablets Market, 2018 - 2030 (USD Million)
- 6.5. Capsules
- 6.5.1. Capsules Market, 2018 - 2030 (USD Million)
- 6.6. Liquids
- 6.6.1. Liquids Market, 2018 - 2030 (USD Million)
- 6.7. Powders
- 6.7.1. Powders Market, 2018 - 2030 (USD Million)
- 6.8. Gummies
- 6.8.1. Gummies Market, 2018 - 2030 (USD Million)
- 6.9. Others
- 6.9.1. Other Formulations Market, 2018 - 2030 (USD Million)
Chapter 7. Distribution Channel Business Analysis
- 7.1. Distribution Channel Segment Dashboard
- 7.2. Global Men's Health Supplements Market Distribution Channel Movement Analysis
- 7.3. Global Men's Health Supplements Market Size & Trend Analysis, by Distribution Channel, 2018 to 2030 (USD Million)
- 7.4. Online
- 7.4.1. Online Market, 2018 - 2030 (USD Million)
- 7.5. Offline
- 7.5.1. Offline Market, 2018 - 2030 (USD Million)
Chapter 8. Regional Business Analysis
- 8.1. Regional Market Share Analysis, 2024 & 2030
- 8.2. Regional Market Dashboard
- 8.3. Market Size & Forecasts and Trend Analysis, 2018 to 2030
- 8.4. North America
- 8.4.1. North America Men's Health Supplements Market, 2018 - 2030 (USD Million)
- 8.4.2. U.S.
- 8.4.2.1. Key Country Dynamics
- 8.4.2.2. Competitive Scenario
- 8.4.2.3. Regulatory Framework
- 8.4.2.4. U.S. Men's Health Supplements Market, 2018 - 2030 (USD Million)
- 8.4.3. Canada
- 8.4.3.1. Key Country Dynamics
- 8.4.3.2. Competitive Scenario
- 8.4.3.3. Regulatory Framework
- 8.4.3.4. Canada Men's Health Supplements Market, 2018 - 2030 (USD Million)
- 8.5. Europe
- 8.5.1. Europe Men's Health Supplements Market, 2018 - 2030 (USD Million)
- 8.5.2. UK
- 8.5.2.1. Key Country Dynamics
- 8.5.2.2. Competitive Scenario
- 8.5.2.3. Regulatory Framework
- 8.5.2.4. UK Men's Health Supplements Market, 2018 - 2030 (USD Million)
- 8.5.3. Germany
- 8.5.3.1. Key Country Dynamics
- 8.5.3.2. Competitive Scenario
- 8.5.3.3. Regulatory Framework
- 8.5.3.4. Germany Men's Health Supplements Market, 2018 - 2030 (USD Million)
- 8.5.4. France
- 8.5.4.1. Key Country Dynamics
- 8.5.4.2. Competitive Scenario
- 8.5.4.3. Regulatory Framework
- 8.5.4.4. France Men's Health Supplements Market, 2018 - 2030 (USD Million)
- 8.5.5. Italy
- 8.5.5.1. Key Country Dynamics
- 8.5.5.2. Competitive Scenario
- 8.5.5.3. Regulatory Framework
- 8.5.5.4. Italy Men's Health Supplements Market, 2018 - 2030 (USD Million)
- 8.5.6. Spain
- 8.5.6.1. Key Country Dynamics
- 8.5.6.2. Competitive Scenario
- 8.5.6.3. Regulatory Framework
- 8.5.6.4. Spain Men's Health Supplements Market, 2018 - 2030 (USD Million)
- 8.5.7. Denmark
- 8.5.7.1. Key Country Dynamics
- 8.5.7.2. Competitive Scenario
- 8.5.7.3. Regulatory Framework
- 8.5.7.4. Denmark Men's Health Supplements Market, 2018 - 2030 (USD Million)
- 8.5.8. Sweden
- 8.5.8.1. Key Country Dynamics
- 8.5.8.2. Competitive Scenario
- 8.5.8.3. Regulatory Framework
- 8.5.8.4. Sweden Men's Health Supplements Market, 2018 - 2030 (USD Million)
- 8.5.9. Norway
- 8.5.9.1. Key Country Dynamics
- 8.5.9.2. Competitive Scenario
- 8.5.9.3. Regulatory Framework
- 8.5.9.4. Norway Men's Health Supplements Market, 2018 - 2030 (USD Million)
- 8.6. Asia Pacific
- 8.6.1. Asia Pacific Men's Health Supplements Market, 2018 - 2030 (USD Million)
- 8.6.2. Japan
- 8.6.2.1. Key Country Dynamics
- 8.6.2.2. Competitive Scenario
- 8.6.2.3. Regulatory Framework
- 8.6.2.4. Japan Men's Health Supplements Market, 2018 - 2030 (USD Million)
- 8.6.3. China
- 8.6.3.1. Key Country Dynamics
- 8.6.3.2. Competitive Scenario
- 8.6.3.3. Regulatory Framework
- 8.6.3.4. China Men's Health Supplements Market, 2018 - 2030 (USD Million)
- 8.6.4. India
- 8.6.4.1. Key Country Dynamics
- 8.6.4.2. Competitive Scenario
- 8.6.4.3. Regulatory Framework
- 8.6.4.4. India Men's Health Supplements Market, 2018 - 2030 (USD Million)
- 8.6.5. Australia
- 8.6.5.1. Key Country Dynamics
- 8.6.5.2. Competitive Scenario
- 8.6.5.3. Regulatory Framework
- 8.6.5.4. Australia Men's Health Supplements Market, 2018 - 2030 (USD Million)
- 8.6.6. Thailand
- 8.6.6.1. Key Country Dynamics
- 8.6.6.2. Competitive Scenario
- 8.6.6.3. Regulatory Framework
- 8.6.6.4. Thailand Men's Health Supplements Market, 2018 - 2030 (USD Million)
- 8.6.7. South Korea
- 8.6.7.1. Key Country Dynamics
- 8.6.7.2. Competitive Scenario
- 8.6.7.3. Regulatory Framework
- 8.6.7.4. South Korea Men's Health Supplements Market, 2018 - 2030 (USD Million)
- 8.7. Latin America
- 8.7.1. Latin America Men's Health Supplements Market, 2018 - 2030 (USD Million)
- 8.7.2. Brazil
- 8.7.2.1. Key Country Dynamics
- 8.7.2.2. Competitive Scenario
- 8.7.2.3. Regulatory Framework
- 8.7.2.4. Brazil Men's Health Supplements Market, 2018 - 2030 (USD Million)
- 8.7.3. Mexico
- 8.7.3.1. Key Country Dynamics
- 8.7.3.2. Competitive Scenario
- 8.7.3.3. Regulatory Framework
- 8.7.3.4. Mexico Men's Health Supplements Market, 2018 - 2030 (USD Million)
- 8.7.4. Argentina
- 8.7.4.1. Key Country Dynamics
- 8.7.4.2. Competitive Scenario
- 8.7.4.3. Regulatory Framework
- 8.7.4.4. Argentina Men's Health Supplements Market, 2018 - 2030 (USD Million)
- 8.8. MEA
- 8.8.1. MEA Men's Health Supplements Market, 2018 - 2030 (USD Million)
- 8.8.2. South Africa
- 8.8.2.1. Key Country Dynamics
- 8.8.2.2. Competitive Scenario
- 8.8.2.3. Regulatory Framework
- 8.8.2.4. South Africa Men's Health Supplements Market, 2018 - 2030 (USD Million)
- 8.8.3. Saudi Arabia
- 8.8.3.1. Key Country Dynamics
- 8.8.3.2. Competitive Scenario
- 8.8.3.3. Regulatory Framework
- 8.8.3.4. Saudi Arabia Men's Health Supplements Market, 2018 - 2030 (USD Million)
- 8.8.4. UAE
- 8.8.4.1. Key Country Dynamics
- 8.8.4.2. Competitive Scenario
- 8.8.4.3. Regulatory Framework
- 8.8.4.4. UAE Men's Health Supplements Market, 2018 - 2030 (USD Million)
- 8.8.5. Kuwait
- 8.8.5.1. Key Country Dynamics
- 8.8.5.2. Competitive Scenario
- 8.8.5.3. Regulatory Framework
- 8.8.5.4. Kuwait Men's Health Supplements Market, 2018 - 2030 (USD Million)
Chapter 9. Competitive Landscape
- 9.1. Participant Categorization
- 9.2. Company Market Position Analysis, 2024
- 9.3. Participant's Overview
- 9.3.1. Nature's Lab
- 9.3.1.1. Overview
- 9.3.1.2. Financial Performance (Net Revenue/Sales/EBITDA/Gross Profit)
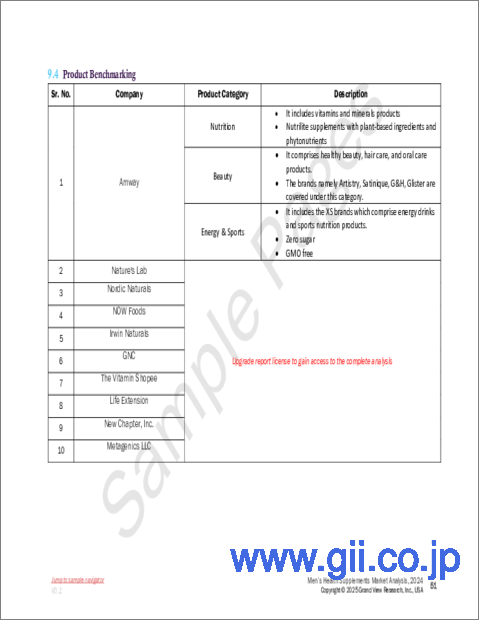
- 9.3.1.3. Product Benchmarking
- 9.3.1.4. Strategic Initiatives
- 9.3.2. Nordic Naturals
- 9.3.2.1. Overview
- 9.3.2.2. Financial Performance (Net Revenue/Sales/EBITDA/Gross Profit)
- 9.3.2.3. Product Benchmarking
- 9.3.2.4. Strategic Initiatives
- 9.3.3. NOW Foods
- 9.3.3.1. Overview
- 9.3.3.2. Financial Performance (Net Revenue/Sales/EBITDA/Gross Profit)
- 9.3.3.3. Product Benchmarking
- 9.3.3.4. Strategic Initiatives
- 9.3.4. Irwin Naturals
- 9.3.4.1. Overview
- 9.3.4.2. Financial Performance (Net Revenue/Sales/EBITDA/Gross Profit)
- 9.3.4.3. Product Benchmarking
- 9.3.4.4. Strategic Initiatives
- 9.3.5. GNC
- 9.3.5.1. Overview
- 9.3.5.2. Financial Performance (Net Revenue/Sales/EBITDA/Gross Profit)
- 9.3.5.3. Product Benchmarking
- 9.3.5.4. Strategic Initiatives
- 9.3.6. Vitamin Shopee
- 9.3.6.1. Overview
- 9.3.6.2. Financial Performance (Net Revenue/Sales/EBITDA/Gross Profit)
- 9.3.6.3. Product Benchmarking
- 9.3.6.4. Strategic Initiatives
- 9.3.7. Amway
- 9.3.7.1. Overview
- 9.3.7.2. Financial Performance (Net Revenue/Sales/EBITDA/Gross Profit)
- 9.3.7.3. Product Benchmarking
- 9.3.7.4. Strategic Initiatives
- 9.3.8. Life Extension
- 9.3.8.1. Overview
- 9.3.8.2. Financial Performance (Net Revenue/Sales/EBITDA/Gross Profit)
- 9.3.8.3. Product Benchmarking
- 9.3.8.4. Strategic Initiatives
- 9.3.9. New Chapter, Inc.
- 9.3.9.1. Overview
- 9.3.9.2. Financial Performance (Net Revenue/Sales/EBITDA/Gross Profit)
- 9.3.9.3. Product Benchmarking
- 9.3.9.4. Strategic Initiatives
- 9.3.10. Metagenics LLC
- 9.3.10.1. Overview
- 9.3.10.2. Financial Performance (Net Revenue/Sales/EBITDA/Gross Profit)
- 9.3.10.3. Product Benchmarking
- 9.3.10.4. Strategic Initiatives
- 9.3.1. Nature's Lab

