|
|
市場調査レポート
商品コード
1301008
歯科用レーザーの市場規模、シェア、動向分析レポート:用途別、最終用途別、製品別、地域別、セグメント予測、2023年~2030年Dental Lasers Market Size, Share & Trends Analysis Report By Application (Periodontics, Oral Surgery), By End-use (Hospitals, Dental Clinics), By Product (Dental Welding Laser, Dental Surgical Laser), By Region, And Segment Forecasts, 2023 - 2030 |
||||||
|
|
|||||||
カスタマイズ可能
|
|||||||


| 歯科用レーザーの市場規模、シェア、動向分析レポート:用途別、最終用途別、製品別、地域別、セグメント予測、2023年~2030年 |
|
出版日: 2023年06月07日
発行: Grand View Research
ページ情報: 英文 120 Pages
納期: 2~10営業日
|

- 全表示
- 概要
- 図表
- 目次
歯科用レーザー市場の成長と動向
GrandView Research, Inc.の新しいレポートによると、世界の歯科用レーザ市場規模は2030年までに5億8,910万米ドルに達し、予測期間中に7.6%のCAGRを記録すると予測されています。
業界を牽引する主な要因は、歯科疾患の有病率の上昇と口腔衛生に関する世界の意識の高まりです。市場開拓は、より効率的な歯科用レーザーシステムを製造する技術の進歩にも起因します。研究によると、ダイオードレーザー治療は歯肉出血、浮腫、痛み、炎症を大幅に軽減します。こうした技術開発により、レーザー歯科治療の精度、安全性、柔軟性が向上し、歯科専門家にとってより魅力的な選択肢となっています。新興経済国でのデンタルツーリズムの増加も、これらの国が安価な治療を提供することから、製品需要の原動力となっています。
フランスにおけるメディカル・ツーリズムの未来」と題された記事によると、米国では平均的な人の抜歯費用は保険なしで1本あたり約300米ドル。これに対してフランスでは、抜歯にかかる費用の目安は1本あたり約40米ドルで、必要な追加歯科治療の大部分もカバーできるのが一般的です。市場はパンデミックの影響を大きく受けた。歯科医院では、唾液を吹き飛ばして虫歯、歯垢、破折線の可視化を助けるために空気を利用しているが、この行為は微生物を含む可能性のあるエアロゾルを発生させる。政府は、COVID-19感染の拡大を抑えるため、歯科クリニックの閉鎖を義務付けるガイドラインを実施しました。
歯科用レーザー市場レポートハイライト
- 2022年、北米は、高度で低侵襲な歯科治療に重点を置いているため、44.5%の収益シェアで世界市場を独占した
- 製品別では、歯科手術用レーザーが2022年の市場を独占し、89.8%の収益シェアを占める
- 歯科用外科レーザは、外科処置中に精度と制御を強化します。これ別歯科医は、健康な組織を温存しながら、病気や損傷を受けた組織を正確にターゲットにして除去することができ、その結果、手術結果が改善され、治癒時間が短縮されます。
- 口腔衛生状態の悪化や不健康なライフスタイルが原因で、歯肉炎や歯周炎などの歯周病が多発しているため、2022年には歯周病アプリケーション分野が17.8%の売上シェアで市場を独占しました。
- 歯科クリニックの最終用途セグメントは、世界の産業を支配し、2022年に54.0%の売上高シェアを占めました。
目次
第1章 調査手法と範囲
- 市場セグメンテーションと範囲
- 調査手法
- 情報調達
- 情報またはデータ分析
- 市場の形成と検証
- モデル詳細
- 二次情報のリスト
- 一次情報のリスト
- 目的
第2章 エグゼクティブサマリー
- 市場の見通し
- セグメントの見通し
- 競合考察
第3章 世界の歯科用レーザー市場の変数、動向、範囲
- 市場系統の見通し
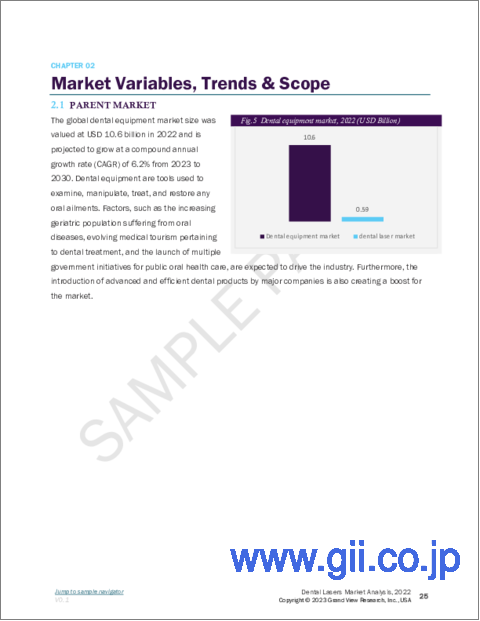
- 親市場の見通し
- 関連/補助的な市場見通し
- 普及と成長の見通しマッピング
- 業界のバリューチェーン分析
- 償還の枠組み
- 市場力学
- 市場促進要因分析
- 市場抑制要因分析
- 歯科用レーザー市場分析ツール
- 業界分析- ポーターの分析
- PESTEL分析
- 主要取引と戦略的提携の分析
- 市場参入戦略
第4章 歯科用レーザー市場:製品の推定・動向分析
- 定義と範囲
- 製品市場シェア、2022年および2030年
- セグメントダッシュボード
- 製品別の世界の歯科用レーザー市場の見通し
- 以下の市場規模、予測および動向分析、2018年から2030年まで
- 歯科外科用レーザー
- 歯科用溶接レーザー
第5章 歯科用レーザー市場:用途の推定・動向分析
- 定義と範囲
- 用途市場シェア、2022年および2030年
- セグメントダッシュボード
- 用途別の世界の歯科用レーザー市場の見通し
- 以下の市場規模、予測および動向分析、2018年から2030年まで
- 保存歯科
- 歯内療法
- 口腔外科
- インプラント
- インプラント周囲炎
- 歯周治療
- 歯のホワイトニング
第6章 歯科用レーザー市場:最終用途の推定・動向分析
- 定義と範囲
- 最終用途市場シェア、2022年および2030年
- セグメントダッシュボード
- 最終用途別の世界の歯科用レーザー市場の見通し
- 以下の市場規模、予測および動向分析、2018年から2030年まで
- 病院
- 歯科医院
- その他
第7章 世界の歯科用レーザー市場:地域の推定・動向分析
- 地域市場シェア分析、2022年および2030年
- 地域市場ダッシュボード
- 世界の地域市場のスナップショット
- 地域市場シェアと主要企業、2020年
- SWOT分析、要因別(政治・法律、経済・技術)
- 北米
- 欧州
- アジア太平洋地域
- ラテンアメリカ
- 中東とアフリカ
- 市場規模、予測、数量および動向分析、2018年から2030年
- 北米
- 市場推計・予測、2018~2030年(収益)
- 米国
- カナダ
- 欧州
- 英国
- ドイツ
- フランス
- イタリア
- スペイン
- スウェーデン
- ノルウェー
- デンマーク
- アジア太平洋地域
- 中国
- 日本
- インド
- オーストラリア
- タイ
- 韓国
- ラテンアメリカ
- ブラジル
- メキシコ
- アルゼンチン
- MEA
- サウジアラビア
- 南アフリカ
- アラブ首長国連邦
- クウェート
第8章 競合情勢
- 主要市場参入企業による最近の動向と影響分析
- 企業/競合の分類
- イノベーター
- 企業プロファイル
- ヒートマップ分析
- Biolase, Inc.
- Fotona
- Gigaalaser Group
- IPG Photonics corporation
- CAO Groups, Inc.
- Kavo Dental (Envista)
- Dentsply Sirona Inc
- Lumenis
List of Tables
- Table 1 List of secondary sources
- Table 2 List of abbreviations
List of Figures
- Fig. 1 Market research process
- Fig. 2 Data triangulation techniques
- Fig. 3 Primary research pattern
- Fig. 4 Market research approaches
- Fig. 5 QFD modeling for market share assessment
- Fig. 6 Market formulation & validation
- Fig. 7 Dental Lasers Market : market outlook
- Fig. 8 Dental Lasers Market competitive insights
- Fig. 9 Parent market outlook
- Fig. 10 Related/ancillary market outlook
- Fig. 11 Industry value chain analysis
- Fig. 12 Dental Lasers Market driver impact
- Fig. 13 Dental Lasers Market restraint impact
- Fig. 14 Dental Lasers Market strategic initiatives analysis
- Fig. 15 Dental Lasers Market: product movement analysis
- Fig. 16 Dental Lasers Market: product outlook and key takeaways
- Fig. 17 Dental Surgical Lasers market estimates and forecast, 2018 - 2030
- Fig. 18 Dental Welding Lasers market estimates and forecast, 2018 - 2030
- Fig. 19 Dental Lasers Market: Application movement analysis
- Fig. 20 Dental Lasers Market: Application outlook and key takeaways
- Fig. 21 Conservative dentistry market estimates and forecast, 2018 - 2030
- Fig. 22 Endodontic treatment market estimates and forecast, 2018 - 2030
- Fig. 23 Oral surgery market estimates and forecast, 2018 - 2030
- Fig. 24 Implantology surgery market estimates and forecast, 2018 - 2030
- Fig. 25 Periodontics market estimates and forecast, 2018 - 2030
- Fig. 26 Peri-implantitis market estimates and forecast, 2018 - 2030
- Fig. 27 Tooth whitening market estimates and forecast, 2018 - 2030
- Fig. 28 Dental Lasers Market: end-use movement analysis
- Fig. 29 Dental Lasers Market: end-use outlook and key takeaways
- Fig. 30 Hospitals market estimates and forecast, 2018 - 2030
- Fig. 31 Dental Clinics market estimates and forecast, 2018 - 2030
- Fig. 32 Others market estimates and forecast, 2018 - 2030
- Fig. 33 Dental Lasers Market: regional movement analysis
- Fig. 34 Dental Lasers Market: regional outlook and key takeaways
- Fig. 35 Global market share and leading players
- Fig. 36 North America market share and leading players
- Fig. 37 Europe market share and leading players
- Fig. 38 Asia Pacific market share and leading players
- Fig. 39 Latin America market share and leading players
- Fig. 40 Middle East & Africa market share and leading players
- Fig. 41 North America: SWOT
- Fig. 42 Europe SWOT
- Fig. 43 Asia Pacific SWOT
- Fig. 44 Latin America SWOT
- Fig. 45 MEA SWOT
- Fig. 46 North America, by country
- Fig. 48 North America market estimates and forecast, 2018 - 2030
- Fig. 49 U.S. Country Dynamics
- Fig. 50 U.S. market estimates and forecast, 2018 - 2030
- Fig. 51 Canada Country Dynamics
- Fig. 52 Canada market estimates and forecast, 2018 - 2030
- Fig. 54 Europe. market estimates and forecast, 2018 - 2030
- Fig. 55 UK Country Dynamics
- Fig. 56 UK market estimates and forecast, 2018 - 2030
- Fig. 58 Germany market estimates and forecast, 2018 - 2030
- Fig. 59 France Country Dynamics
- Fig. 60 France market estimates and forecast, 2018 - 2030
- Fig. 61 Italy Country Dynamics
- Fig. 62 Italy market estimates and forecast, 2018 - 2030
- Fig. 63 Spain Country Dynamics
- Fig. 64 Spain market estimates and forecast, 2018 - 2030
- Fig. 65 Sweden Country Dynamics
- Fig. 66 Sweden market estimates and forecast, 2018 - 2030
- Fig. 67 Norway Country Dynamics
- Fig. 68 Norway market estimates and forecast, 2018 - 2030
- Fig. 69 Denmark Country Dynamics
- Fig. 70 Denmark market estimates and forecast, 2018 - 2030
- Fig. 72 Asia Pacific market estimates and forecast, 2018 - 2030
- Fig. 73 China Country Dynamics
- Fig. 74 China market estimates and forecast, 2018 - 2030
- Fig. 75 Japan Country Dynamics
- Fig. 76 Japan market estimates and forecast, 2018 - 2030
- Fig. 77 India Country Dynamics
- Fig. 78 India market estimates and forecast, 2018 - 2030
- Fig. 79 Australia Country Dynamics
- Fig. 80 Australia market estimates and forecast, 2018 - 2030
- Fig. 81 Thailand Country Dynamics
- Fig. 82 Thailand market estimates and forecast, 2018 - 2030
- Fig. 83 South Korea Country Dynamics
- Fig. 84 South Korea market estimates and forecast, 2018 - 2030
- Fig. 86 Latin America market estimates and forecast, 2018 - 2030
- Fig. 87 Brazil Country Dynamics
- Fig. 88 Brazil market estimates and forecast, 2018 - 2030
- Fig. 89 Mexico Country Dynamics
- Fig. 90 Mexico market estimates and forecast, 2018 - 2030
- Fig. 91 Argentina Country Dynamics
- Fig. 92 Argentina market estimates and forecast, 2018 - 2030
- Fig. 94 Middle East and Africa. market estimates and forecast, 2018 - 2030
- Fig. 95 Saudi Arabia Country Dynamics
- Fig. 96 Saudi Arabia market estimates and forecast, 2018 - 2030
- Fig. 97 South Africa Country Dynamics
- Fig. 98 South Africa market estimates and forecast, 2018 - 2030
- Fig. 99 UAE Country Dynamics
- Fig. 100 UAE market estimates and forecast, 2018 - 2030
- Fig. 101 Kuwait Country Dynamics
- Fig. 102 Kuwait market estimates and forecast, 2018 - 2030
- Fig. 103 Participant categorization- Dental Lasers Market
- Fig. 104 Market share of key market players- Dental Lasers Market
Dental Lasers Market Growth & Trends
The global dental lasers market size is expected to reach USD 589.1 million by 2030, registering a CAGR of 7.6% over the forecast period, according to a new report by Grand View Research, Inc. The primary factor driving the industry is the rising prevalence of dental disorders and growing global awareness regarding oral hygiene. The development of the market can also be attributed to technological advancements that manufacture more efficient dental laser systems. Studies show that diode laser treatment significantly reduces gum bleeding, edema, pain, and inflammation. These technical developments have increased the precision, safety, and flexibility of laser dentistry, making it a more enticing option for dental professionals. Increasing dental tourism in emerging economies also drives product demand as these countries provide inexpensive treatments.
According to an article titled "The Future of Medical Tourism in France," the cost of tooth extraction in the United States for an average person is approximately USD 300 per tooth without insurance. In contrast, in France, the estimated cost for tooth extraction is around USD 40 per tooth, which typically covers the majority of necessary additional dental work as well. The market was significantly impacted by the pandemic. Dental clinics utilize air to aid in the visibility of cavities, plaque, and fracture lines by blowing away saliva, however, this practice also generates aerosols that may contain microbes. The government implemented guidelines into place requiring the closure of dental clinics to reduce the spread of COVID-19 infection.
Dental Lasers Market Report Highlights
- In 2022, North America dominated the global market with a revenue share of 44.5% due to the emphasis on advanced and minimally invasive dental treatments
- By product, dental surgical lasers dominated the market in 2022 and accounted for a revenue share of 89.8%
- Dental surgical lasers provide enhanced precision and control during surgical procedures. This allows dentists to precisely target and remove diseased or damaged tissue while preserving healthy tissue, resulting in improved surgical outcomes and faster healing times
- The periodontics application segment dominated the market with a revenue share of 17.8% in 2022 due to the high prevalence of periodontal diseases, such as gingivitis and periodontitis, caused due to poor oral hygiene and unhealthy lifestyle
- The dental clinics end-use segment dominated the global industry and accounted for a revenue share of 54.0% in 2022
Table of Contents
Chapter 1. Methodology and Scope
- 1.1. Market Segmentation & Scope
- 1.1.1. Product
- 1.1.2. Application
- 1.1.3. End-use
- 1.1.4. Regional scope
- 1.1.5. Estimates and forecast timeline
- 1.2. Research Methodology
- 1.3. Information Procurement
- 1.3.1. Purchased database
- 1.3.2. GVR's internal database
- 1.3.3. Secondary sources
- 1.3.4. Primary research
- 1.3.5. Details of primary research
- 1.3.6. Data for primary interviews in North America
- 1.3.7. Data for primary interviews in Europe
- 1.3.8. Data for primary interviews in Asia Pacific
- 1.3.9. Data for primary interviews in Latin America
- 1.3.10. Data for Primary interviews in MEA
- 1.4. Information or Data Analysis
- 1.4.1. Data analysis models
- 1.5. Market Formulation & Validation
- 1.6. Model Details
- 1.6.1. Volume price analysis (Model 2)
- 1.6.2. Approach 2: Volume price analysis
- 1.7. List of Secondary Sources
- 1.8. List of Primary Sources
- 1.9. Objectives
- 1.9.1. Objective 1
- 1.9.2. Objective 2
Chapter 2. Executive Summary
- 2.1. Market Outlook
- 2.2. Segment Outlook
- 2.2.1. Product outlook
- 2.2.2. Application outlook
- 2.2.3. End-use outlook
- 2.2.4. Regional outlook
- 2.3. Competitive Insights
Chapter 3. Global Dental Lasers Market Variables, Trends & Scope
- 3.1. Market Lineage Outlook
- 3.1.1. Parent market outlook
- 3.1.2. Related/ancillary market outlook
- 3.2. Penetration & Growth Prospect Mapping
- 3.3. Industry Value Chain Analysis
- 3.3.1. Reimbursement framework
- 3.4. Market Dynamics
- 3.4.1. Market driver analysis
- 3.4.2. Market restraint analysis
- 3.5. Dental Lasers Market Analysis Tools
- 3.5.1. Industry Analysis - Porter's
- 3.5.1.1. Supplier power
- 3.5.1.2. Buyer power
- 3.5.1.3. Substitution threat
- 3.5.1.4. Threat of new entrant
- 3.5.1.5. Competitive rivalry
- 3.5.2. PESTEL Analysis
- 3.5.2.1. Political landscape
- 3.5.2.2. Technological landscape
- 3.5.2.3. Economic landscape
- 3.5.3. Major Deals & Strategic Alliances Analysis
- 3.5.4. Market Entry Strategies
- 3.5.1. Industry Analysis - Porter's
Chapter 4. Dental Lasers Market: Product Estimates & Trend Analysis
- 4.1. Definitions and Scope
- 4.1.1. Dental Surgical Lasers
- 4.1.2. Dental Welding Lasers
- 4.2. Product Market Share, 2022 & 2030
- 4.3. Segment Dashboard
- 4.4. Global Dental Lasers Market by product Outlook
- 4.5. Market Size & Forecasts and Trend Analyses, 2018 to 2030 for the following
- 4.5.1. Dental Surgical Lasers
- 4.5.1.1. Dental surgical lasers estimates and forecast 2018 to 2030 (USD Million)
- 4.5.2. Dental Welding Lasers
- 4.5.2.1. Dental welding lasers market estimates and forecast 2018 to 2030 (USD Million
- 4.5.1. Dental Surgical Lasers
Chapter 5. Dental Lasers Market : Application Estimates & Trend Analysis
- 5.1. Definitions and Scope
- 5.1.1. Conservative Dentistry
- 5.1.2. Endodontic Treatment
- 5.1.3. Oral Surgery
- 5.1.4. Implantology
- 5.1.5. Peri-implantitis
- 5.1.6. Periodontics
- 5.1.7. Tooth Whitening
- 5.2. Application Market Share, 2022 & 2030
- 5.3. Segment Dashboard
- 5.4. Global Dental Lasers Market by Application Outlook
- 5.5. Market Size & Forecasts and Trend Analyses, 2018 to 2030 for the following
- 5.5.1. Conservative Dentistry
- 5.5.1.1. Conservative dentistry market estimates and forecast 2018 to 2030 (USD Million)
- 5.5.2. Endodontic Treatment
- 5.5.2.1. Endodontic treatment market estimates and forecast 2018 to 2030 (USD Million)
- 5.5.3. Oral Surgery
- 5.5.3.1. Oral surgery market estimates and forecast 2018 to 2030 (USD Million)
- 5.5.4. Implantology
- 5.5.4.1. Implantology market estimates and forecast 2018 to 2030 (USD Million)
- 5.5.5. Peri-implantitis
- 5.5.5.1. Peri-Implantitis market estimates and forecast 2018 to 2030 (USD Million)
- 5.5.6. Periodontics
- 5.5.6.1. Periodontics market estimates and forecast 2018 to 2030 (USD Million)
- 5.5.7. Tooth Whitening
- 5.5.7.1. Tooth whitening market estimates and forecast 2018 to 2030 (USD Million)
- 5.5.1. Conservative Dentistry
Chapter 6. Dental Lasers Market : End-Use Estimates & Trend Analysis
- 6.1. Definitions and Scope
- 6.1.1. Hospitals
- 6.1.2. Dental Clinics
- 6.1.3. Others
- 6.2. End-use Market Share, 2022 & 2030
- 6.3. Segment Dashboard
- 6.4. Global Dental Lasers Market by End-Use Outlook
- 6.5. Market Size & Forecasts and Trend Analyses, 2018 to 2030 for the following
- 6.5.1. Hospitals
- 6.5.1.1. Hospitals market estimates and forecast 2018 to 2030 (USD Million)
- 6.5.2. Dental clinics
- 6.5.2.1. Dental clinics centers market estimates and forecast 2018 to 2030 (USD Million)
- 6.5.3. Others
- 6.5.3.1. Others market estimates and forecast 2018 to 2030 (USD Million)
- 6.5.1. Hospitals
Chapter 7. Global Dental Lasers Market: Regional Estimates & Trend Analysis
- 7.1. Regional market share analysis, 2022 & 2030
- 7.2. Regional Market Dashboard
- 7.3. Global Regional Market Snapshot
- 7.4. Regional Market Share and Leading Players, 2020
- 7.4.1. North America
- 7.4.2. Europe
- 7.4.3. Asia Pacific
- 7.4.4. Latin America
- 7.4.5. Middle East and Africa
- 7.5. SWOT Analysis, by Factor (Political & Legal, Economic and Technological)
- 7.5.1. North America
- 7.5.2. Europe
- 7.5.3. Asia Pacific
- 7.5.4. Latin America
- 7.5.5. Middle East and Africa
- 7.6. Market Size, & Forecasts, Volume and Trend Analysis, 2018 to 2030:
- 7.7. North America
- 7.7.1. Market estimates and forecast, 2018 - 2030 (Revenue, USD Million)
- 7.7.2. U.S.
- 7.7.2.1. Market estimates and forecast, 2018 - 2030 (Revenue, USD Million)
- 7.7.3. Canada
- 7.7.3.1. Market estimates and forecast, 2018 - 2030 (Revenue, USD Million)
- 7.8. Europe
- 7.8.1. UK
- 7.8.1.1. Market estimates and forecast, 2018 - 2030 (Revenue, USD Million)
- 7.8.2. Germany
- 7.8.2.1. Market estimates and forecast, 2018 - 2030 (Revenue, USD Million)
- 7.8.3. France
- 7.8.3.1. Market estimates and forecast, 2018 - 2030 (Revenue, USD Million)
- 7.8.4. Italy
- 7.8.4.1. Market estimates and forecast, 2018 - 2030 (Revenue, USD Million)
- 7.8.5. Spain
- 7.8.5.1. Market estimates and forecast, 2018 - 2030 (Revenue, USD Million)
- 7.8.6. Sweden
- 7.8.6.1. Market estimates and forecast, 2018 - 2030 (Revenue, USD Million)
- 7.8.7. Norway
- 7.8.7.1. Market estimates and forecast, 2018 - 2030 (Revenue, USD Million)
- 7.8.8. Denmark
- 7.8.8.1. Market estimates and forecast, 2018 - 2030 (Revenue, USD Million)
- 7.8.1. UK
- 7.9. Asia Pacific
- 7.9.1. China
- 7.9.1.1. Market estimates and forecast, 2018 - 2030 (Revenue, USD Million)
- 7.9.2. Japan
- 7.9.2.1. Market estimates and forecast, 2018 - 2030 (Revenue, USD Million)
- 7.9.3. India
- 7.9.3.1. Market estimates and forecast, 2018 - 2030 (Revenue, USD Million)
- 7.9.4. Australia
- 7.9.4.1. Market estimates and forecast, 2018 - 2030 (Revenue, USD Million)
- 7.9.5. Thailand
- 7.9.5.1. Market estimates and forecast, 2018 - 2030 (Revenue, USD Million)
- 7.9.6. South Korea
- 7.9.6.1. Market estimates and forecast, 2018 - 2030 (Revenue, USD Million)
- 7.9.1. China
- 7.10. Latin America
- 7.10.1. Brazil
- 7.10.1.1. Market estimates and forecast, 2018 - 2030 (Revenue, USD Million)
- 7.10.2. Mexico
- 7.10.2.1. Market estimates and forecast, 2018 - 2030 (Revenue, USD Million)
- 7.10.3. Argentina
- 7.10.3.1. Market estimates and forecast, 2018 - 2030 (Revenue, USD Million)
- 7.10.1. Brazil
- 7.11. MEA
- 7.11.1. Saudi Arabia
- 7.11.1.1. Market estimates and forecast, 2018 - 2030 (Revenue, USD Million)
- 7.11.2. South Africa
- 7.11.2.1. Market estimates and forecast, 2018 - 2030 (Revenue, USD Million)
- 7.11.3. UAE
- 7.11.3.1. Market estimates and forecast, 2018 - 2030 (Revenue, USD Million)
- 7.11.4. Kuwait
- 7.11.4.1. Market estimates and forecast, 2018 - 2030 (Revenue, USD Million)
- 7.11.1. Saudi Arabia
Chapter 8. Competitive Landscape
- 8.1. Recent Developments & Impact Analysis, By Key Market Participants
- 8.2. Company/Competition Categorization
- 8.2.1. Innovators
- 8.3. Company Profiles
- 8.4. Heat Map Analysis
- 8.4.1. Biolase, Inc.
- 8.4.1.1. Company overview
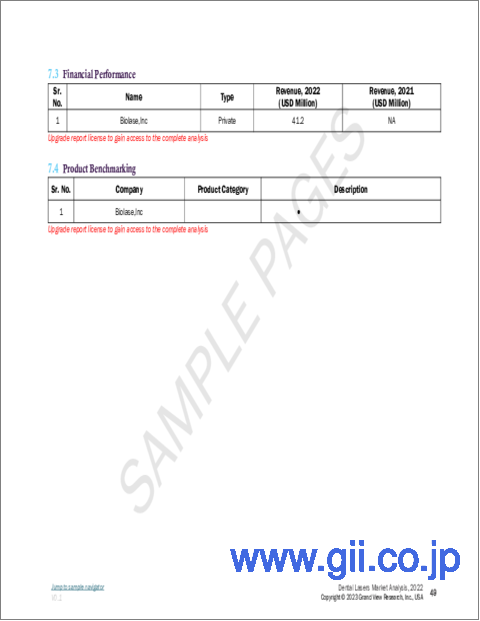
- 8.4.1.2. Financial performance
- 8.4.1.3. Product benchmarking
- 8.4.1.4. Strategic initiatives
- 8.4.2. Fotona
- 8.4.2.1. Company overview
- 8.4.2.2. Financial performance
- 8.4.2.3. Product benchmarking
- 8.4.2.4. Strategic initiatives
- 8.4.3. Gigaalaser Group
- 8.4.3.1. Company overview
- 8.4.3.2. Financial performance
- 8.4.3.3. Product benchmarking
- 8.4.3.4. Strategic initiatives
- 8.4.4. IPG Photonics corporation
- 8.4.4.1. Company overview
- 8.4.4.2. Financial performance
- 8.4.4.3. Product benchmarking
- 8.4.4.4. Strategic initiatives
- 8.4.5. CAO Groups, Inc.
- 8.4.5.1. Company overview
- 8.4.5.2. Financial performance
- 8.4.5.3. Product benchmarking
- 8.4.5.4. Strategic initiatives
- 8.4.6. Kavo Dental (Envista)
- 8.4.6.1. Company overview
- 8.4.6.2. Financial performance
- 8.4.6.3. Product benchmarking
- 8.4.6.4. Strategic initiatives
- 8.4.7. Dentsply Sirona Inc
- 8.4.7.1. Company overview
- 8.4.7.2. Financial performance
- 8.4.7.3. Product benchmarking
- 8.4.7.4. Strategic initiatives
- 8.4.8. Lumenis
- 8.4.8.1. Company overview
- 8.4.8.2. Financial performance
- 8.4.8.3. Product benchmarking
- 8.4.8.4. Strategic initiatives
- 8.4.1. Biolase, Inc.