|
|
市場調査レポート
商品コード
1300992
DNA合成装置の市場規模、シェア、動向分析レポート:タイプ別、用途別、最終用途別、地域別、セグメント予測、2023年~2030年DNA Synthesizer Market Size, Share & Trends Analysis Report By Type (Benchtop DNA Synthesizers, Large-scale DNA Synthesizers), By Application, By End-use, By Region, And Segment Forecasts, 2023 - 2030 |
||||||
|
|
|||||||
カスタマイズ可能
|
|||||||


| DNA合成装置の市場規模、シェア、動向分析レポート:タイプ別、用途別、最終用途別、地域別、セグメント予測、2023年~2030年 |
|
出版日: 2023年06月06日
発行: Grand View Research
ページ情報: 英文 180 Pages
納期: 2~10営業日
|

- 全表示
- 概要
- 図表
- 目次
DNA合成装置市場の成長と動向
GrandView Research, Inc.の最新レポートによると、DNA合成装置の世界市場規模は2023年から2030年にかけて14.42%のCAGRで拡大し、2030年には6億6,420万米ドルに達すると予測されています。
創薬や研究開発、遺伝子治療、遺伝子研究など幅広い用途で合成DNAへの関心が高まっていることが、合成装置の需要を促進する主な要因です。さらに、合成技術と自動化の進歩が市場の成長をさらに促進すると予測されています。さらに、効率的なシンセサイザーの開発という点で、市場プレーヤーが行った様々な有機的・無機的開拓も業界拡大を支える要因の一つです。例えば、K&A Labs GmbHは、最大収量を得ることができるHシリーズDNA合成装置を開発しました。
業界全体における合成核酸の需要の高まりが、市場プレイヤーを合成装置への投資に駆り立てています。例えば、2022年4月にAnsa Biotechnologiesは6,800万米ドルを調達し、カスタマイズ可能なDNA合成サービスを開始しました。さらに、これらの資金調達は同社の遺伝子合成能力の強化に役立っています。同様に、DNAスクリプトは2022年6月に8,832万米ドルを調達し、迅速合成プラットフォームを研究室に導入しました。この資金調達は、同社のベンチトップDNA合成装置の商業的発売を支援しました。
この業界は競争が激しく、市場プレーヤーはより高速で効率的な核酸合成機能を提供できる新しく革新的な合成機の開拓に力を入れています。例えば、2022年9月、Codex DNA, Inc.は、合成生物学のワークフローに革命を起こすために開発された新しいハイスループットプラットフォームであるBioXp 9600システムの商業リリースと初出荷を発表しました。さらに、企業間の協力や提携はますます一般的になってきており、市場の成長とイノベーションを促進するために、互いの能力や強みを活用しようとしています。
さらに、製薬会社やバイオテクノロジー企業におけるDNA合成装置やその他の合成プラットフォームに対する需要の急激な高まりが、市場を大きく牽引しています。また、研究開発活動の活発化、政府による支援法整備、希少疾患に対する新規治療レジメンの需要増加が、業界の成長を支えています。
DNA合成装置市場レポートハイライト
- タイプ別では、研究開発投資の増加、カスタム合成機能に対する需要の高まり、幅広いエンドユーザーからの旺盛な需要により、ベンチトップDNA合成装置分野が2022年に72.72%のシェアを占めました。
- 用途別では、創薬・医薬品開発分野が2022年に48.11%のシェアで業界を支配しました。創薬におけるDNA合成装置の幅広い用途、技術の進歩、ハイスループット技術の採用の高まり、多数のプレイヤーの存在などが原因です。
- 最終用途別では、製薬・バイオテクノロジー企業が52.37%のシェアを占め、2022年の市場を独占しました。同分野の高成長は、新規遺伝子治療法開発のための合成核酸の使用増加別ものです。一方、学術・研究機関セグメントは高成長が予測されています。
- 北米は、高度に発達したヘルスケア・インフラと有利な政府政策により、2022年には39.22%のシェアで市場を独占しました。
目次
第1章 調査手法と範囲
- 情報調達
- 情報またはデータ分析
- 市場範囲とセグメントの定義
- 市場モデル
- 企業市場シェア別市場調査
- 地域分析
第2章 エグゼクティブサマリー
- 市場スナップショット
- セグメントのスナップショット
- 競合情勢のスナップショット
第3章 市場変数、動向、および範囲
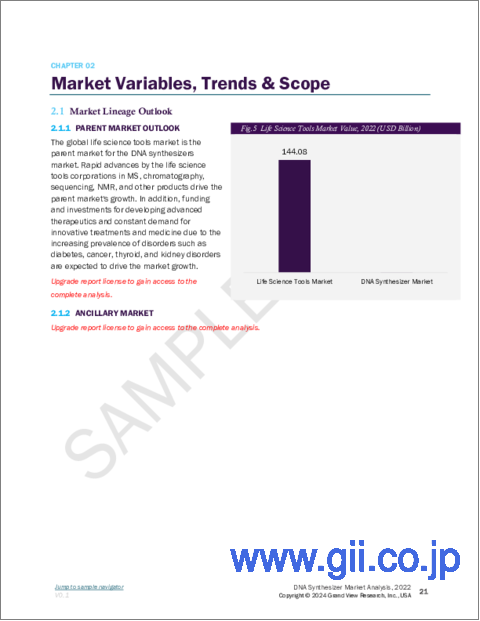
- 市場系統の見通し
- 親市場の見通し
- 関連/補助的な市場見通し
- 市場力学
- 市場促進要因分析
- 市場抑制要因分析
- 業界分析ツール
- ポーターのファイブフォース分析
- PESTEL分析
- COVID-19感染症の影響分析
第4章 タイプのビジネス分析
- DNA合成装置市場:タイプ変動分析
- ベンチトップDNA合成装置
- 大型DNA合成装置
第5章 用途のビジネス分析
- DNA合成装置市場:用途の変動分析
- 創薬と開発
- 遺伝子工学
- 臨床診断
第6章 最終用途のビジネス分析
- DNA合成装置市場:最終用途の変動分析
- 学術研究機関
- 製薬およびバイオテクノロジー企業
- 臨床検査室
第7章 地域のビジネス分析
- 地域別:DNA合成装置の市場シェア、2022年および2030年
- 北米
- 北米のDNA合成装置市場、2018~2030年
- 米国
- カナダ
- 欧州
- 欧州のDNA合成装置市場、2018~2030年
- 英国
- ドイツ
- フランス
- イタリア
- スペイン
- デンマーク
- スウェーデン
- ノルウェー
- アジア太平洋地域
- アジア太平洋地域のDNA合成装置市場、2018~2030年
- 日本
- 中国
- インド
- オーストラリア
- タイ
- 韓国
- ラテンアメリカ
- ラテンアメリカのDNA合成装置市場、2018~2030年
- ブラジル
- メキシコ
- アルゼンチン
- 中東・アフリカ
- 中東・アフリカのDNA合成装置市場、2018~2030年
- 南アフリカ
- サウジアラビア
- アラブ首長国連邦
- クウェート
第8章 競合情勢
- 企業の分類
- 戦略マッピング
- 企業の市場シェア分析、2022年
- 企業プロファイル・一覧表
- Danaher
- Twist Bioscience
- Kilobaser
- LGC Limited
- CSBio
- K&A Labs GmbH
- DNA Script
- OligoMaker ApS
- PolyGen GmbH
- Biolytic Lab Performance Inc.
List of Tables
- Table 1 List of abbreviations
- Table 2 Global DNA synthesizer market, by type, 2018 - 2030 (USD Million)
- Table 3 Global DNA synthesizer market, by application, 2018 - 2030 (USD Million)
- Table 4 Global DNA synthesizer market, by end use, 2018 - 2030 (USD Million)
- Table 5 Global DNA synthesizer market, by end use, 2018 - 2030 (USD Million)
- Table 6 Global DNA synthesizer market, by region, 2018 - 2030 (USD Million)
- Table 7 North America DNA synthesizer market, by country, 2018 - 2030 (USD Million)
- Table 8 North America DNA synthesizer market, by type, 2018 - 2030 (USD Million)
- Table 9 North America DNA synthesizer market, by application, 2018 - 2030 (USD Million)
- Table 10 North America DNA synthesizer sequencing market, by end use, 2018 - 2030 (USD Million)
- Table 11 U.S. DNA synthesizer market, by type, 2018 - 2030 (USD Million)
- Table 12 U.S. DNA synthesizer market, by application, 2018 - 2030 (USD Million)
- Table 13 U.S. DNA synthesizer Market, by end use, 2018 - 2030 (USD Million)
- Table 14 Canada DNA synthesizer market, by type, 2018 - 2030 (USD Million)
- Table 15 Canada DNA synthesizer market, by application, 2018 - 2030 (USD Million)
- Table 16 Canada DNA synthesizer market, by end use, 2018 - 2030 (USD Million)
- Table 17 Europe DNA synthesizer market, by country, 2018 - 2030 (USD Million)
- Table 18 Europe DNA synthesizer market, by type, 2018 - 2030 (USD Million)
- Table 19 Europe DNA synthesizer market, by application, 2018 - 2030 (USD Million)
- Table 20 Europe DNA synthesizer market, by end use, 2018 - 2030 (USD Million)
- Table 21 UK DNA synthesizer market, by type, 2018 - 2030 (USD Million)
- Table 22 UK DNA synthesizer market, by application, 2018 - 2030 (USD Million)
- Table 23 UK DNA synthesizer market, by end use, 2018 - 2030 (USD Million)
- Table 24 Germany DNA synthesizer market, by type, 2018 - 2030 (USD Million)
- Table 25 Germany DNA synthesizer market, by application, 2018 - 2030 (USD Million)
- Table 26 Germany DNA synthesizer market, by end use, 2018 - 2030 (USD Million)
- Table 27 France DNA synthesizer market, by type, 2018 - 2030 (USD Million)
- Table 28 France DNA synthesizer market, by application, 2018 - 2030 (USD Million)
- Table 29 France DNA synthesizer market, by end use, 2018 - 2030 (USD Million)
- Table 30 Italy DNA synthesizer market, by type, 2018 - 2030 (USD Million)
- Table 31 Italy DNA synthesizer market, by application, 2018 - 2030 (USD Million)
- Table 32 Italy DNA synthesizer market, by end use, 2018 - 2030 (USD Million)
- Table 33 Spain DNA synthesizer market, by type, 2018 - 2030 (USD Million)
- Table 34 Spain DNA synthesizer market, by application, 2018 - 2030 (USD Million)
- Table 35 Spain DNA synthesizer market, by end use, 2018 - 2030 (USD Million)
- Table 36 Denmark DNA synthesizer market, by type, 2018 - 2030 (USD Million)
- Table 37 Denmark DNA synthesizer market, by application, 2018 - 2030 (USD Million)
- Table 38 Denmark DNA synthesizer market, by end use, 2018 - 2030 (USD Million)
- Table 39 Sweden DNA synthesizer market, by type, 2018 - 2030 (USD Million)
- Table 40 Sweden DNA synthesizer market, by application, 2018 - 2030 (USD Million)
- Table 41 Sweden DNA synthesizer market, by end use, 2018 - 2030 (USD Million)
- Table 42 Norway DNA synthesizer market, by type, 2018 - 2030 (USD Million)
- Table 43 Norway DNA synthesizer market, by application, 2018 - 2030 (USD Million)
- Table 44 Norway DNA synthesizer market, by end use, 2018 - 2030 (USD Million)
- Table 45 Asia Pacific DNA synthesizer market, by country, 2018 - 2030 (USD Million)
- Table 46 Asia Pacific DNA synthesizer market, by type, 2018 - 2030 (USD Million)
- Table 47 Asia Pacific DNA synthesizer market, by application, 2018 - 2030 (USD Million)
- Table 48 Asia Pacific DNA synthesizer market, by end use, 2018 - 2030 (USD Million)
- Table 49 Japan DNA synthesizer market, by type, 2018 - 2030 (USD Million)
- Table 50 Japan DNA synthesizer market, by application, 2018 - 2030 (USD Million)
- Table 51 Japan DNA synthesizer market, by end use, 2018 - 2030 (USD Million)
- Table 52 China DNA synthesizer market, by type, 2018 - 2030 (USD Million)
- Table 53 China DNA synthesizer market, by application, 2018 - 2030 (USD Million)
- Table 54 China DNA synthesizer market, by end use, 2018 - 2030 (USD Million)
- Table 55 India DNA synthesizer market, by type, 2018 - 2030 (USD Million)
- Table 56 India DNA synthesizer market, by application, 2018 - 2030 (USD Million)
- Table 57 India DNA synthesizer market, by end use, 2018 - 2030 (USD Million)
- Table 58 Australia DNA synthesizer market, by type, 2018 - 2030 (USD Million)
- Table 59 Australia DNA synthesizer market, by application, 2018 - 2030 (USD Million)
- Table 60 Australia DNA synthesizer market, by end use, 2018 - 2030 (USD Million)
- Table 61 Thailand DNA synthesizer market, by type, 2018 - 2030 (USD Million)
- Table 62 Thailand DNA synthesizer market, by application, 2018 - 2030 (USD Million)
- Table 63 Thailand DNA synthesizer market, by end use, 2018 - 2030 (USD Million)
- Table 64 South Korea DNA synthesizer market, by type, 2018 - 2030 (USD Million)
- Table 65 South Korea DNA synthesizer market, by application, 2018 - 2030 (USD Million)
- Table 66 South Korea DNA synthesizer market, by end use, 2018 - 2030 (USD Million)
- Table 67 Latin America DNA synthesizer market, by country, 2018 - 2030 (USD Million)
- Table 68 Latin America DNA synthesizer market, by type, 2018 - 2030 (USD Million)
- Table 69 Latin America DNA synthesizer market, by application, 2018 - 2030 (USD Million)
- Table 70 Latin America DNA synthesizer market, by end use, 2018 - 2030 (USD Million)
- Table 71 Brazil DNA synthesizer market, by type, 2018 - 2030 (USD Million)
- Table 72 Brazil DNA synthesizer market, by application, 2018 - 2030 (USD Million)
- Table 73 Brazil DNA synthesizer market, by end use, 2018 - 2030 (USD Million)
- Table 74 Mexico DNA synthesizer market, by type, 2018 - 2030 (USD Million)
- Table 75 Mexico DNA synthesizer market, by application, 2018 - 2030 (USD Million)
- Table 76 Mexico DNA synthesizer market, by end use, 2018 - 2030 (USD Million)
- Table 77 Argentina DNA synthesizer market, by type, 2018 - 2030 (USD Million)
- Table 78 Argentina DNA synthesizer market, by application, 2018 - 2030 (USD Million)
- Table 79 Argentina DNA synthesizer market, by end use, 2018 - 2030 (USD Million)
- Table 80 Middle East & Africa DNA synthesizer market, by country, 2018 - 2030 (USD Million)
- Table 81 Middle East & Africa DNA synthesizer market, by type, 2018 - 2030 (USD Million)
- Table 82 Middle East & Africa DNA synthesizer market, by application, 2018 - 2030 (USD Million)
- Table 83 Middle East & Africa DNA synthesizer market, by end use, 2018 - 2030 (USD Million)
- Table 84 South Africa DNA synthesizer market, by type, 2018 - 2030 (USD Million)
- Table 85 South Africa DNA synthesizer market, by application, 2018 - 2030 (USD Million)
- Table 86 South Africa DNA synthesizer market, by end use, 2018 - 2030 (USD Million)
- Table 87 Saudi Arabia DNA synthesizer market, by type, 2018 - 2030 (USD Million)
- Table 88 Saudi Arabia DNA synthesizer market, by application, 2018 - 2030 (USD Million)
- Table 89 Saudi Arabia DNA synthesizer market, by end use, 2018 - 2030 (USD Million)
- Table 90 UAE DNA synthesizer market, by type, 2018 - 2030 (USD Million)
- Table 91 UAE DNA synthesizer market, by application, 2018 - 2030 (USD Million)
- Table 92 UAE DNA synthesizer market, by end use, 2018 - 2030 (USD Million)
- Table 93 Kuwait DNA synthesizer market, by type, 2018 - 2030 (USD Million)
- Table 94 Kuwait DNA synthesizer market, by application, 2018 - 2030 (USD Million)
- Table 95 Kuwait DNA synthesizer market, by end use, 2018 - 2030 (USD Million)
List of Figures
- Fig. 1 Market research process
- Fig. 2 Information procurement
- Fig. 3 Primary research pattern
- Fig. 4 Market research approaches
- Fig. 5 Value chain-based sizing & forecasting
- Fig. 6 Market formulation & validation
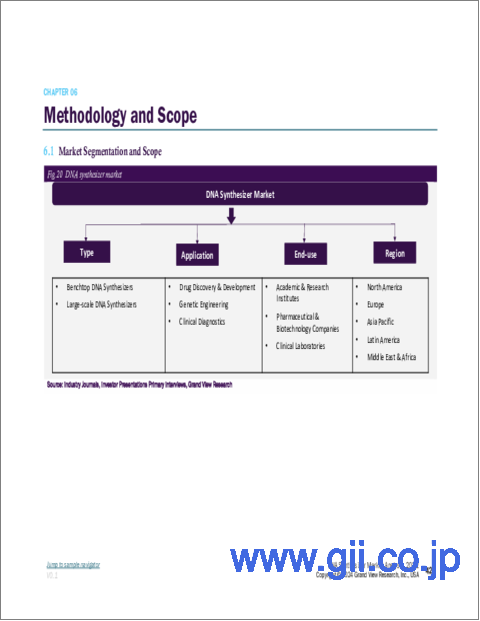
- Fig. 7 DNA synthesizer market segmentation
- Fig. 8 Market snapshot, 2022
- Fig. 9 Market trends & outlook
- Fig. 10 Market driver relevance analysis (current & future impact)
- Fig. 11 Market restraint relevance analysis (current & future impact)
- Fig. 12 PESTEL analysis
- Fig. 13 Porter's five forces analysis
- Fig. 14 Global DNA synthesizer market: Type movement analysis
- Fig. 15 Global DNA synthesizer market, for benchtop DNA synthesizers, 2018 - 2030 (USD Million)
- Fig. 16 Global DNA synthesizer market, for large-scale DNA synthesizers, 2018 - 2030 (USD Million)
- Fig. 17 Global DNA synthesizer market: Application movement analysis
- Fig. 18 Global DNA synthesizer market, for drug discovery & development, 2018 - 2030 (USD Million)
- Fig. 19 Global DNA synthesizer market, for genetic engineering, 2018 - 2030 (USD Million)
- Fig. 20 Global DNA synthesizer market, for clinical diagnostics, 2018 - 2030 (USD Million)
- Fig. 21 Global DNA synthesizer market: End use movement analysis
- Fig. 22 Global DNA synthesizer market, for academic & research institutes, 2018 - 2030 (USD Million)
- Fig. 23 Global DNA synthesizer market, for pharmaceutical & biotechnology companies, 2018 - 2030 (USD Million)
- Fig. 24 Global DNA synthesizer market, for clinical laboratories, 2018 - 2030 (USD Million)
- Fig. 25 Regional marketplace: Key takeaways
- Fig. 26 Regional outlook, 2022 & 2030
- Fig. 27 Global DNA synthesizer market: Region movement analysis
- Fig. 28 North America DNA synthesizer market, 2018 - 2030 (USD Million)
- Fig. 29 U.S. DNA synthesizer market, 2018 - 2030 (USD Million)
- Fig. 30 Canada DNA synthesizer market, 2018 - 2030 (USD Million)
- Fig. 31 Europe DNA synthesizer market, 2018 - 2030 (USD Million)
- Fig. 32 Germany DNA synthesizer market, 2018 - 2030 (USD Million)
- Fig. 33 UK DNA synthesizer market, 2018 - 2030 (USD Million)
- Fig. 34 France DNA synthesizer market, 2018 - 2030 (USD Million)
- Fig. 35 Italy DNA synthesizer market, 2018 - 2030 (USD Million)
- Fig. 36 Spain DNA synthesizer market, 2018 - 2030 (USD Million)
- Fig. 37 Denmark DNA synthesizer market, 2018 - 2030 (USD Million)
- Fig. 38 Sweden DNA synthesizer market, 2018 - 2030 (USD Million)
- Fig. 39 Norway DNA synthesizer market, 2018 - 2030 (USD Million)
- Fig. 40 Asia Pacific DNA synthesizer market, 2018 - 2030 (USD Million)
- Fig. 41 Japan DNA synthesizer market, 2018 - 2030 (USD Million)
- Fig. 42 China DNA synthesizer market, 2018 - 2030 (USD Million)
- Fig. 43 India DNA synthesizer market, 2018 - 2030 (USD Million)
- Fig. 44 Australia DNA synthesizer market, 2018 - 2030 (USD Million)
- Fig. 45 South Korea DNA synthesizer market, 2018 - 2030 (USD Million)
- Fig. 46 Thailand DNA synthesizer market, 2018 - 2030 (USD Million)
- Fig. 47 Latin America DNA synthesizer market, 2018 - 2030 (USD Million)
- Fig. 48 Brazil DNA synthesizer market, 2018 - 2030 (USD Million)
- Fig. 49 Mexico DNA synthesizer market, 2018 - 2030 (USD Million)
- Fig. 50 Argentina DNA synthesizer market, 2018 - 2030 (USD Million)
- Fig. 51 Middle East and Africa DNA synthesizer market, 2018 - 2030 (USD Million)
- Fig. 52 South Africa DNA synthesizer market, 2018 - 2030 (USD Million)
- Fig. 53 Saudi Arabia DNA synthesizer market, 2018 - 2030 (USD Million)
- Fig. 54 UAE DNA synthesizer market, 2018 - 2030 (USD Million)
- Fig. 55 Kuwait DNA synthesizer market, 2018 - 2030 (USD Million)
DNA Synthesizer Market Growth & Trends
The global DNA synthesizer market size is expected to reach USD 664.2 million by 2030, expanding at 14.42% CAGR from 2023 to 2030, according to a new report by Grand View Research, Inc. The increasing interest for synthetic DNA in a wide range of applications including drug discovery and development, gene therapy, and genetic research is the key factor driving the demand for synthesizers. In addition, advancements in synthesis technology and automation are anticipated to further fuel the growth of the market. Moreover, various organic and inorganic developments done by market players in terms of development of efficient synthesizers is another factor supporting industry expansion. For instance, K&A Labs GmbH developed H series DNA synthesizers capable of giving maximum yield.
The evolving demand of synthetic nucleic acid across industries is pushing market players to invest in synthesizers. For instance, in April 2022 Ansa Biotechnologies raised USD 68 million to launch a customizable DNA synthesis service. Moreover, these funding has helped the company to strengthen its gene synthesis capabilities. Similarly, in June 2022 DNA Script raised USD 88.32 million to bring rapid synthesis platform to the lab. This funding supported the commercial launch of the company's benchtop DNA synthesizers.
The industry is highly competitive, with market players emphasizing on developing new and innovative synthesizers that can give faster and more efficient nucleic acid synthesis capabilities. For instance, in September 2022, Codex DNA, Inc. announced the commercial release and first shipment of BioXp 9600 system, a new high throughput platform developed to revolutionize synthetic biology workflows. In addition, collaborations and partnerships between companies are becoming increasingly common, as companies seek to leverage each other's capabilities and strengths to foster growth and innovation in the market.
Furthermore, exponential rise in demand for DNA synthesizers and other synthesis platforms in pharmaceutical and biotechnological companies have driven the market to a significant extent. Also, rising R&D activities, supportive government legislation, and an increase in the demand for novel therapeutic regimens for rare diseases are supporting industry's growth.
DNA Synthesizer Market Report Highlights
- By type, the benchtop DNA synthesizers segment dominated in 2022 with a share of 72.72%, due to increasing investment in R&D, growing demand for custom synthesis capabilities, and robust demand from large range of end users
- By application, the drug discovery and development segment dominated the industry in 2022 with a share of 48.11%, due to Wide application of DNA synthesizers in drug discovery, technology advancements, rising adoption of high-throughput technology, and presence of large number of players
- By end-use, the pharmaceutical and biotechnology companies segment dominated the market in 2022 with a share of 52.37%. The high growth of the segment is attributed to the rising use of synthetic nucleic acid for developing novel genetic therapies. Whereas the academic and research institute segment is projected to grow at high rate
- North America dominated the market in 2022 with a share of 39.22% due to its highly developed healthcare infrastructure and favorable government policies
Table of Contents
Chapter 1. Methodology and Scope
- 1.1. Information Procurement
- 1.2. Information Or Data Analysis
- 1.3. Market Scope & Segment Definition
- 1.4. Market Model
- 1.4.1. Market Study, By Company Market Share
- 1.4.2. Regional Analysis
Chapter 2. Executive Summary
- 2.1. Market Snapshot
- 2.2. Segment Snapshot
- 2.3. Competitive Landscape Snapshot
Chapter 3. Market Variables, Trends, & Scope
- 3.1. Market Lineage Outlook
- 3.1.1. Parent Market Outlook
- 3.1.2. Related/Ancillary Market Outlook
- 3.2. Market Dynamics
- 3.2.1. Market Driver Analysis
- 3.2.1.1. Growing Demand For Efficient DNA Synthesizers
- 3.2.1.2. Technological Advancements In DNA Synthesis & Advances In The Field Of Synthetic Biology
- 3.2.2. Market Restraint Analysis
- 3.2.2.1. Stringent Regulations And Ethical Concerns
- 3.2.1. Market Driver Analysis
- 3.3. Industry Analysis Tools
- 3.3.1. Porter's Five Forces Analysis
- 3.3.2. PESTEL Analysis
- 3.3.3. COVID-19 Impact Analysis
Chapter 4. Type Business Analysis
- 4.1. DNA Synthesizer Market: Type Movement Analysis
- 4.2. Benchtop DNA Synthesizers
- 4.2.1. Benchtop DNA Synthesizers Market, 2018 - 2030 (USD Million)
- 4.3. Large-scale DNA Synthesizers
- 4.3.1. Large-Scale DNA Synthesizers Market, 2018 - 2030 (USD Million)
Chapter 5. Application Business Analysis
- 5.1. DNA Synthesizer Market: Application Movement Analysis
- 5.2. Drug Discovery & Development
- 5.2.1. Drug Discovery & Development Market, 2018 - 2030 (USD Million)
- 5.3. Genetic Engineering
- 5.3.1. Genetic Engineering Market, 2018 - 2030 (USD Million)
- 5.4. Clinical Diagnostics
- 5.4.1. Clinical Diagnostics Market, 2018 - 2030 (USD Million)
Chapter 6. End use Business Analysis
- 6.1. DNA Synthesizer Market: End use Movement Analysis
- 6.2. Academic & Research Institutes
- 6.2.1. Academic & Research Institutes Market, 2018 - 2030 (USD Million)
- 6.3. Pharmaceutical & Biotechnology Companies
- 6.3.1. Pharmaceutical & Biotechnology Companies Market, 2018 - 2030 (USD Million)
- 6.4. Clinical Laboratories
- 6.4.1. Clinical Laboratories Market, 2018 - 2030 (USD Million)
Chapter 7. Regional Business Analysis
- 7.1. DNA Synthesizer Market Share By Region, 2022 & 2030
- 7.2. North America
- 7.2.1. North America DNA Synthesizer Market, 2018 - 2030 (USD Million)
- 7.2.2. U.S.
- 7.2.2.1. Key Country Dynamics
- 7.2.2.2. Target Disease Prevalence
- 7.2.2.3. Competitive Scenario
- 7.2.2.4. Regulatory Framework
- 7.2.2.5. U.S. DNA Synthesizer Market, 2018 - 2030 (USD Million)
- 7.2.3. Canada
- 7.2.3.1. Key Country Dynamics
- 7.2.3.2. Target Disease Prevalence
- 7.2.3.3. Competitive Scenario
- 7.2.3.4. Regulatory Framework
- 7.2.3.5. Canada DNA Synthesizer Market, 2018 - 2030 (USD Million)
- 7.3. Europe
- 7.3.1. Europe DNA Synthesizer Market, 2018 - 2030 (USD Million)
- 7.3.2. UK
- 7.3.2.1. Key Country Dynamics
- 7.3.2.2. Target Disease Prevalence
- 7.3.2.3. Competitive Scenario
- 7.3.2.4. Regulatory Framework
- 7.3.2.5. UK DNA Synthesizer Market, 2018 - 2030 (USD Million)
- 7.3.3. Germany
- 7.3.3.1. Key Country Dynamics
- 7.3.3.2. Target Disease Prevalence
- 7.3.3.3. Competitive Scenario
- 7.3.3.4. Regulatory Framework
- 7.3.3.5. Germany DNA Synthesizer Market, 2018 - 2030 (USD Million)
- 7.3.4. France
- 7.3.4.1. Key Country Dynamics
- 7.3.4.2. Target Disease Prevalence
- 7.3.4.3. Competitive Scenario
- 7.3.4.4. Regulatory Framework
- 7.3.4.5. France DNA Synthesizer Market, 2018 - 2030 (USD Million)
- 7.3.5. Italy
- 7.3.5.1. Key Country Dynamics
- 7.3.5.2. Target Disease Prevalence
- 7.3.5.3. Competitive Scenario
- 7.3.5.4. Regulatory Framework
- 7.3.5.5. Italy DNA Synthesizer Market, 2018 - 2030 (USD Million)
- 7.3.6. Spain
- 7.3.6.1. Key Country Dynamics
- 7.3.6.2. Target Disease Prevalence
- 7.3.6.3. Competitive Scenario
- 7.3.6.4. Regulatory Framework
- 7.3.6.5. Spain DNA Synthesizer Market, 2018 - 2030 (USD Million)
- 7.3.7. Denmark
- 7.3.7.1. Key Country Dynamics
- 7.3.7.2. Target Disease Prevalence
- 7.3.7.3. Competitive Scenario
- 7.3.7.4. Regulatory Framework
- 7.3.7.5. Denmark DNA Synthesizer Market, 2018 - 2030 (USD Million)
- 7.3.8. Sweden
- 7.3.8.1. Key Country Dynamics
- 7.3.8.2. Target Disease Prevalence
- 7.3.8.3. Competitive Scenario
- 7.3.8.4. Regulatory Framework
- 7.3.8.5. Sweden DNA Synthesizer Market, 2018 - 2030 (USD Million)
- 7.3.9. Norway
- 7.3.9.1. Key Country Dynamics
- 7.3.9.2. Target Disease Prevalence
- 7.3.9.3. Competitive Scenario
- 7.3.9.4. Regulatory Framework
- 7.3.9.5. Norway DNA Synthesizer Market, 2018 - 2030 (USD Million)
- 7.4. Asia Pacific
- 7.4.1. Asia Pacific DNA Synthesizer Market, 2018 - 2030 (USD Million)
- 7.4.2. Japan
- 7.4.2.1. Key Country Dynamics
- 7.4.2.2. Target Disease Prevalence
- 7.4.2.3. Competitive Scenario
- 7.4.2.4. Regulatory Framework
- 7.4.2.5. Japan DNA Synthesizer Market, 2018 - 2030 (USD Million)
- 7.4.3. China
- 7.4.3.1. Key Country Dynamics
- 7.4.3.2. Target Disease Prevalence
- 7.4.3.3. Competitive Scenario
- 7.4.3.4. Regulatory Framework
- 7.4.3.5. China DNA Synthesizer Market, 2018 - 2030 (USD Million)
- 7.4.4. India
- 7.4.4.1. Key Country Dynamics
- 7.4.4.2. Target Disease Prevalence
- 7.4.4.3. Competitive Scenario
- 7.4.4.4. Regulatory Framework
- 7.4.4.5. India DNA Synthesizer Market, 2018 - 2030 (USD Million)
- 7.4.5. Australia
- 7.4.5.1. Key Country Dynamics
- 7.4.5.2. Target Disease Prevalence
- 7.4.5.3. Competitive Scenario
- 7.4.5.4. Regulatory Framework
- 7.4.5.5. Australia DNA Synthesizer Market, 2018 - 2030 (USD Million)
- 7.4.6. Thailand
- 7.4.6.1. Key Country Dynamics
- 7.4.6.2. Target Disease Prevalence
- 7.4.6.3. Competitive Scenario
- 7.4.6.4. Regulatory Framework
- 7.4.6.5. Thailand DNA Synthesizer Market, 2018 - 2030 (USD Million)
- 7.4.7. South Korea
- 7.4.7.1. Key Country Dynamics
- 7.4.7.2. Target Disease Prevalence
- 7.4.7.3. Competitive Scenario
- 7.4.7.4. Regulatory Framework
- 7.4.7.5. South Korea DNA Synthesizer Market, 2018 - 2030 (USD Million)
- 7.5. Latin America
- 7.5.1. Latin America DNA Synthesizer Market, 2018 - 2030 (USD Million)
- 7.5.2. Brazil
- 7.5.2.1. Key Country Dynamics
- 7.5.2.2. Target Disease Prevalence
- 7.5.2.3. Competitive Scenario
- 7.5.2.4. Regulatory Framework
- 7.5.2.5. Brazil DNA Synthesizer Market, 2018 - 2030 (USD Million)
- 7.5.3. Mexico
- 7.5.3.1. Key Country Dynamics
- 7.5.3.2. Target Disease Prevalence
- 7.5.3.3. Competitive Scenario
- 7.5.3.4. Regulatory Framework
- 7.5.3.5. Mexico DNA Synthesizer Market, 2018 - 2030 (USD Million)
- 7.5.4. Argentina
- 7.5.4.1. Key Country Dynamics
- 7.5.4.2. Target Disease Prevalence
- 7.5.4.3. Competitive Scenario
- 7.5.4.4. Regulatory Framework
- 7.5.4.5. Argentina DNA Synthesizer Market, 2018 - 2030 (USD Million)
- 7.6. MEA
- 7.6.1. MEA DNA Synthesizer Market, 2018 - 2030 (USD Million)
- 7.6.2. South Africa
- 7.6.2.1. Key Country Dynamics
- 7.6.2.2. Target Disease Prevalence
- 7.6.2.3. Competitive Scenario
- 7.6.2.4. Regulatory Framework
- 7.6.2.5. South Africa DNA Synthesizer Market, 2018 - 2030 (USD Million)
- 7.6.3. Saudi Arabia
- 7.6.3.1. Key Country Dynamics
- 7.6.3.2. Target Disease Prevalence
- 7.6.3.3. Competitive Scenario
- 7.6.3.4. Regulatory Framework
- 7.6.3.5. Saudi Arabia DNA Synthesizer Market, 2018 - 2030 (USD Million)
- 7.6.4. UAE
- 7.6.4.1. Key Country Dynamics
- 7.6.4.2. Target Disease Prevalence
- 7.6.4.3. Competitive Scenario
- 7.6.4.4. Regulatory Framework
- 7.6.4.5. UAE DNA Synthesizer Market, 2018 - 2030 (USD Million)
- 7.6.5. Kuwait
- 7.6.5.1. Key Country Dynamics
- 7.6.5.2. Target Disease Prevalence
- 7.6.5.3. Competitive Scenario
- 7.6.5.4. Regulatory Framework
- 7.6.5.5. Kuwait DNA Synthesizer Market, 2018 - 2030 (USD Million)
Chapter 8. Competitive Landscape
- 8.1. Company Categorization
- 8.2. Strategy Mapping
- 8.3. Company Market Share Analysis, 2022
- 8.4. Company Profiles/Listing
- 8.4.1. Danaher
- 8.4.1.1. Overview
- 8.4.1.2. Financial Performance (Net Revenue/Sales/EBITDA/Gross Profit)
- 8.4.1.3. Product Benchmarking
- 8.4.1.4. Strategic Initiatives
- 8.4.2. Twist Bioscience
- 8.4.2.1. Overview
- 8.4.2.2. Financial Performance (Net Revenue/Sales/EBITDA/Gross Profit)
- 8.4.2.3. Product Benchmarking
- 8.4.2.4. Strategic Initiatives
- 8.4.3. Kilobaser
- 8.4.3.1. Overview
- 8.4.3.2. Financial Performance (Net Revenue/Sales/EBITDA/Gross Profit)
- 8.4.3.3. Product Benchmarking
- 8.4.3.4. Strategic Initiatives
- 8.4.4. LGC Limited
- 8.4.4.1. Overview
- 8.4.4.2. Financial Performance (Net Revenue/Sales/EBITDA/Gross Profit)
- 8.4.4.3. Product Benchmarking
- 8.4.4.4. Strategic Initiatives
- 8.4.5. CSBio
- 8.4.5.1. Overview
- 8.4.5.2. Financial Performance (Net Revenue/Sales/EBITDA/Gross Profit)
- 8.4.5.3. Product Benchmarking
- 8.4.5.4. Strategic Initiatives
- 8.4.6. K&A Labs GmbH
- 8.4.6.1. Overview
- 8.4.6.2. Financial Performance (Net Revenue/Sales/EBITDA/Gross Profit)
- 8.4.6.3. Product Benchmarking
- 8.4.6.4. Strategic Initiatives
- 8.4.7. DNA Script
- 8.4.7.1. Overview
- 8.4.7.2. Financial Performance (Net Revenue/Sales/EBITDA/Gross Profit)
- 8.4.7.3. Product Benchmarking
- 8.4.7.4. Strategic Initiatives
- 8.4.8. OligoMaker ApS
- 8.4.8.1. Overview
- 8.4.8.2. Financial Performance (Net Revenue/Sales/EBITDA/Gross Profit)
- 8.4.8.3. Product Benchmarking
- 8.4.8.4. Strategic Initiatives
- 8.4.9. PolyGen GmbH
- 8.4.9.1. Overview
- 8.4.9.2. Financial Performance (Net Revenue/Sales/EBITDA/Gross Profit)
- 8.4.9.3. Product Benchmarking
- 8.4.9.4. Strategic Initiatives
- 8.4.10. Biolytic Lab Performance Inc.
- 8.4.10.1. Overview
- 8.4.10.2. Financial Performance (Net Revenue/Sales/EBITDA/Gross Profit)
- 8.4.10.3. Product Benchmarking
- 8.4.10.4. Strategic
- 8.4.1. Danaher
