|
|
市場調査レポート
商品コード
1224659
電力用変圧器の市場規模、シェア、動向分析レポート:コア(クローズド、シェル、ベリー)別、絶縁体別、位相別、定格別、用途別、地域別、セグメント別予測、2023年~2030年Power Transformer Market Size, Share & Trends Analysis Report By Core (Closed, Shell, Berry), By Insulation, By Phase, By Rating, By Application, By Region, And Segment Forecasts, 2023 - 2030 |
||||||
|
|
|||||||
|
● お客様のご希望に応じて、既存データの加工や未掲載情報(例:国別セグメント)の追加などの対応が可能です。 詳細はお問い合わせください。 |
|||||||


| 電力用変圧器の市場規模、シェア、動向分析レポート:コア(クローズド、シェル、ベリー)別、絶縁体別、位相別、定格別、用途別、地域別、セグメント別予測、2023年~2030年 |
|
出版日: 2023年01月27日
発行: Grand View Research
ページ情報: 英文 120 Pages
納期: 2~10営業日
|
- 全表示
- 概要
- 図表
- 目次
電力用変圧器の市場成長と動向
Grand View Research Inc.の新しい調査によると、電力用変圧器の世界市場規模は2030年までに評価額389億1000万米ドルに達し、2023年から2030年までCAGR7.1%で拡大すると予想されています。技術開発と電力消費の増大が、電力用変圧器産業の成長を加速させると予想されます。発電所への大規模なインフラ投資とスマートメーターの需要増が相まって、需要に好影響を与えると予想されます。さらに、最先端技術の導入とともに現在の送電網をアップグレードするための多くの政府の取り組みが、電力用変圧器産業の拡大に拍車をかけると考えられます。
低炭素排出への関心の高まりは、今日の技術的・環境的基準と相容れない変圧器に大きな成長の見通しを生み出し、環境に優しい機器が提供する先進的な特性に取って代わられることが予想されます。それにもかかわらず、電力用変圧器業界の成長は、原材料価格の変動と相まって、メーカーに対する価格圧力によって妨げられると予想されます。
家庭用および商業用アプリケーションでの電力トランスの採用が拡大していることと、その価格が手ごろなことから、湿式絶縁をベースとした電力トランスの需要が高まっています。湿式絶縁ベースの電力トランスを高度な電力網に統合し、環境に優しい冷却剤を使用した再生可能な電力網を確立するためのR&Dの取り組みは、電力トランス業界にとって非常に有益なものになるでしょう。これらの変圧器は、その優れた効率から、低損失と高電圧が不可欠な要素である場面で使用されています。また、従来の電力用変圧器と比較して、高い冷却性能と絶縁性能を有しており、電力用変圧器産業の発展が期待されています。
過去数年間、人口の増加やデジタル化の進展により、電力使用量が増加しています。電力トランス業界は、平均的な電力需要の増加によって成長すると予想されます。
電力用変圧器市場レポートハイライト
世界の需要は、送電・配電ネットワークにおける100MVA~500MVA製品の昇圧・降圧用途の増加により牽引されると予想されます。中東およびアジア太平洋地域における高容量製品の需要が収益を牽引すると予測される
中国やインドといった国々の経済、産業、社会の発展を含む変数により、アジア太平洋地域が市場を独占すると予測されます。2018年から15年にかけて、アジア太平洋地域の電力用変圧器産業は約7.9%のCAGRで拡大すると予測される
電力用変圧器業界で事業を行う企業は、性能、環境、効率に関連するさまざまな規制を遵守する必要があります。
目次
第1章 調査手法と範囲
- 調査手法のセグメンテーションと範囲
- 情報調達
- 購入したデータベース
- GVRの内部データベース
- 二次情報と第三者の視点
- 1次調査
- 情報分析
- データ分析モデル
- 市場形成とデータ可視化
- データの検証と公開
第2章 エグゼクティブサマリー
第3章 電力用変圧器市場の変数、動向、範囲
- 業界バリューチェーン分析
- 市場力学
- 市場促進要因分析
- 市場抑制・課題分析
- 市場機会分析
- 浸透と成長の見通しのマッピング(重要な機会の優先順位付け)
- ビジネス環境分析ツール
- 業界分析- ポーターのファイブフォース分析
- PEST分析
- COVID-19影響分析
第4章 電力用変圧器市場のコアタイプ
- 2022年と2030年のコア別電力用変圧器市場シェア(10億米ドル)
- クローズド
- シェル
- ベリー
第5章 電力用変圧器市場の絶縁見通し
- 2022年と2030年の絶縁材別電力用変圧器市場シェア(10億米ドル)
- ガス
- 油
- 個体
- 空気
- 他の
第6章 電力用変圧器市場のフェーズの見通し
- 2022年および2030年のフェーズ別電力用変圧器市場シェア(10億米ドル)
- 独身
- 三つ
第7章 電力用変圧器市場の評価の見通し
- 2022年および2030年の格付け別電力用変圧器市場シェア(10億米ドル)
- 100MVA~500MVA
- 501MVA~800MVA
- 801MVA~1200MVA
第8章 電力用変圧器市場のアプリケーションの見通し
- アプリケーション別の電力用変圧器市場シェア、2022年および2030年(10億米ドル)
- 住宅および商業
- ユーティリティ
- 工業用
第9章 電力用変圧器市場:地域の見通し
- 2022年および2030年の地域別電力用変圧器市場シェア(10億米ドル)
- 北米
- 米国
- カナダ
- 欧州
- 英国
- ドイツ
- フランス
- その他欧州
- アジア太平洋地域
- 中国
- インド
- 日本
- その他アジア太平洋地域
- ラテンアメリカ
- ブラジル
- メキシコ
- その他ラテンアメリカ
- 中東とアフリカ
第10章 電力用変圧器の競合情勢
- ABB Ltd.
- 会社概要
- 財務実績
- 製品のベンチマーク
- 戦略的イニシアチブ
- Alstom SA
- 会社概要
- 財務実績
- 製品のベンチマーク
- 戦略的イニシアチブ
- Bharat Heavy Electricals Limited
- 会社概要
- 財務実績
- 製品のベンチマーク
- 戦略的イニシアチブ
- Crompton Greaves Ltd.
- 会社概要
- 財務実績
- 製品のベンチマーク
- 戦略的イニシアチブ
- GE Co.
- 会社概要
- 財務実績
- 製品のベンチマーク
- 戦略的イニシアチブ
- Hyosung Power &Industrial Systems Performance Group
- 会社概要
- 財務実績
- 製品のベンチマーク
- 戦略的イニシアチブ
- Hyundai Heavy Industries Co. Ltd.
- 会社概要
- 財務実績
- 製品のベンチマーク
- 戦略的イニシアチブ
- Mitsubishi Electric Corporation
- 会社概要
- 財務実績
- 製品のベンチマーク
- 戦略的イニシアチブ
- Siemens Energy
- 会社概要
- 財務実績
- 製品のベンチマーク
- 戦略的イニシアチブ
- Toshiba Corp.
- 会社概要
- 財務実績
- 製品のベンチマーク
- 戦略的イニシアチブ
List of Tables
- Table 1 Power Transformer Market, 2018 - 2030 (USD Billion)
- Table 2 Power Transformer Market, By Core, 2018 - 2030 (USD Billion)
- Table 3 Power Transformer Market, By Insulation, 2018 - 2030 (USD Billion)
- Table 4 Power Transformer Market, By Phase, 2018 - 2030 (USD Billion)
- Table 5 Power Transformer Market, By Rating, 2018 - 2030 (USD Billion)
- Table 6 Power Transformer Market, By Application, 2018 - 2030 (USD Billion)
- Table 7 Closed Market By Region, 2018 - 2030 (USD Billion)
- Table 8 Shell Market By Region, 2018 - 2030 (USD Billion)
- Table 9 Berry Market by Region, 2018 - 2030 (USD Billion)
- Table 10 Gas Market by Region, 2018 - 2030 (USD Billion)
- Table 11 Oil Market by Region, 2018 - 2030 (USD Billion)
- Table 12 Solid Market By Region, 2018 - 2030 (USD Billion)
- Table 13 Air Market by Region, 2018 - 2030 (USD Billion)
- Table 14 Other Market by Region, 2018 - 2030 (USD Billion)
- Table 15 Single Market by Region, 2018 - 2030 (USD Billion)
- Table 16 Three Market by Region, 2018 - 2030 (USD Billion)
- Table 17 100 MVA to 500 MVA by Region, 2018 - 2030 (USD Billion)
- Table 18 510 MVA to 800 MVA Market By Region, 2018 - 2030 (USD Billion)
- Table 19 801 MVA to 1200 MVA Market by Region, 2018 - 2030 (USD Billion)
- Table 20 Residential & Commerical Market by Region, 2018 - 2030 (USD Billion)
- Table 21 Utilities Market by Region, 2018 - 2030 (USD Billion)
- Table 22 Industrial Market by Region, 2018 - 2030 (USD Billion)
- Table 23 North America Power Transformer Market, By Core 2018 - 2030 (USD Billion)
- Table 24 North America Power Transformer Market, By Insulation 2018 - 2030 (USD Billion)
- Table 25 North America Power Transformer Market, By Phase 2018 - 2030 (USD Billion)
- Table 26 North America Power Transformer Market, By Rating 2018 - 2030 (USD Billion)
- Table 27 North America Power Transformer Market, By Application 2018 - 2030 (USD Billion)
- Table 28 U.S. Power Transformer Market, By Core 2018 - 2030 (USD Billion)
- Table 29 U.S. Power Transformer Market, By Insulation 2018 - 2030 (USD Billion)
- Table 30 U.S. Power Transformer Market, By Phase 2018 - 2030 (USD Billion)
- Table 31 U.S. Power Transformer Market, By Rating 2018 - 2030 (USD Billion)
- Table 32 U.S. Power Transformer Market, By Application 2018 - 2030 (USD Billion)
- Table 33 Canada Power Transformer Market, By Core 2018 - 2030 (USD Billion)
- Table 34 Canada Power Transformer Market, By Insulation 2018 - 2030 (USD Billion)
- Table 35 Canada Power Transformer Market, By Phase 2018 - 2030 (USD Billion)
- Table 36 Canada Power Transformer Market, By Rating 2018 - 2030 (USD Billion)
- Table 37 Canada Power Transformer Market, By Application 2018 - 2030 (USD Billion)
- Table 38 Europe Power Transformer Market, By Core 2018 - 2030 (USD Billion)
- Table 39 Europe Power Transformer Market, By Insulation 2018 - 2030 (USD Billion)
- Table 40 Europe Power Transformer Market, By Phase 2018 - 2030 (USD Billion)
- Table 41 Europe Power Transformer Market, By Rating 2018 - 2030 (USD Billion)
- Table 42 Europe Power Transformer Market, By Application 2018 - 2030 (USD Billion)
- Table 43 U.K. Power Transformer Market, By Core 2018 - 2030 (USD Billion)
- Table 44 U.K. Power Transformer Market, By Insulation 2018 - 2030 (USD Billion)
- Table 45 U.K. Power Transformer Market, By Phase 2018 - 2030 (USD Billion)
- Table 46 U.K. Power Transformer Market, By Rating 2018 - 2030 (USD Billion)
- Table 47 U.K. Power Transformer Market, By Application 2018 - 2030 (USD Billion)
- Table 48 Germany Power Transformer Market, By Core 2018 - 2030(USD Billion)
- Table 49 Germany Power Transformer Market, By Insulation 2018 - 2030 (USD Billion)
- Table 50 Germany Power Transformer Market, By Phase 2018 - 2030(USD Billion)
- Table 51 Germany Power Transformer Market, By Rating 2018 - 2030 (USD Billion)
- Table 52 Germany Power Transformer Market, By Application 2018 - 2030 (USD Billion)
- Table 53 France Power Transformer Market, By Core 2018 - 2030 (USD Billion)
- Table 54 France Power Transformer Market, By Insulation 2018 - 2030 (USD Billion)
- Table 55 France Power Transformer Market, By Phase 2018 - 2030 (USD Billion)
- Table 56 France Power Transformer Market, By Rating 2018 - 2030 (USD Billion)
- Table 57 France Power Transformer Market, By Application 2018 - 2030 (USD Billion)
- Table 58 Rest of Europe Power Transformer Market, By Core 2018 - 2030(USD Billion)
- Table 59 Rest of Europe Power Transformer Market, By Insulation 2018 - 2030 (USD Billion)
- Table 60 Rest of Europe Power Transformer Market, By Phase 2018 - 2030(USD Billion)
- Table 61 Rest of Europe Power Transformer Market, By Rating 2018 - 2030 (USD Billion)
- Table 62 Rest of Europe Power Transformer Market, By Application 2018 - 2030 (USD Billion)
- Table 63 Asia Pacific Power Transformer Market, By Core 2018 - 2030 (USD Billion)
- Table 64 Asia Pacific Power Transformer Market, By Insulation 2018 - 2030 (USD Billion)
- Table 65 Asia Pacific Power Transformer Market, By Phase 2018 - 2030 (USD Billion)
- Table 66 Asia Pacific Power Transformer Market, By Rating 2018 - 2030 (USD Billion)
- Table 67 Asia Pacific Power Transformer Market, By Application 2018 - 2030 (USD Billion)
- Table 68 China Power Transformer Market, By Core 2018 - 2030 (USD Billion)
- Table 69 China Power Transformer Market, By Insulation 2018 - 2030 (USD Billion)
- Table 70 China Power Transformer Market, By Phase 2018 - 2030 (USD Billion)
- Table 71 China Power Transformer Market, By Rating 2018 - 2030 (USD Billion)
- Table 72 China Power Transformer Market, By Application 2018 - 2030 (USD Billion)
- Table 73 Japan Power Transformer Market, By Core 2018 - 2030 (USD Billion)
- Table 74 Japan Power Transformer Market, By Insulation 2018 - 2030 (USD Billion)
- Table 75 Japan Power Transformer Market, By Phase 2018 - 2030 (USD Billion)
- Table 76 Japan Power Transformer Market, By Rating 2018 - 2030 (USD Billion)
- Table 77 Japan Power Transformer Market, By Application 2018 - 2030 (USD Billion)
- Table 78 India Power Transformer Market, By Core 2018 - 2030 (USD Billion)
- Table 79 India Power Transformer Market, By Insulation 2018 - 2030 (USD Billion)
- Table 80 India Power Transformer Market, By Phase 2018 - 2030 (USD Billion)
- Table 81 India Power Transformer Market, By Rating 2018 - 2030 (USD Billion)
- Table 82 India Power Transformer Market, By Application 2018 - 2030 (USD Billion)
- Table 83 Rest of Asia Pacific Power Transformer Market, By Core 2018 - 2030 (USD Billion)
- Table 84 Rest of Asia Pacific Power Transformer Market, By Insulation 2018 - 2030 (USD Billion)
- Table 85 Rest of Asia Pacific Power Transformer Market, By Phase 2018 - 2030 (USD Billion)
- Table 86 Rest of Asia Pacific Power Transformer Market, By Rating 2018 - 2030 (USD Billion)
- Table 87 Rest of Asia Pacific Power Transformer Market, By Application 2018 - 2030 (USD Billion)
- Table 88 Latin America Power Transformer Market, By Core 2018 - 2030 (USD Billion)
- Table 89 Latin America Power Transformer Market, By Insulation 2018 - 2030 (USD Billion)
- Table 90 Latin America Power Transformer Market, By Phase 2018 - 2030 (USD Billion)
- Table 91 Latin America Power Transformer Market, By Rating 2018 - 2030 (USD Billion)
- Table 92 Latin America Power Transformer Market, By Application 2018 - 2030 (USD Billion)
- Table 93 Brazil Power Transformer Market, By Core 2018 - 2030 (USD Billion)
- Table 94 Brazil Power Transformer Market, By Insulation 2018 - 2030 (USD Billion)
- Table 95 Brazil Power Transformer Market, By Phase 2018 - 2030 (USD Billion)
- Table 96 Brazil Power Transformer Market, By Rating 2018 - 2030 (USD Billion)
- Table 97 Brazil Power Transformer Market, By Application 2018 - 2030 (USD Billion)
- Table 98 Mexico Power Transformer Market, By Core 2018 - 2030 (USD Billion)
- Table 99 Mexico Power Transformer Market, By Insulation 2018 - 2030 (USD Billion)
- Table 100 Mexico Power Transformer Market, By Phase 2018 - 2030 (USD Billion)
- Table 101 Mexico Power Transformer Market, By Rating 2018 - 2030 (USD Billion)
- Table 102 Mexico Power Transformer Market, By Application 2018 - 2030 (USD Billion)
- Table 103 Rest of Latin America Power Transformer Market, By Core 2018 - 2030 (USD Billion)
- Table 104 Rest of Latin America Power Transformer Market, By Insulation 2018 - 2030 (USD Billion)
- Table 105 Rest of Latin America Power Transformer Market, By Phase 2018 - 2030 (USD Billion)
- Table 106 Rest of Latin America Power Transformer Market, By Rating 2018 - 2030 (USD Billion)
- Table 107 Rest of Latin America Power Transformer Market, By Application 2018 - 2030 (USD Billion)
- Table 108 Middle East and Africa Power Transformer Market, By Core 2018 - 2030 (USD Billion)
- Table 109 Middle East and Africa Power Transformer Market, By Insulation 2018 - 2030 (USD Billion)
- Table 110 Middle East and Africa Power Transformer Market, By Phase 2018 - 2030 (USD Billion)
- Table 111 Middle East and Africa Power Transformer Market, By Rating 2018 - 2030 (USD Billion)
- Table 112 Middle East and Africa Power Transformer Market, By Application 2018 - 2030 (USD Billion)
List of Figures
- Fig. 1 Market segmentation & scope
- Fig. 2 Information procurement
- Fig. 3 Primary research pattern
- Fig. 4 Primary research process
- Fig. 5 Market formulation and data visualization
- Fig. 6 Industry Snapshot
- Fig. 7 Power Transformer Market penetration & growth prospect mapping
- Fig. 8 Industry value chain analysis
- Fig. 9 Industry Analysis - Porter's
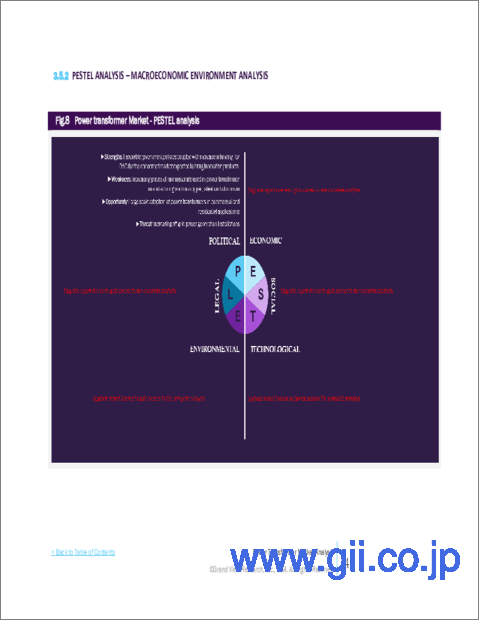
- Fig. 10 PEST Analysis
- Fig. 11 Power Transformer Market - Key Company Market Share Analysis, 2018 - 2030 (%)
- Fig. 12 Power Transformer Market, by core, key takeaways (USD Billion)
- Fig. 13 Core analysis & market share, 2022 & 2030
- Fig. 14 Power Transformer Market, by insulation, key takeaways (USD Billion)
- Fig. 15 Insulation analysis & market share, 2022 & 2030
- Fig. 16 Power Transformer Market, by Phase, key takeaways (USD Billion)
- Fig. 17 Phase analysis & market share, 2022 & 2030
- Fig. 18 Power Transformer Market, by rating, key takeaways (USD Billion)
- Fig. 19 Rating analysis & market share, 2022 & 2030
- Fig. 20 Power Transformer Market, by Application, key takeaways (USD Billion)
- Fig. 21 Application analysis & market share, 2022 & 2030
- Fig. 22 Regional market size estimates & forecasts, 2018 - 2030 (USD Billion)
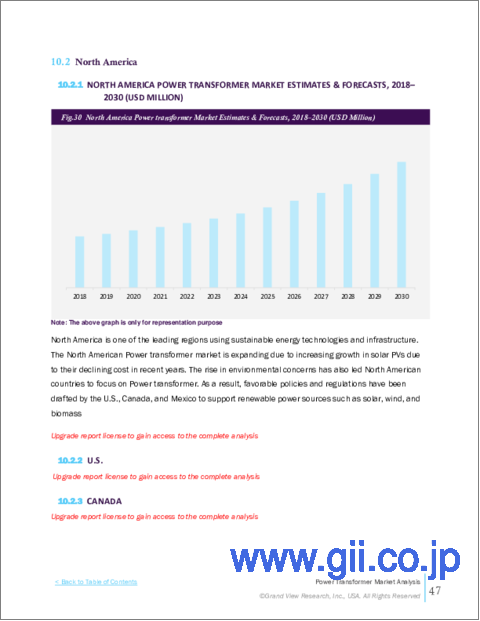
- Fig. 23 North America power transformer market outlook and market share by country, 2022 & 2030 (USD Billion)
- Fig. 24 Europe power transformer market outlook and market share by country, 2022 & 2030 (USD Billion)
- Fig. 25 Asia Pacific power transformer market outlook and market share by country, 2022 & 2030 (USD Billion)
- Fig. 26 Latin America power transformer market outlook and market share by country, 2022 & 2030 (USD Billion)
- Fig. 27 Middle East & Africa power transformer market outlook and market share by country, 2022 & 2030 (USD Billion)
Power Transformer Market Growth & Trends:
The global power transformer market size is expected to reach a valuation of USD 38.91 billion by 2030 and is expected to expand at 7.1% CAGR from 2023 to 2030, according to a new study by Grand View Research Inc. Technical developments and growing electricity consumption is expected to accelerate power transformer industry growth. It is anticipated that significant infrastructure investments in power plants combined with rising demand for smart meters will have a favorable effect on demand. Furthermore, a number of government initiatives to upgrade the current grids along with the installation of cutting-edge technology will fuel the expansion of the power transformer industry.
The growing interest in low carbon emissions is expected to create significant growth prospects for transformers, which are incompatible with today's technical and environmental criteria, and are expected to be replaced by advanced characteristics offered by environmentally friendly equipment. The power transformer industry growth is expected to be hampered, nevertheless, by pricing pressure on manufacturers, coupled with shifting raw material prices.
The growing adoption of power transformers for household and commercial applications, as well as their affordability, are driving up demand for power transformers based on wet insulation. R and D initiatives for integrating wet insulation-based power transformers with advanced power grids and establishing renewable power grids with eco-friendly coolants would be very beneficial to the power transformer industry. Due to their excellent efficiency, these transformers are used in situations where low losses and high voltage are essential factors. They also offer higher cooling and insulation capabilities when compared to conventional power transformers, which promise to advance the power transformer industry.
Over the past few years, population expansion and growing digitization have led to an increase in electricity usage. The power transformer industry is expected to grow as a result of increased average electricity demand.
Power Transformer Market Report Highlights:
- Global demand is anticipated to be driven by an increase in the use of 100 MVA to 500 MVA products in transmission and distribution networks for step-up and step-down applications. Revenue is expected to be driven by high-capacity product demand in the Middle East and Asia Pacific region
- Due to variables including economic, industrial, and social development in nations like China and India, the Asia Pacific region is anticipated to dominate the market. From 2018 to 2003, the Asia Pacific power transformer industry is projected to expand at a CAGR of about 7.9 %
- Companies operating in the power transformer industry have to comply with varied regulations related to performance, environment, and efficiency
Table of Contents
Chapter 1. Methodology and Scope
- 1.1. Methodology Segmentation & Scope
- 1.2. Information Procurement
- 1.2.1. Purchased database
- 1.2.2. GVR's internal database
- 1.2.3. Secondary sources & third-party perspectives
- 1.2.4. Primary research
- 1.3. Information Analysis
- 1.3.1. Data analysis models
- 1.4. Market Formulation & Data Visualization
- 1.5. Data Validation & Publishing
Chapter 2. Executive Summary
- 2.1. Power Transformer Market- Industry Snapshot, 2018 - 2030
Chapter 3. Power Transformer Market Variables, Trends & Scope
- 3.1. Market Size and Growth Prospects, 2018 - 2030
- 3.2. Industry Value Chain Analysis
- 3.3. Market Dynamics
- 3.3.1. Market Driver Analysis
- 3.3.2. Market Restraint/Challenge Analysis
- 3.3.3. Market Opportunity Analysis
- 3.4. Penetration & Growth Prospect Mapping (Key Opportunities Prioritized)
- 3.5. Business Environment Analysis Tools
- 3.5.1. Industry Analysis - Porter's Five Forces Analysis
- 3.5.2. PEST Analysis
- 3.5.3. COVID-19 Impact Analysis
Chapter 4. Power Transformer Market Core type
- 4.1. Power Transformer Market Share by Core, 2022 & 2030 (USD Billion)
- 4.2. Closed
- 4.2.1. Market estimates and forecasts, 2018 - 2030 (USD Billion)
- 4.2.2. Market estimates and forecast by region, 2018 - 2030 (USD Billion)
- 4.3. Shell
- 4.3.1. Market estimates and forecast, 2018 - 2030 (USD Billion)
- 4.3.2. Market estimates and forecast by region, 2018 - 2030 (USD Billion)
- 4.4. Berry
- 4.4.1. Market estimates and forecast, 2018 - 2030 (USD Billion)
- 4.4.2. Market estimates and forecast by region, 2018 - 2030 (USD Billion)
Chapter 5. Power Transformer Market Insulation Outlook
- 5.1. Power Transformer Market Share by Insulation, 2022 & 2030 (USD Billion)
- 5.2. Gas
- 5.2.1. Market estimates and forecasts, 2018 - 2030 (USD Billion)
- 5.2.2. Market estimates and forecast by region, 2018 - 2030 (USD Billion)
- 5.3. Oil
- 5.3.1. Market estimates and forecast, 2018 - 2030 (USD Billion)
- 5.3.2. Market estimates and forecast by region, 2018 - 2030 (USD Billion)
- 5.4. Solid
- 5.4.1. Market estimates and forecast, 2018 - 2030 (USD Billion)
- 5.4.2. Market estimates and forecast by region, 2018 - 2030 (USD Billion)
- 5.5. Air
- 5.5.1. Market estimates and forecast, 2018 - 2030 (USD Billion)
- 5.5.2. Market estimates and forecast by region, 2018 - 2030 (USD Billion)
- 5.6. Other
- 5.6.1. Market estimates and forecast, 2018 - 2030 (USD Billion)
- 5.6.2. Market estimates and forecast by region, 2018 - 2030 (USD Billion)
Chapter 6. Power Transformer Market Phase Outlook
- 6.1. Power Transformer Market Share by Phase, 2022 & 2030 (USD Billion)
- 6.2. Single
- 6.2.1. Market estimates and forecasts, 2018 - 2030 (USD Billion)
- 6.2.2. Market estimates and forecast by region, 2018 - 2030 (USD Billion)
- 6.3. Three
- 6.3.1. Market estimates and forecast, 2018 - 2030 (USD Billion)
- 6.3.2. Market estimates and forecast by region, 2018 - 2030 (USD Billion)
Chapter 7. Power Transformer Market Rating Outlook
- 7.1. Power Transformer Market Share by Rating, 2022 & 2030 (USD Billion)
- 7.2. 100 MVA to 500 MVA
- 7.2.1. Market estimates and forecasts, 2018 - 2030 (USD Billion)
- 7.2.2. Market estimates and forecast by region, 2018 - 2030 (USD Billion)
- 7.3. 501 MVA to 800 MVA
- 7.3.1. Market estimates and forecast, 2018 - 2030 (USD Billion)
- 7.3.2. Market estimates and forecast by region, 2018 - 2030 (USD Billion)
- 7.4 801 MVA to 1200 MVA
- 7.4.1. Market estimates and forecast, 2018 - 2030 (USD Billion)
- 7.4.2. Market estimates and forecast by region, 2018 - 2030 (USD Billion)
Chapter 8. Power Transformer Market Application Outlook
- 8.1. Power Transformer Market Share by Application, 2022 & 2030 (USD Billion)
- 8.2. Residential & Commercial
- 8.2.1. Market estimates and forecasts, 2018 - 2030 (USD Billion)
- 8.2.2. Market estimates and forecast by region, 2018 - 2030 (USD Billion)
- 8.3. Utilities
- 8.3.1. Market estimates and forecast, 2018 - 2030 (USD Billion)
- 8.3.2. Market estimates and forecast by region, 2018 - 2030 (USD Billion)
- 8.4 Industrial
- 8.4.1. Market estimates and forecast, 2018 - 2030 (USD Billion)
- 8.4.2. Market estimates and forecast by region, 2018 - 2030 (USD Billion)
Chapter 9. Power Transformer Market: Regional Outlook
- 9.1. Power Transformer Market Share by Region, 2022 & 2030 (USD Billion)
- 9.2. North America
- 9.2.1. Market estimates and forecast, 2018 - 2030 (USD Billion)
- 9.2.2. Market estimates and forecast by core, 2018 - 2030 (USD Billion)
- 9.2.3. Market estimates and forecast by insulation, 2018 - 2030 (USD Billion)
- 9.2.4. Market estimates and forecast by phase, 2018 - 2030 (USD Billion)
- 9.2.5. Market estimates and forecast by rating, 2018 - 2030 (USD Billion)
- 9.2.6. Market estimates and forecast by application, 2018 - 2030 (USD Billion)
- 9.2.7. U.S.
- 9.2.7.1. Market estimates and forecast, 2018 - 2030 (USD Billion)
- 9.2.7.2. Market estimates and forecast by core, 2018 - 2030 (USD Billion)
- 9.2.7.3. Market estimates and forecast by insulation, 2018 - 2030 (USD Billion)
- 9.2.7.4. Market estimates and forecast by phase, 2018 - 2030 (USD Billion)
- 9.2.7.5. Market estimates and forecast by rating, 2018 - 2030 (USD Billion)
- 9.2.7.6. Market estimates and forecast by application, 2018 - 2030 (USD Billion)
- 9.2.8. Canada
- 9.2.8.1. Market estimates and forecast, 2018 - 2030 (USD Billion)
- 9.2.8.2. Market estimates and forecast by core, 2018 - 2030 (USD Billion)
- 9.2.8.3. Market estimates and forecast by insulation, 2018 - 2030 (USD Billion)
- 9.2.8.4. Market estimates and forecast by phase, 2018 - 2030 (USD Billion)
- 9.2.8.5. Market estimates and forecast by rating, 2018 - 2030 (USD Billion)
- 9.2.8.6. Market estimates and forecast by application, 2018 - 2030 (USD Billion)
- 9.3. Europe
- 9.3.1. Market estimates and forecast, 2018 - 2030 (USD Billion)
- 9.3.2. Market estimates and forecast by core, 2018 - 2030 (USD Billion)
- 9.3.3. Market estimates and forecast by insulation, 2018 - 2030 (USD Billion)
- 9.3.4. Market estimates and forecast by phase, 2018 - 2030 (USD Billion)
- 9.3.5. Market estimates and forecast by rating, 2018 - 2030 (USD Billion)
- 9.3.6. Market estimates and forecast by application, 2018 - 2030 (USD Billion)
- 9.3.7. U.K.
- 9.3.7.1. Market estimates and forecast, 2018 - 2030 (USD Billion)
- 9.3.7.2. Market estimates and forecast by core, 2018 - 2030 (USD Billion)
- 9.3.7.3. Market estimates and forecast by insulation, 2018 - 2030 (USD Billion)
- 9.3.7.4. Market estimates and forecast by phase, 2018 - 2030 (USD Billion)
- 9.3.7.5. Market estimates and forecast by rating, 2018 - 2030 (USD Billion)
- 9.3.7.6. Market estimates and forecast by application, 2018 - 2030 (USD Billion)
- 9.3.8. Germany
- 9.3.8.1. Market estimates and forecast, 2018 - 2030 (USD Billion)
- 9.3.8.2. Market estimates and forecast by core, 2018 - 2030 (USD Billion)
- 9.3.8.3. Market estimates and forecast by insulation, 2018 - 2030 (USD Billion)
- 9.3.8.4. Market estimates and forecast by phase, 2018 - 2030 (USD Billion)
- 9.3.8.5. Market estimates and forecast by rating, 2018 - 2030 (USD Billion)
- 9.3.8.6. Market estimates and forecast by rating, 2018 - 2030 (USD Billion)
- 9.3.9. France
- 9.3.9.1. Market estimates and forecast, 2018 - 2030 (USD Billion)
- 9.3.9.2. Market estimates and forecast by core, 2018 - 2030 (USD Billion)
- 9.3.9.3. Market estimates and forecast by insulation, 2018 - 2030 (USD Billion)
- 9.3.9.4. Market estimates and forecast by phase, 2018 - 2030 (USD Billion)
- 9.3.9.5. Market estimates and forecast by rating, 2018 - 2030 (USD Billion)
- 9.3.9.6. Market estimates and forecast by application, 2018 - 2030 (USD Billion)
- 9.3.10. Rest of Europe
- 9.3.10.1. Market estimates and forecast, 2018 - 2030 (USD Billion)
- 9.3.10.2. Market estimates and forecast by core, 2018 - 2030 (USD Billion)
- 9.3.10.3. Market estimates and forecast by insulation, 2018 - 2030 (USD Billion)
- 9.3.10.4. Market estimates and forecast by phase, 2018 - 2030 (USD Billion)
- 9.3.10.5. Market estimates and forecast by rating, 2018 - 2030 (USD Billion)
- 9.3.10.6. Market estimates and forecast by application, 2018 - 2030 (USD Billion)
- 9.4. Asia Pacific
- 9.4.1. Market estimates and forecast, 2018 - 2030 (USD Billion)
- 9.4.2. Market estimates and forecast by core, 2018 - 2030 (USD Billion)
- 9.4.3. Market estimates and forecast by insulation, 2018 - 2030 (USD Billion)
- 9.4.4. Market estimates and forecast by phase, 2018 - 2030 (USD Billion)
- 9.4.5. Market estimates and forecast by rating, 2018 - 2030 (USD Billion)
- 9.4.6. Market estimates and forecast by application, 2018 - 2030 (USD Billion)
- 9.4.7. China
- 9.4.7.1. Market estimates and forecast, 2018 - 2030 (USD Billion)
- 9.4.7.2. Market estimates and forecast by core, 2018 - 2030 (USD Billion)
- 9.4.7.3. Market estimates and forecast by insulation, 2018 - 2030 (USD Billion)
- 9.4.7.4. Market estimates and forecast by phase, 2018 - 2030 (USD Billion)
- 9.4.7.5. Market estimates and forecast by rating, 2018 - 2030 (USD Billion)
- 9.4.7.6. Market estimates and forecast by application, 2018 - 2030 (USD Billion)
- 9.4.8. India
- 9.4.8.1. Market estimates and forecast, 2018 - 2030 (USD Billion)
- 9.4.8.2. Market estimates and forecast by core, 2018 - 2030 (USD Billion)
- 9.4.8.3. Market estimates and forecast by insulation, 2018 - 2030 (USD Billion)
- 9.4.8.4. Market estimates and forecast by phase, 2018 - 2030 (USD Billion)
- 9.4.8.5. Market estimates and forecast by rating, 2018 - 2030 (USD Billion)
- 9.4.8.6. Market estimates and forecast by application, 2018 - 2030 (USD Billion)
- 9.4.9. Japan
- 9.4.9.1. Market estimates and forecast, 2018 - 2030 (USD Billion)
- 9.4.9.2. Market estimates and forecast by core, 2018 - 2030 (USD Billion)
- 9.4.9.3. Market estimates and forecast by insulation, 2018 - 2030 (USD Billion)
- 9.4.9.4. Market estimates and forecast by phase, 2018 - 2030 (USD Billion)
- 9.4.9.5. Market estimates and forecast by rating, 2018 - 2030 (USD Billion)
- 9.4.9.6. Market estimates and forecast by application, 2018 - 2030 (USD Billion)
- 9.4.10. Rest of Asia Pacific
- 9.4.10.1. Market estimates and forecast, 2018 - 2030 (USD Billion)
- 9.4.10.2. Market estimates and forecast by core, 2018 - 2030 (USD Billion)
- 9.4.10.3. Market estimates and forecast by insulation, 2018 - 2030 (USD Billion)
- 9.4.10.4. Market estimates and forecast by phase, 2018 - 2030 (USD Billion)
- 9.4.10.5. Market estimates and forecast by rating, 2018 - 2030 (USD Billion)
- 9.4.10.6. Market estimates and forecast by application, 2018 - 2030 (USD Billion)
- 9.5. Latin America
- 9.5.1. Market estimates and forecast, 2018 - 2030 (USD Billion)
- 9.5.2. Market estimates and forecast by core, 2018 - 2030 (USD Billion)
- 9.5.3. Market estimates and forecast by insulation, 2018 - 2030 (USD Billion)
- 9.5.4. Market estimates and forecast by phase, 2018 - 2030 (USD Billion)
- 9.5.5. Market estimates and forecast by rating, 2018 - 2030 (USD Billion)
- 9.5.6. Market estimates and forecast by application, 2018 - 2030 (USD Billion)
- 9.5.7. Brazil
- 9.5.7.1. Market estimates and forecast, 2018 - 2030 (USD Billion)
- 9.5.7.2. Market estimates and forecast by core, 2018 - 2030 (USD Billion)
- 9.5.7.3. Market estimates and forecast by insulation, 2018 - 2030 (USD Billion)
- 9.5.7.4. Market estimates and forecast by phase, 2018 - 2030 (USD Billion)
- 9.5.7.5. Market estimates and forecast by rating, 2018 - 2030 (USD Billion)
- 9.5.7.6. Market estimates and forecast by application, 2018 - 2030 (USD Billion)
- 9.5.8. Mexico
- 9.5.8.1. Market estimates and forecast, 2018 - 2030 (USD Billion)
- 9.5.8.2. Market estimates and forecast by core, 2018 - 2030 (USD Billion)
- 9.5.8.3. Market estimates and forecast by insulation, 2018 - 2030 (USD Billion)
- 9.5.8.4. Market estimates and forecast by phase, 2018 - 2030 (USD Billion)
- 9.5.8.5. Market estimates and forecast by rating, 2018 - 2030 (USD Billion)
- 9.5.8.6. Market estimates and forecast by application, 2018 - 2030 (USD Billion)
- 9.5.9. Rest of Latin America
- 9.5.9.1. Market estimates and forecast, 2018 - 2030 (USD Billion)
- 9.5.9.2. Market estimates and forecast by core, 2018 - 2030 (USD Billion)
- 9.5.9.3. Market estimates and forecast by insulation, 2018 - 2030 (USD Billion)
- 9.5.9.4. Market estimates and forecast by phase, 2018 - 2030 (USD Billion)
- 9.5.9.5. Market estimates and forecast by rating, 2018 - 2030 (USD Billion)
- 9.5.9.6. Market estimates and forecast by application, 2018 - 2030 (USD Billion)
- 9.6. Middle East & Africa
- 9.6.1. Market estimates and forecast, 2018 - 2030 (USD Billion)
- 9.6.2. Market estimates and forecast by core, 2018 - 2030 (USD Billion)
- 9.6.3. Market estimates and forecast by insulation, 2018 - 2030 (USD Billion)
- 9.6.4. Market estimates and forecast by phase, 2018 - 2030 (USD Billion)
- 9.6.5. Market estimates and forecast by rating, 2018 - 2030 (USD Billion)
- 9.6.6. Market estimates and forecast by application, 2018 - 2030 (USD Billion)
Chapter 10 Power Transformers Competitive Landscape
- 10.1 ABB Ltd.
- 10.1.1 Company Overview
- 10.1.2 Financial Performance
- 10.1.3 Product Benchmarking
- 10.1.4 Strategic Initiatives
- 10.2 Alstom SA
- 10.2.1 Company Overview
- 10.2.2 Financial Performance
- 10.2.3 Product Benchmarking
- 10.2.4 Strategic Initiatives
- 10.3 Bharat Heavy Electricals Limited
- 10.3.1 Company Overview
- 10.3.2 Financial Performance
- 10.3.3 Product Benchmarking
- 10.3.4 Strategic Initiatives
- 10.4 Crompton Greaves Ltd.
- 10.4.1 Company Overview
- 10.4.2 Financial Performance
- 10.4.3 Product Benchmarking
- 10.4.4 Strategic Initiatives
- 10.5 GE Co.
- 10.5.1 Company Overview
- 10.5.2 Financial Performance
- 10.5.3 Product Benchmarking
- 10.5.4 Strategic Initiatives
- 10.6 Hyosung Power & Industrial Systems Performance Group
- 10.6.1 Company Overview
- 10.6.2 Financial Performance
- 10.6.3 Product Benchmarking
- 10.6.4 Strategic Initiatives
- 10.7 Hyundai Heavy Industries Co. Ltd.
- 10.7.1 Company Overview
- 10.7.2 Financial Performance
- 10.7.3 Product Benchmarking
- 10.7.4 Strategic Initiatives
- 10.8 Mitsubishi Electric Corporation
- 10.8.1 Company Overview
- 10.8.2 Financial Performance
- 10.8.3 Product Benchmarking
- 10.8.4 Strategic Initiatives
- 10.9 Siemens Energy
- 10.9.1 Company Overview
- 10.9.2 Financial Performance
- 10.9.3 Product Benchmarking
- 10.9.4 Strategic Initiatives
- 10.10 Toshiba Corp.
- 10.10.1 Company Overview
- 10.10.2 Financial Performance
- 10.10.3 Product Benchmarking
- 10.10.4 Strategic Initiatives