|
|
市場調査レポート
商品コード
1092417
ファクタリングサービスの米国市場:市場規模、シェア、動向分析-カテゴリー別、タイプ別、金融機関別、最終用途別、セグメント予測(2022~2030年)U.S. Factoring Services Market Size, Share, & Trends Analysis Report By Category, By Type, By Financial Institution, By End Use, And Segment Forecasts, 2022 - 2030 |
||||||
|
|
|||||||
|
● お客様のご希望に応じて、既存データの加工や未掲載情報(例:国別セグメント)の追加などの対応が可能です。 詳細はお問い合わせください。 |
|||||||


| ファクタリングサービスの米国市場:市場規模、シェア、動向分析-カテゴリー別、タイプ別、金融機関別、最終用途別、セグメント予測(2022~2030年) |
|
出版日: 2022年05月02日
発行: Grand View Research
ページ情報: 英文 120 Pages
納期: 2~10営業日
|
- 全表示
- 概要
- 図表
- 目次
米国のファクタリングサービスの市場規模は、2022~2030年にかけて8.1%のCAGRで成長し、2030年までに2,876億1,000万米ドルに達すると予測されています。
市場の成長は、サプライチェーンファイナンスの利点に関する認識と理解の向上、貿易ファイナンスにおけるデジタルプラットフォームの導入の増加に起因していると考えられます。キャッシュフローの改善、日次売上高の未処理額の削減、経理処理時間の短縮への注目が高まっていることが、この地域市場の成長を促す主な要因となっています。
当レポートでは、米国のファクタリングサービス市場について調査分析し、市場の促進要因、抑制要因、課題、カテゴリー・タイプ・金融機関・最終用途別セグメント分析、競合分析、競合情勢に関する情報を提供しています。
目次
第1章 調査手法と範囲
第2章 エグゼクティブサマリー
第3章 米国のファクタリングサービス市場:業界の見通し
- 市場セグメンテーションと範囲
- 浸透と成長見通しのマッピング
- 米国のファクタリングサービス市場の変数分析
- 市場の促進要因分析
- 市場の抑制要因/課題分析
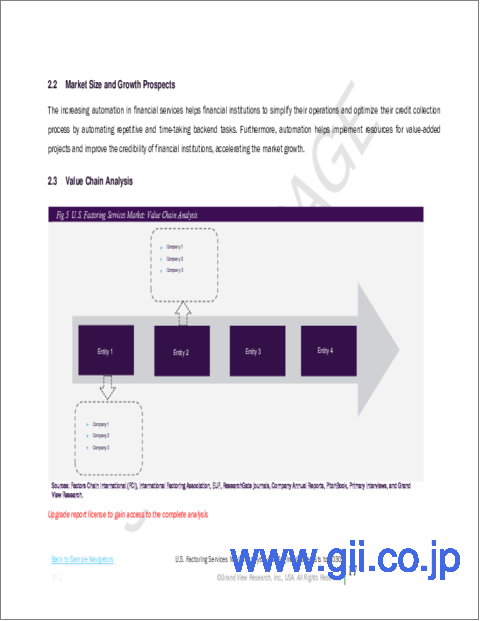
- バリューチェーン分析
- 市場分析ツール
- 米国のファクタリングサービス業界分析-ポーター
- 米国のファクタリングサービス業界分析-PEST
- 米国のファクタリングサービス市場に対するCOVIDの影響
第4章 米国のファクタリングサービス市場:カテゴリーセグメント分析
- 米国のファクタリングサービス市場:カテゴリー別セグメントの見通しと市場シェア-2021年と2030年
- 国内
- 国際
第5章 米国のファクタリングサービス市場:タイプセグメント分析
- 米国のファクタリングサービス市場:タイプ別セグメントの見通しと市場シェア-2021年と2030年
- リコース
- ノンリコース
第6章 米国のファクタリングサービス市場:金融機関セグメント分析
- 米国のファクタリングサービス市場:金融機関別セグメントの見通しと市場シェア-2021年と2030年
- 銀行
- NBFI
第7章 米国のファクタリングサービス市場:最終用途セグメント分析
- 米国のファクタリングサービス市場:最終用途別セグメントの見通しと市場シェア-2021年と2030年
- 製造
- 輸送・物流
- 情報技術
- ヘルスケア
- 建設
- その他
第8章 競合分析
- 最近の開発と影響分析:主要な市場参入者別
- 企業/競合の分類
- ベンダー情勢
第9章 競合情勢
- HSBCグループ
- 企業概要
- 財務実績
- 製品のベンチマーク
- 戦略的イニシアチブ
- BNP Paribas
- 企業概要
- 財務実績
- 製品のベンチマーク
- 戦略的イニシアチブ
- Barclays Plc
- 企業概要
- 財務実績
- 製品のベンチマーク
- 戦略的イニシアチブ
- RTS Financial Services, Inc.
- 企業概要
- 財務実績
- 製品のベンチマーク
- 戦略的イニシアチブ
- TCI Business Capital
- 企業概要
- 財務実績
- 製品のベンチマーク
- 戦略的イニシアチブ
- Riviera Finances of Texas, Inc.
- 企業概要
- 財務実績
- 製品のベンチマーク
- 戦略的イニシアチブ
- CIT Group Inc.
- 企業概要
- 財務実績
- 製品のベンチマーク
- 戦略的イニシアチブ
- Triumph Business Capital
- 企業概要
- 財務実績
- 製品のベンチマーク
- 戦略的イニシアチブ
- Breakout Capital, LLC
- 企業概要
- 財務実績
- 製品のベンチマーク
- 戦略的イニシアチブ
- Charter Capital Holdings LP
- 企業概要
- 財務実績
- 製品のベンチマーク
- 戦略的イニシアチブ
List of Tables
- Table 1 U.S. factoring services market, 2017 - 2030 (USD Billion)
- Table 2 U.S. factoring services market, by category, 2017 - 2030 (USD Billion)
- Table 3 U.S. factoring services market, by type 2017 - 2030 (USD Billion)
- Table 4 U.S. factoring services market, by financial institution 2017 - 2030 (USD Billion)
- Table 5 U.S. factoring services market, by end use, 2017 - 2030 (USD Billion)
- Table 6 U.S. domestic factoring services market, 2017 - 2030 (USD Billion)
- Table 7 U.S. international factoring services market, 2017 - 2030 (USD Billion)
- Table 8 U.S. recourse factoring services market, 2017 - 2030 (USD Billion)
- Table 9 U.S. non-recourse factoring services market, 2017 - 2030 (USD Billion)
- Table 10 U.S. factoring services market in banks, 2017 - 2030 (USD Billion)
- Table 11 U.S. factoring services market in NBFIs, 2017 - 2030 (USD Billion)
- Table 12 U.S. factoring services market in manufacturing, 2017 - 2030 (USD Billion)
- Table 13 U.S. factoring services market in transport & logistics, 2017 - 2030 (USD Billion)
- Table 14 U.S. factoring services market in information technology, 2017 - 2030 (USD Billion)
- Table 15 U.S. factoring services market in construction, 2017 - 2030 (USD Billion)
- Table 16 U.S. factoring services market in other end use, 2017 - 2030 (USD Billion)
List of Figures
- Fig. 1 U.S. factoring services market segmentation and scope
- Fig. 2 Market size and growth prospects
- Fig. 3 Market research process
- Fig. 4 Primary research process
- Fig. 5 Information Analysis
- Fig. 6 Data validation and publishing
- Fig. 7 U.S. factoring services market - Value chain analysis
- Fig. 8 U.S. factoring services market - Market dynamics
- Fig. 9 U.S. factoring services market - Key market driver impact
- Fig. 10 U.S. factoring services market - Key market restraints impact
- Fig. 11 U.S. factoring services market - Porter's analysis
- Fig. 12 U.S. factoring services market - PEST analysis
- Fig. 13 U.S. factoring services market - Company ranking/share analysis, 2021
- Fig. 14 U.S. factoring services market: By category segment outlook & market share, 2021 and 2030
- Fig. 15 U.S. factoring services market: By type segment outlook & market share, 2021 and 2030
- Fig. 16 U.S. factoring services market: By financial institution segment outlook & market share, 2021 and 2030
- Fig. 17 U.S. factoring services market: By end-use segment outlook & market share, 2021 and 2030
U.S. Factoring Services Market Growth & Trends:
The U.S. factoring services market size is expected to reach USD 287.61 billion by 2030 and expand at a CAGR of 8.1% from 2022 to 2030, according to a recent report by Grand View Research, Inc. The market growth can be attributed to the increased awareness and understanding of supply chain financing benefits, and the rising implementation of digital platforms in trade financing. The COVID-19 outbreak significantly affected the U.S. economy leading to supply chain and market disruptions, and inducing a severe financial impact on enterprises and financial markets. As a result, several trucking companies, such as eCapital, Thunder Funding, RTS Financial, and Apex Capital Corp, are having to adapt to the shifts in the supply chain with the help of technological advancements. This will improve the overall supply chain process by reducing operational costs and enhancing the security across the system.
The growing focus on the improvement of cash flow, reduction in day's sales outstanding, and reduced accounting cycle time are the major factors driving the growth of the regional market. Manufacturing companies are looking for new opportunities to improve production processes, support employees in simplifying work while maintaining accuracy and create new and innovative products. Manufacturers are embracing new trends, especially in technology, to remain competitive in the market. With the growing propensity of businesses toward digitalization and automating the process, the demand for accounts receivable automation has seen a surge. The adoption of such types of technologies will further boost the factoring market in the U.S. during the forecast period.
The growing demand for precise management of accounting procedures and timely processing of payment processes from customers is contributing to the growth of the market. These capabilities streamline and improve performance by utilizing e-invoicing, scanning, and workflow, online tracking and reporting capabilities, mobile solutions, electronic invoice dashboards, and analytics for all invoices. It allows organizations to successfully drive the transformation of their accounts receivable departments to overcome the challenges of manual and paper-based processes. This will supplement the growth of the regional market during the forecast period.
U.S. Factoring Services Market Report Highlights:
- The international segment is expected to witness a significant CAGR of 8.8% during the forecast period owing to the rise in open trade accounts, especially from suppliers in emerging economies. The major importers or suppliers in developed countries are considering factoring as a suitable alternative to conventional forms of trade finance, which is further expected to drive the demand for the factoring services in the U.S.
- The non-recourse segment is expected to observe a CAGR of 8.6% during the forecast period. Non-recourse factoring provides lower advanced rates, no long-term contracts, and full credit cover offered by the financing company. These benefits will supplement the growth of the segment in the projection period
- The banks segment is expected to witness significant growth of a CAGR of 7.9% during the forecast period, due to the increasing requirement for alternative sources of financing for Micro, Small and Medium Enterprises (MSMEs). However, the need for working capital should be one of the priorities of MSMEs while running their business and requirements can be triggered by the occurrence of seasonal differences in cash flow, improved business, and events of crisis management among others. Such challenges faced by MSMEs can be addressed by levering factoring services by several banks
- The healthcare segment is expected to observe a CAGR of 9.8% during the forecast period. Insurance-related complications and delays in medical bill payment of medical companies or professionals due to bureaucracy in the payment process are likely to accelerate the demand for factoring services in the healthcare segment during the forecast period
Table of Contents
Chapter 1 Methodology and Scope
- 1.1 Research Methodology
- 1.2 Research Scope and Assumptions
- 1.2.1 Purchased Database
- 1.2.2 GVR'S Internal Database
- 1.2.3 List of secondary sources
- 1.2.4 Primary Research
- 1.3 List of Data sources
- 1.4 Market Formulation & Publishing
- 1.5 Data Validation & Publishing
Chapter 2 Executive Summary
- 2.1 U.S. Factoring Services Market - Industry Snapshot & Key Buying Criteria, 2017 - 2030
- 2.2 U.S. Factoring Services Market, 2017 - 2030 (USD Billion)
- 2.2.2 U.S. Factoring Services Market, By Category, 2017 - 2030 (USD Billion)
- 2.2.3 U.S. Factoring Services Market, By Type, 2017 - 2030 (USD Billion)
- 2.2.3 U.S. Factoring Services Market, By Financial Institution, 2017 - 2030 (USD Billion)
- 2.2.4 U.S. Factoring Services Market, By End Use, 2017 - 2030 (USD Billion)
Chapter 3 U.S. Factoring Services Market: Industry Outlook
- 3.1 Market Segmentation and Scope
- 3.2 Penetration & Growth Prospect Mapping
- 3.3 U.S. Factoring Services Market Variable Analysis
- 3.2.1 Market Driver Analysis
- 3.2.2 Market Restraint/Challenge Analysis
- 3.4 Value Chain Analysis
- 3.5 Market Analysis Tools
- 3.4.1 U.S. factoring services Industry Analysis - Porter's
- 3.4.2 U.S. factoring services Industry Analysis - PEST
- 3.6 Impact of COVID on U.S. Factoring Services Market
Chapter 4 U.S. Factoring Services Market: Category Segment Analysis
- 4.1 U.S. Factoring Services Market: By Category Segment Outlook & Market Share, 2021 and 2030
- 4.2 Domestic
- 4.2.1 U.S. domestic factoring services market, 2017 - 2030 (USD Billion)
- 4.3 International
- 4.3.1 U.S. international factoring services market, 2017 - 2030 (USD Billion)
Chapter 5 U.S. Factoring Services Market: Type Segment Analysis
- 5.1 U.S. Factoring Services Market: By Type Segment Outlook & Market Share, 2021 and 2030
- 5.2 Recourse
- 5.2.1 U.S. recourse factoring services market, 2017 - 2030 (USD Billion)
- 5.3 Non-recourse
- 5.3.1 U.S. non-recourse factoring services market, 2017 - 2030 (USD Billion)
Chapter 6 U.S. Factoring Services Market: Financial Institution Segment Analysis
- 6.1 U.S. Factoring Services Market: By Financial Institution Segment Outlook & Market Share, 2021 and 2030
- 6.2 Banks
- 6.2.1 U.S. factoring services market in Banks, 2017 - 2030 (USD Billion)
- 6.3 NBFIs
- 6.3.1 U.S. factoring services market in NBFIs, 2017 - 2030 (USD Billion)
Chapter 7 U.S. Factoring Services Market: End-use Segment Analysis
- 7.1 U.S. Factoring Services Market: By End-use Segment Outlook & Market Share, 2021 and 2030
- 7.2 Manufacturing
- 7.2.1 U.S. factoring services market in manufacturing, 2017 - 2030 (USD Billion)
- 7.3 Transport & Logistics
- 7.3.1 U.S. factoring services market in transport & logistics, 2017 - 2030 (USD Billion)
- 7.4 Information Technology
- 7.4.1 U.S. factoring services market in information technology, 2017 - 2030 (USD Billion)
- 7.5 Healthcare
- 7.5.1 U.S. factoring services market in healthcare, 2017 - 2030 (USD Billion)
- 7.6 Construction
- 7.6.1 U.S. factoring services market in construction, 2017 - 2030 (USD Billion)
- 7.7 Others
- 7.7.1 U.S. factoring services market in other end use, 2017 - 2030 (USD Billion)
Chapter 8 Competitive Analysis
- 8.1 Recent Developments and Impact Analysis, by Key Market Participants
- 8.2 Company/Competition Categorization
- 8.3 Vendor Landscape
- 8.3.1 U.S. Factoring Services Market: Key Company Market Ranking/Share Analysis, 2021
Chapter Competitive Landscape
- 9.1 HSBC Group
- 9.1.1 Company overview
- 9.1.2 Financial performance
- 9.1.3 Product benchmarking
- 9.1.4 Strategic initaiatives
- 9.2 BNP Paribas
- 9.2.1 Company overview
- 9.2.2 Financial performance
- 9.2.3 Product benchmarking
- 9.2.4 Strategic initaiatives
- 9.3 Barclays Plc
- 9.3.1 Company overview
- 9.3.2 Financial performance
- 9.3.3 Product benchmarking
- 9.3.4 Strategic initaiatives
- 9.4 RTS Financial Services, Inc.
- 9.4.1 Company overview
- 9.4.2 Financial performance
- 9.4.3 Product benchmarking
- 9.4.4 Strategic initaiatives
- 9.5 TCI Business Capital
- 9.5.1 Company overview
- 9.5.2 Financial performance
- 9.5.3 Product benchmarking
- 9.5.4 Strategic initaiatives
- 9.6 Riviera Finances of Texas, Inc.
- 9.6.1 Company overview
- 9.6.2 Financial performance
- 9.6.3 Product benchmarking
- 9.6.4 Strategic initaiatives
- 9.7 CIT Group Inc.
- 9.7.1 Company overview
- 9.7.2 Financial performance
- 9.7.3 Product benchmarking
- 9.7.4 Strategic initaiatives
- 9.8 Triumph Business Capital
- 9.8.1 Company overview
- 9.8.2 Financial performance
- 9.8.3 Product benchmarking
- 9.8.4 Strategic initaiatives
- 9.9 Breakout Capital, LLC
- 9.9.1 Company overview
- 9.9.2 Financial performance
- 9.9.3 Product benchmarking
- 9.9.4 Strategic initaiatives
- 9.10 Charter Capital Holdings LP
- 9.10.1 Company overview
- 9.10.2 Financial performance
- 9.10.3 Product benchmarking
- 9.10.4 Strategic initaiatives