|
|
市場調査レポート
商品コード
1076682
フェムテックの世界市場 - 市場規模・シェア・動向分析レポート:製品タイプ別(ウェアラブル、モバイルアプリ)、地域別、セグメント別の予測(2022年~2030年)Femtech Market Size, Share & Trends Analysis Report By Product Type (Wearable, Mobile Apps), By Region, And Segment Forecasts, 2022 - 2030 |
||||||
|
|
|||||||
|
● お客様のご希望に応じて、既存データの加工や未掲載情報(例:国別セグメント)の追加などの対応が可能です。 詳細はお問い合わせください。 |
|||||||


| フェムテックの世界市場 - 市場規模・シェア・動向分析レポート:製品タイプ別(ウェアラブル、モバイルアプリ)、地域別、セグメント別の予測(2022年~2030年) |
|
出版日: 2022年04月29日
発行: Grand View Research
ページ情報: 英文 153 Pages
納期: 2~10営業日
|
- 全表示
- 概要
- 図表
- 目次
世界のフェムテックの市場規模は、2030年までに131億米ドルに達し、予測期間中にCAGRで11.1%の成長が予測されています。
女性の健康問題の増加や健康意識の高まりが、市場の成長可能性を示しています。
当レポートでは、世界のフェムテック市場について調査分析し、市場の動向、製品タイプ・地域別の分析、競合情勢などを提供しています。
目次
第1章 調査手法と範囲
- 調査プロセス
- 情報またはデータの分析
- 提供可能で利用可能な市場規模(SAM)- 調査手法
- TAMの計算方法
- 市場の形成と検証
- データソースのリスト
第2章 エグゼクティブサマリー
第3章 フェムテック市場の変数・動向・範囲
- 市場セグメンテーションと範囲
- 浸透と成長の見通しのマッピング
- 市場促進要因分析
- 市場抑制要因分析
- フェムテック業界分析 - ポーターのファイブフォース分析
- 利用可能な最大市場規模の分析(2017年~2021年~2030年)
- 獲得可能な最大市場機会の分析(2017年~2021年~2030年)
- 満たされていない需要/ギャップの分析
- 人口統計分析 - 国別の市場
- 健康アプリに対する女性の認識
- 開始時から潜在的な採用傾向を示している女性向け健康アプリのケーススタディ
- 主要な女性向け健康アプリのリスト:月間アクティブユーザー数別
- 主要な女性向け健康アプリのリスト:先月のダウンロード数別
- COVID-19がフェムテック市場に与える影響
第4章 フェムテック市場:推計と動向分析、製品タイプ別
- フェムテック市場:動向分析、製品タイプ別(2021年・2030年)
- ウェアラブル
- モバイルアプリ
第5章 フェムテック市場:地域の推計と動向分析、製品タイプ別
- フェムテック市場シェア:地域別(2021年・2030年)
- 北米
- 欧州
- アジア太平洋
- ラテンアメリカ
第6章 フェムテック市場:競合分析
- 最近の動向と影響分析:主要な市場参入企業別
- 企業/競合の分類(主要なイノベーター、マーケットリーダー、新興企業)
- 企業の市況分析
- 主要な女性向け健康アプリのリスト:ダウンロード数別
- 主要企業の競合分析
第7章 競合情勢
- 企業プロファイル
- Natural Cycles USA Corp
- Flo Health, Inc.
- Clue by Biowink GmbH
- Glow, Inc.
- Apple, Inc.
- Google, Inc.
- Withings
- Fitbit, Inc
- その他の企業のリスト
List of Tables
- Table 1 Number of married women (Millions)
- Table 2 Number of women, 20-24 years (Millions)
- Table 3 Number of women, 25-29 years (Millions)
- Table 4 Number of women, 15-64 years (Millions)
- Table 5 Number of women, 65+ years (Millions)
- Table 6 Estimated number of sexually active women, (Millions)
- Table 7 Estimated number of pregnant females
- Table 8 Estimated number of menopausal females (50+ years) (Millions)
- Table 9 Literacy rate, Number of females (15+ years) (Millions)
- Table 10 Leading women's health applications, by number of monthly active users
- Table 11 Leading women's health applications, by number of downloads in the last month
- Table 12 Leading women's health applications, by number of downloads
- Table 13 North America femtech market estimates and forecasts, by product type, 2017 - 2030 (USD Million)
- Table 14 U.S. femtech market estimates and forecasts, by product type, 2017 - 2030 (USD Million)
- Table 15 Canada femtech market estimates and forecasts, by product type, 2017 - 2030 (USD Million)
- Table 16 Europe femtech market estimates and forecasts, by product type, 2017 - 2030 (USD Million)
- Table 17 UK femtech market estimates and forecasts, by product type, 2017 - 2030 (USD Million)
- Table 18 Germany femtech market estimates and forecasts, by product type, 2017 - 2030 (USD Million)
- Table 19 France femtech market estimates and forecasts, by product type, 2017 - 2030 (USD Million)
- Table 20 Italy femtech market estimates and forecasts, by product type, 2017 - 2030 (USD Million)
- Table 21 Spain femtech market estimates and forecasts, by product type, 2017 - 2030 (USD Million)
- Table 22 Russia femtech market estimates and forecasts, by product type, 2017 - 2030 (USD Million)
- Table 23 Denmark femtech market estimates and forecasts, by product type, 2017 - 2030 (USD Million)
- Table 24 Finland femtech market estimates and forecasts, by product type, 2017 - 2030 (USD Million)
- Table 25 Iceland femtech market estimates and forecasts, by product type, 2017 - 2030 (USD Million)
- Table 26 Norway femtech market estimates and forecasts, by product type, 2017 - 2030 (USD Million)
- Table 27 Sweden femtech market estimates and forecasts, by product type, 2017 - 2030 (USD Million)
- Table 28 Asia Pacific femtech market estimates and forecasts, by product type, 2017 - 2030 (USD Million)
- Table 29 China femtech market estimates and forecasts, by product type, 2017 - 2030 (USD Million)
- Table 30 Japan femtech market estimates and forecasts, by product type, 2017 - 2030 (USD Million)
- Table 31 India femtech market estimates and forecasts, by product type, 2017 - 2030 (USD Million)
- Table 32 Singapore femtech market estimates and forecasts, by product type, 2017 - 2030 (USD Million)
- Table 33 South Korea femtech market estimates and forecasts, by product type, 2017 - 2030 (USD Million)
- Table 34 Australia femtech market estimates and forecasts, by product type, 2017 - 2030 (USD Million)
- Table 35 Latin America femtech market estimates and forecasts, by product type, 2017 - 2030 (USD Million)
- Table 36 Brazil femtech market estimates and forecasts, by product type, 2017 - 2030 (USD Million)
- Table 37 Mexico femtech market estimates and forecasts, by product type, 2017 - 2030 (USD Million)
- Table 38 Argentina femtech market estimates and forecasts, by product type, 2017 - 2030 (USD Million)
List of Figures
- Fig. 1 Market research process
- Fig. 2 Information procurement
- Fig. 3 Primary research pattern
- Fig. 4 Market research approaches
- Fig. 5 Value chain-based sizing & forecasting
- Fig. 6 QFD modelling for market share assessment
- Fig. 7 Number of companies in Femtech, by type
- Fig. 8 Market formulation & validation
- Fig. 9 Women's health technology market summary, 2021, (USD Million)
- Fig. 10 Women's health technology market trends & outlook
- Fig. 11 Women's health technology market segmentation
- Fig. 12 Penetration & growth prospect mapping
- Fig. 13 Market driver analysis (Current & future impact)
- Fig. 14 Market restraint analysis (Current & future impact)
- Fig. 15 Total Addressable Market (TAM) and Serviceable Addressable Market (SAM) for Femtech Apps (2017-2021-2030)
- Fig. 16 Total Addressable Market (TAM) and Serviceable Addressable Market (SAM) for Femtech Wearables (2017-2021-2030)
- Fig. 17 Total obtainable market opportunity analysis (2017-2021-2030)
- Fig. 18 Number of female populations, by regional map
- Fig. 19 Women's health apps manufacturer target geographies
- Fig. 20 Estimated number of pregnant females, by country
- Fig. 21 Estimated number of menopausal females, by country
- Fig. 22 Comparative analysis, by country
- Fig. 23 Respondents utilizing diverse types of apps (%)
- Fig. 24 Types of female health apps utilized by respondents (%)
- Fig. 25 Total number of installations of Flo app (millions)
- Fig. 26 Total number of monthly users of Flo app (millions)
- Fig. 27 Total number of users of Kindara application (USD millions)
- Fig. 28 Total number of subscribers of the Natural Cycles app (millions)
- Fig. 27 Women's health technology market, Product type outlook key takeaways (USD Million)
- Fig. 28 Women's health technology market: Product type movement analysis (USD Million), 2021 & 2030
- Fig. 29 Revenue estimates and forecasts for wearables, 2017 - 2030, USD Million
- Fig. 30 Revenue estimates and forecasts for mobile applications, 2017 - 2030, USD Million
- Fig. 31 Revenue estimates and forecasts for fitness & nutrition, 2017 - 2030 (USD million)
- Fig. 32 Revenue estimates and forecasts for menstrual health, 2017 - 2030 (USD million)
- Fig. 33 Revenue estimates and forecasts for fertility management, 2017 - 2030 (USD million)
- Fig. 34 Revenue estimates and forecasts for pregnancy tracking and postpartum care, 2017 - 2030 (USD million)
- Fig. 35 Revenue estimates and forecasts for menopause, 2017 - 2030 (USD million)
- Fig. 36 Revenue estimates and forecasts for disease management, 2017 - 2030 (USD million)
- Fig. 37 Revenue estimates and forecasts for others, 2017 - 2030 (USD million)
- Fig. 38 Regional marketplace: Key takeaways
- Fig. 39 Women's health technology market: Regional outlook, 2021 & 2030, USD Million
- Fig. 40 North America women's health technology market estimates and forecasts, 2017 - 2030 (USD million)
- Fig. 41 U.S. women's health technology market estimates and forecasts, 2017 - 2030 (USD million)
- Fig. 42 Canada women's health technology market estimates and forecasts, 2017 - 2030 (USD million)
- Fig. 43 Europe women's health technology market estimates and forecasts, 2017 - 2030 (USD million)
- Fig. 44 UK women's health technology market estimates and forecasts, 2017 - 2030 (USD million)
- Fig. 45 Germany women's health technology market estimates and forecasts, 2017 - 2030 (USD million)
- Fig. 46 France women's health technology market estimates and forecasts, 2017 - 2030 (USD million)
- Fig. 47 Italy women's health technology market estimates and forecasts, 2017 - 2030 (USD million)
- Fig. 48 Spain women's health technology market estimates and forecasts, 2017 - 2030 (USD million)
- Fig. 49 Russia women's health technology market estimates and forecasts, 2017 - 2030 (USD million)
- Fig. 50 Denmark women's health technology market estimates and forecasts, 2017 - 2030 (USD million)
- Fig. 51 Iceland women's health technology market estimates and forecasts, 2017 - 2030 (USD million)
- Fig. 52 Finland women's health technology market estimates and forecasts, 2017 - 2030 (USD million)
- Fig. 53 Norway women's health technology market estimates and forecasts, 2017 - 2030 (USD million)
- Fig. 54 Sweden women's health technology market estimates and forecasts, 2017 - 2030 (USD million)
- Fig. 55 Asia Pacific women's health technology market estimates and forecasts, 2017 - 2030 (USD Million)
- Fig. 56 Japan women's health technology market estimates and forecasts, 2017 - 2030 (USD million)
- Fig. 57 China women's health technology market estimates and forecasts, 2017 - 2030 (USD million)
- Fig. 58 India women's health technology market estimates and forecasts, 2017 - 2030 (USD million)
- Fig. 59 Australia women's health technology market estimates and forecasts, 2017 - 2030 (USD million)
- Fig. 60 Singapore women's health technology market estimates and forecasts, 2017 - 2030 (USD million)
- Fig. 61 South Korea women's health technology market estimates and forecasts, 2017 - 2030 (USD million)
- Fig. 62 Latin America women's health technology market estimates and forecasts, 2017 - 2030 (USD million)
- Fig. 63 Brazil women's health technology market estimates and forecasts, 2017 - 2030 (USD million)
- Fig. 64 Mexico women's health technology market estimates and forecasts, 2017 - 2030 (USD million)
- Fig. 65 Argentina women's health technology market estimates and forecasts, 2017 - 2030 (USD million)
- Fig. 66 Company market position analysis
Femtech Market Growth & Trends:
The global femtech market size is expected to reach USD 13.1 billion by 2030 and is expected to expand at a CAGR of 11.1% during the forecast period, according to a new report by Grand View Research, Inc. Rising number of women's health issues and growing health consciousness indicates the growth potential of the market.
The industry is not only limited to reproductive health and diversifies to include other healthcare problems such as pregnancy monitoring, pelvic care, cervical cancer, mental health, general health & wellness, and breast cancer. Key participants are capitalizing on the opportunities and are developing solutions to cater to the growing needs of women's healthcare.
The increasing adoption of smartphones by consumers is driving the growth of various women's health applications in the market. Furthermore, continuous improvement in network infrastructure and growing network coverage are boosting the demand for femtech services. Mobile network operators view women's health technology space as an opportunity for investment owing to the growing adoption of smartphones by users and raising awareness about women's health issues.
Furthermore, a favorable regulatory environment and increase in regulatory approvals of various digital applications addressing conventional women's health issues, such as menstruation tracking, pregnancy management, & fertility management, are expected to contribute directly to growth. The wearables segment dominated in 2021 owing to the growing health consciousness and awareness amongst female users, increasing prevalence of women's health issues, growing adoption of value-based care services, and integration of advanced features such as predictive analytics, gamification, cloud synchronization, and longer battery life. Data generated from wearable devices can be used to under female health parameters more closely and provide female users with data-driven insights about their health & wellbeing.
On the other hand, mobile apps are expected to grow lucratively in upcoming years owing to the growing trend of precautionary healthcare and rapidly growing smartphone penetration supported by improving internet connectivity. With advanced technological integration, such as AI and data science, these healthcare applications provide actionable insights based on the data entered, enabling women to make informed decisions regarding their health & wellness.
Furthermore, the physicians and doctors can also refer to the data, consequently bridging the gap between the healthcare providers and the patients, further enabling access to care virtually, timely, & in remote areas.
Femtech Market Report Highlights:
- The market size is anticipated to be valued at USD 13.1 billion by 2030, owing to the increasing digital literacy amongst female users, increasing smartphone penetration & improving internet connectivity. Growing health consciousness amongst female users and normalizing women's health issues
- Wearables accounted for the largest revenue market share of 79.5% owing to seamless smartphone integration and improving wireless connectivity
- North America dominated the market and accounted for the largest revenue share of 38.3% owing to improving digital health infrastructure, rising healthcare IT expenditure, growing smartphone integration, and the emergence of startups
Table of Contents
Chapter 1 Research Methodology and Scope
- 1.1 Research Process
- 1.1.1 Information Procurement
- 1.2 Information or Data Analysis
- 1.3 Serviceable Addressable Market (SAM)- Research Methodology
- 1.4 TAM Calculation Methodology
- 1.5 Market Formulation & Validation
- 1.5.1 Country Market: CAGR Calculation
- 1.6 List of Data Sources
Chapter 2 Executive Summary
- 2.1 Market Outlook
- 2.2 Segment Outlook
- 2.3 Regional Insights
- 2.4 Competitive Insights
- 2.5 Market Snapshot
Chapter 3 Women's Health Technology Market Variables, Trends & Scope
- 3.1 Market Segmentation & Scope
- 3.2 Penetration and Growth Prospect Mapping
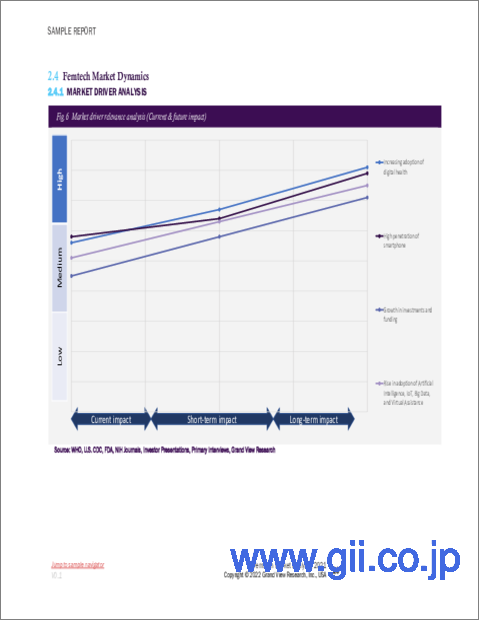
- 3.3 Market Driver Analysis
- 3.3.1 increasing adoption of digital health
- 3.3.2 high penetration of smartphones
- 3.3.3 rise in artificial intelligence, IoT, big data, and virtual assistance
- 3.3.4 Growth in investments and funding
- 3.4 Market Restraint Analysis
- 3.4.1 cybersecurity and privacy concerns
- 3.4.2 Inadequate R&D expenditure
- 3.5 Women's Health Technology Industry Analysis - Porter's Five Analysis
- 3.5.1 Bargaining power of suppliers: low
- 3.5.2 Bargaining power of the buyers: moderately high
- 3.5.3 Threat of substitution: moderately low
- 3.5.4 Threats of new entrants: moderate
- 3.5.5 Competitive rivalry: high
- 3.6 Total Addressable Market Analysis (2017-2021-2030)
- 3.7 Total Obtainable Market Opportunity Analysis (2017-2021-2030)
- 3.8 Unmet Demand/Gap Analysis
- 3.8.1 Benchmarking of top women's health apps based on applications
- 3.8.2 Comparative analysis of top women's health apps
- 3.8.3 Analysis of unmet demand in solutions for detecting opportunity
- 3.8.4 Case studies of women's health app types signifying growth potential and unmet needs
- 3.8.4.1 Menopause
- 3.8.4.2 Maternal Health And Maternal Mortality
- 3.8.5 Fab (Feature, Advantage, And Benefit) Analysis
- 3.9 Demographic Analysis-Country Level Market
- 3.9.1 Number Of Married Women, By Country
- 3.9.2 Number Of Women, By Age Group, By Country
- 3.9.3 Estimated Number Of Sexually Active Women, By Country
- 3.9.4 Estimated Number Of Pregnant Females, By Country
- 3.9.5 Estimated Number Of Menopausal Females (50+ Years) (Millions), By Country
- 3.9.6 Literacy Rate, Number Of Females (15+ Years) (Millions), By Country
- 3.10 Women's Perception Of Health Applications
- 3.11 Case Studies of Women's Health Applications Signifying Potential Adoption Trends From The Time of Inception
- 3.11.1 Flo
- 3.11.2 Clue
- 3.11.3 Bonzun IVF
- 3.11.4 Caria
- 3.11.5 Kindara
- 3.11.6 Natural Cycles
- 3.12 List of Top Women's Health Applications, by Number of Monthly Active Users
- 3.13 List of Top Women's Health Applications, by Number of Downloads in the Last Month
- 3.14 Impact of COVID - 19 on Women's Health Technology Market
Chapter 4 Women's Health Technology Market: Product Type Estimates & Trend Analysis
- 4.1 Women's Health Technology Market: Product Type Movement Analysis, USD Million, 2021 & 2030
- 4.1.1 Wearables
- 4.1.1.1 Revenue estimates and forecasts for wearables, 2017 - 2030, USD Million
- 4.1.2 Mobile Applications
- 4.1.2.1 Revenue estimates and forecasts for mobile applications, 2017 - 2030, USD Million
- 4.1.2.2 Fitness & Nutrition
- 4.1.2.2.1 Revenue Estimates And Forecasts For Fitness & Nutrition, 2017 - 2030 (USD Million)
- 4.1.2.3 Menstrual Health
- 4.1.2.3.1 Revenue Estimates And Forecasts For Menstrual Health, 2017 - 2030 (USD Million)
- 4.1.2.4 Fertility Management (Apps Assisting In Art)
- 4.1.2.4.1 Revenue Estimates And Forecasts For Fertility Management, 2017 - 2030 (USD Million)
- 4.1.2.5 Pregnancy Tracking & Postpartum Care
- 4.1.2.5.1 Revenue Estimates And Forecasts For Pregnancy Tracking & Postpartum Care, 2017 - 2030 (USD Million)
- 4.1.2.6 Menopause
- 4.1.2.6.1 Revenue Estimates And Forecasts For Menopause, 2017 - 2030 (USD Million)
- 4.1.2.7 Disease Management
- 4.1.2.7.1 Revenue Estimates And Forecasts For Disease Management, 2017 - 2030 (USD Million)
- 4.1.2.8 OTHERS
- 4.1.2.8.1 Revenue estimates and forecasts for others, 2017 - 2030 (USD million)
- 4.1.1 Wearables
Chapter 5 Women's Health Technology Market: Regional Estimates & Trend Analysis, By Product Type
- 5.1 Women's Health Technology Market Share, By Region, 2021 & 2030, USD Million
- 5.2 North America
- 5.2.1 North America women's health technology market estimates and forecasts, 2017 - 2030 (USD Million)
- 5.2.2 the U.S.
- 5.2.2.1 U.S. women's health technology market estimates and forecasts, 2017 - 2030 (USD Million)
- 5.2.3 Canada
- 5.2.3.1 Canada women's health technology market estimates and forecasts, 2017 - 2030 (USD Million)
- 5.3 Europe
- 5.3.1 Europe women's health technology market estimates and forecasts, 2017 - 2030 (USD Million)
- 5.3.2 the UK
- 5.3.2.1 UK women's health technology market estimates and forecasts, 2017 - 2030 (USD Million)
- 5.3.3 Germany
- 5.3.3.1 Germany women's health technology market estimates and forecasts, 2017 - 2030 (USD million)
- 5.3.4 France
- 5.3.4.1 France women's health technology market estimates and forecasts, 2017 - 2030 (USD million)
- 5.3.5 Italy
- 5.3.5.1 Italy women's health technology market estimates and forecasts, 2017 - 2030 (USD million)
- 5.3.6 Spain
- 5.3.6.1 Spain women's health technology market estimates and forecasts, 2017 - 2030 (USD million)
- 5.3.7 Russia
- 5.3.7.1 Russia women's health technology market estimates and forecasts, 2017 - 2030 (USD million)
- 5.3.8 Denmark
- 5.3.8.1 Denmark women's health technology market estimates and forecasts, 2017 - 2030 (USD million)
- 5.3.9 Iceland
- 5.3.9.1 Iceland women's health technology market estimates and forecasts, 2017 - 2030 (USD million)
- 5.3.10 Finland
- 5.3.10.1 Finland women's health technology market estimates and forecasts, 2017 - 2030 (USD million)
- 5.3.11 Norway
- 5.3.11.1 Norway women's health technology market estimates and forecasts, 2017 - 2030 (USD million)
- 5.3.12 Sweden
- 5.3.12.1 Sweden women's health technology market estimates and forecasts, 2017 - 2030 (USD million)
- 5.4 the Asia Pacific
- 5.4.1 Asia pacific women's health technology market estimates and forecasts, 2017 - 2030 (USD Million)
- 5.4.2 Japan
- 5.4.2.1 Japan women's health technology market estimates and forecasts, 2017 - 2030 (USD million)
- 5.4.3 China
- 5.4.3.1 China women's health technology market estimates and forecasts, 2017 - 2030 (USD million)
- 5.4.4 India
- 5.4.4.1 India women's health technology market estimates and forecasts, 2017 - 2030 (USD million)
- 5.4.5 Australia
- 5.4.5.1 Australia women's health technology market estimates and forecasts, 2017 - 2030 (USD million)
- 5.4.6 Singapore
- 5.4.6.1 Singapore women's health technology market estimates and forecasts, 2017 - 2030 (USD million)
- 5.4.7 South Korea
- 5.4.7.1 South Korea women's health technology market estimates and forecasts, 2017 - 2030 (USD million)
- 5.5 Latin America
- 5.5.1 Latin America women's health technology market estimates and forecasts, 2017 - 2030 (USD Million)
- 5.5.2 Brazil
- 5.5.2.1 Brazil women's health technology market estimates and forecasts, 2017 - 2030 (USD Million)
- 5.5.3 Mexico
- 5.5.3.1 Mexico women's health technology market estimates and forecasts, 2017 - 2030 (USD Million)
- 5.5.4 Argentina
- 5.5.4.1 Argentina women's health technology market estimates and forecasts, 2017 - 2030 (USD Million)
Chapter 6 Women's Health Technology Market: Competitive Analysis
- 6.1 Recent Developments & Impact Analysis, by Key Market Participants
- 6.2 Company/Competition Categorization (Key Innovators, Market Leaders, Emerging Players)
- 6.3 Company Market Position Analysis
- 6.4 List of Top Women's Health Applications, by Number of Downloads
- 6.5 Competitive Analysis of Key Players
Chapter 7 Competitive Landscape
- 7.1 Company Profiles
- 7.1.1 Natural Cycles USA Corp
- 7.1.1.1 Company overview
- 7.1.1.2 Financial performance
- 7.1.1.3 Product benchmarking
- 7.1.1.4 Strategic initiatives
- 7.1.2 Flo Health, Inc.
- 7.1.2.1 Company overview
- 7.1.2.2 Financial performance
- 7.1.2.3 Product benchmarking
- 7.1.2.4 Strategic initiatives
- 7.1.3 Clue by Biowink GmbH
- 7.1.3.1 Company overview
- 7.1.3.2 Financial performance
- 7.1.3.3 Product benchmarking
- 7.1.3.4 Strategic initiatives
- 7.1.4 Glow, Inc.
- 7.1.4.1 Company overview
- 7.1.4.2 Financial performance
- 7.1.4.3 Product benchmarking
- 7.1.4.4 Strategic initiatives
- 7.1.5 Apple, Inc.
- 7.1.5.1 Company overview
- 7.1.5.2 Financial performance
- 7.1.5.3 Product benchmarking
- 7.1.5.4 Strategic initiatives
- 7.1.6 Google, Inc.
- 7.1.6.1 Company overview
- 7.1.6.2 Financial Performance
- 7.1.6.3 Product benchmarking
- 7.1.6.4 Strategic initiatives
- 7.1.7 Withings
- 7.1.7.1 Company overview
- 7.1.7.2 Financial Performance
- 7.1.7.3 Product benchmarking
- 7.1.7.4 Strategic initiatives
- 7.1.8 Fitbit, Inc
- 7.1.8.1 Company overview
- 7.1.8.2 Financial performance
- 7.1.8.3 Product benchmarking
- 7.1.8.4 Strategic initiatives
- 7.1.1 Natural Cycles USA Corp
- 7.2 List of Other Companies