|
|
市場調査レポート
商品コード
1768739
磁性材料の世界市場Magnetic Materials |
||||||
|
|||||||
適宜更新あり
|
|||||||

| 磁性材料の世界市場 |
|
出版日: 2025年07月11日
発行: Market Glass, Inc. (Formerly Global Industry Analysts, Inc.)
ページ情報: 英文 256 Pages
納期: 即日から翌営業日
|

全表示
- 概要
- 目次
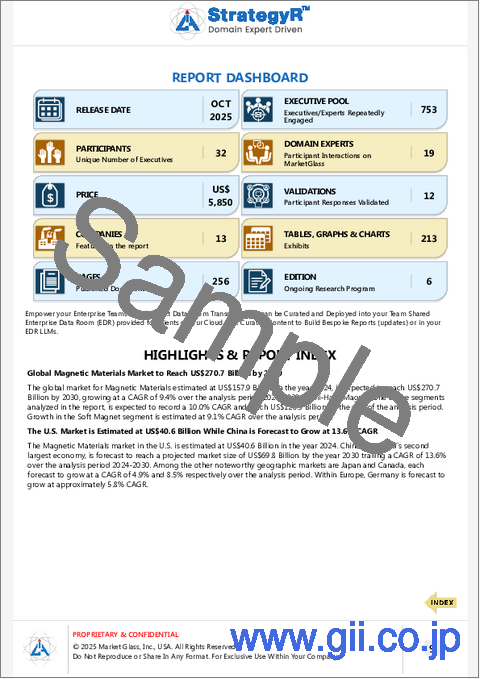
磁性材料の世界市場は2030年までに2,707億米ドルに到達
2024年に1,579億米ドルと推定される磁性材料の世界市場は、2024年から2030年にかけてCAGR 9.4%で成長し、2030年には2,707億米ドルに達すると予測されます。本レポートで分析したセグメントの1つであるセミハードマグネットは、CAGR 10.0%を記録し、分析期間終了までに1,209億米ドルに達すると予測されます。ソフト磁石セグメントの成長率は、分析期間でCAGR 9.1%と推定されます。
米国市場は406億米ドル、中国はCAGR13.6%で成長予測
米国の磁性材料市場は、2024年に406億米ドルと推定されます。世界第2位の経済大国である中国は、2030年までに698億米ドルの市場規模に達すると予測され、分析期間2024-2030年のCAGRは13.6%です。その他の注目すべき地域別市場としては、日本とカナダがあり、分析期間中のCAGRはそれぞれ4.9%と8.5%と予測されています。欧州では、ドイツがCAGR 5.8%で成長すると予測されています。
世界の磁性材料市場- 主要動向と促進要因のまとめ
磁性材料はどのように現代技術を形成しているのか?
磁性材料は、コンシューマーエレクトロニクスや発電から医療機器や輸送に至るまで、幅広い現代技術において重要なコンポーネントです。これらの材料には、トランスやインダクタに使用されるソフトな磁性材料と、永久磁石に使用されるハードな磁性材料があり、電気エネルギーの生成、貯蔵、伝送に不可欠です。自動車産業では、磁性材料は電気自動車の電気モーターやセンサーの作動に不可欠です。エレクトロニクス分野では、データ記憶装置やセンサーに使用されています。効率的なエネルギーソリューションと先端技術への需要が高まるにつれ、磁性材料は伝統的な産業と新興産業の両方において、ますます重要性を増しています。
磁性材料市場を形成するイノベーションとは?
磁性材料市場は、ナノテクノロジー、材料科学、製造プロセスにおけるイノベーションによって形成されています。レアアース(希土類)フリーの磁性材料の開発は、メーカーが高価で調達が困難なレアアースへの依存を減らそうとしているため、勢いを増しています。さらに、高性能フェライト磁石やボンド磁石の進歩により、電気モーターや風力タービンなど、磁性材料に依存するデバイスの効率や出力密度が向上しています。また、ワイヤレス充電システムや磁気共鳴画像装置(MRI)などの新技術への磁性材料の統合も、この分野の研究開発を促進しています。
市場セグメンテーションは磁性材料の成長をどのように定義するか?
磁性材料の種類には、ソフト磁性材料、ハード磁性材料、セミハード磁性材料があり、ハード磁性材料(ネオジム磁石など)はモーターや発電機の永久磁石に使用されるため、市場を独占しています。用途は、エネルギー生成、貯蔵から家電、医療機器まで幅広く、中でもエネルギー生成は、風力タービンや電気自動車の採用が増加しているため、主要な成長分野となっています。最終用途産業には、自動車、エレクトロニクス、エネルギー、ヘルスケア、工業製造などがあり、電気自動車の生産台数の増加に伴い、自動車産業が市場をリードしています。
磁性材料市場の成長を促進する要因は?
磁性材料市場の成長は、電気自動車需要の高まり、再生可能エネルギーインフラの拡大、先端エレクトロニクスの利用拡大など、いくつかの要因によって牽引されています。クリーンエネルギーと電動モビリティへのシフトが加速するにつれ、電気モーター、発電機、エネルギー貯蔵システムにおける高性能磁性材料の必要性が高まっています。さらに、データストレージ、画像処理、センシングに磁性材料を使用するコンシューマーエレクトロニクスや医療機器の普及が、市場の成長に寄与しています。レアアース・フリー磁石やその他の持続可能なソリューションの継続的な開発も、この市場の今後の成長を促進する上で重要な役割を果たすと予想されます。
セグメント
タイプ(半硬質磁石,軟質磁石,永久磁石/硬質磁石);用途(自動車,エレクトロニクス,産業,発電,その他の用途)
調査対象企業の例
- Arnold Magnetic Technologies Corporation
- Daido Steel Co. Ltd.
- Dexter Magnetic Technologies
- Electron Energy Corporation
- Hitachi Metals Ltd.
- Lynas Corporation Ltd.
- Molycorp Inc.
- Shin-ETSU Chemical Co., Ltd.
- TDK Corporation
- Tengam Engineering Inc.
エーアイ・インテグレーションズ
Global Industry Analystsは、有効な専門家コンテンツとAIツールによって、市場情報と競合情報を変革しています。
Global Industry Analystsは、LLMや業界固有のSLMを照会する一般的な規範に従う代わりに、ビデオ記録、ブログ、検索エンジン調査、膨大な量の企業、製品/サービス、市場データなど、世界中の専門家から収集したコンテンツのリポジトリを構築しました。
関税影響係数
Global Industry Analystsは、本社の国、製造拠点、輸出入(完成品とOEM)に基づく企業の競争力の変化を予測しています。この複雑で多面的な市場力学は、売上原価(COGS)の増加、収益性の低下、サプライチェーンの再構築など、ミクロおよびマクロの市場力学の中でも特に競合他社に影響を与える見込みです。
目次
第1章 調査手法
第2章 エグゼクティブサマリー
- 市場概要
- 主要企業
- 市場動向と促進要因
- 世界市場の見通し
第3章 市場分析
- 米国
- カナダ
- 日本
- 中国
- 欧州
- フランス
- ドイツ
- イタリア
- 英国
- スペイン
- ロシア
- その他欧州
- アジア太平洋
- オーストラリア
- インド
- 韓国
- その他アジア太平洋地域
- ラテンアメリカ
- アルゼンチン
- ブラジル
- メキシコ
- その他ラテンアメリカ
- 中東
- イラン
- イスラエル
- サウジアラビア
- アラブ首長国連邦
- その他中東
- アフリカ
第4章 競合
Global Magnetic Materials Market to Reach US$270.7 Billion by 2030
The global market for Magnetic Materials estimated at US$157.9 Billion in the year 2024, is expected to reach US$270.7 Billion by 2030, growing at a CAGR of 9.4% over the analysis period 2024-2030. Semi-Hard Magnet, one of the segments analyzed in the report, is expected to record a 10.0% CAGR and reach US$120.9 Billion by the end of the analysis period. Growth in the Soft Magnet segment is estimated at 9.1% CAGR over the analysis period.
The U.S. Market is Estimated at US$40.6 Billion While China is Forecast to Grow at 13.6% CAGR
The Magnetic Materials market in the U.S. is estimated at US$40.6 Billion in the year 2024. China, the world's second largest economy, is forecast to reach a projected market size of US$69.8 Billion by the year 2030 trailing a CAGR of 13.6% over the analysis period 2024-2030. Among the other noteworthy geographic markets are Japan and Canada, each forecast to grow at a CAGR of 4.9% and 8.5% respectively over the analysis period. Within Europe, Germany is forecast to grow at approximately 5.8% CAGR.
Global Magnetic Materials Market - Key Trends and Drivers Summarized
How Are Magnetic Materials Shaping Modern Technology?
Magnetic materials are critical components in a wide range of modern technologies, from consumer electronics and power generation to medical devices and transportation. These materials, which include soft magnetic materials (used in transformers and inductors) and hard magnetic materials (used in permanent magnets), are essential for generating, storing, and transmitting electrical energy. In the automotive industry, magnetic materials are integral to the operation of electric motors and sensors in electric vehicles. In the electronics sector, they are used in data storage devices and sensors. As demand for efficient energy solutions and advanced technologies grows, magnetic materials are becoming increasingly important for both traditional and emerging industries.
What Innovations Are Shaping the Magnetic Materials Market?
The magnetic materials market is being shaped by innovations in nanotechnology, materials science, and manufacturing processes. The development of rare-earth-free magnetic materials is gaining momentum as manufacturers seek to reduce dependency on rare-earth elements, which are expensive and difficult to source. Additionally, advancements in high-performance ferrite magnets and bonded magnets are enhancing the efficiency and power density of devices that rely on magnetic materials, such as electric motors and wind turbines. The integration of magnetic materials in emerging technologies, including wireless charging systems and magnetic resonance imaging (MRI) machines, is also driving research and development in the field.
How Do Market Segments Define the Growth of Magnetic Materials?
Types of magnetic materials include soft magnetic materials, hard magnetic materials, and semi-hard magnetic materials, with hard magnetic materials (such as neodymium magnets) dominating the market due to their use in permanent magnets for motors and generators. Applications range from energy generation and storage to consumer electronics and medical devices, with energy generation being a major growth segment due to the increasing adoption of wind turbines and electric vehicles. End-use industries include automotive, electronics, energy, healthcare, and industrial manufacturing, with the automotive sector leading the market as electric vehicle production rises.
What Factors Are Driving the Growth in the Magnetic Materials Market?
The growth in the magnetic materials market is driven by several factors, including the rising demand for electric vehicles, the expansion of renewable energy infrastructure, and the growing use of advanced electronics. As the shift toward clean energy and electric mobility accelerates, the need for high-performance magnetic materials in electric motors, generators, and energy storage systems is increasing. Additionally, the proliferation of consumer electronics and medical devices that rely on magnetic materials for data storage, imaging, and sensing is contributing to market growth. The continued development of rare-earth-free magnets and other sustainable solutions is also expected to play a key role in driving future growth in this market.
SCOPE OF STUDY:
The report analyzes the Magnetic Materials market in terms of units by the following Segments, and Geographic Regions/Countries:
Segments:
Type (Semi-Hard Magnet, Soft Magnet, Permanent / Hard Magnet); Application (Automotive, Electronics, Industrial, Power Generation, Other Applications)
Geographic Regions/Countries:
World; United States; Canada; Japan; China; Europe (France; Germany; Italy; United Kingdom; Spain; Russia; and Rest of Europe); Asia-Pacific (Australia; India; South Korea; and Rest of Asia-Pacific); Latin America (Argentina; Brazil; Mexico; and Rest of Latin America); Middle East (Iran; Israel; Saudi Arabia; United Arab Emirates; and Rest of Middle East); and Africa.
Select Competitors (Total 13 Featured) -
- Arnold Magnetic Technologies Corporation
- Daido Steel Co. Ltd.
- Dexter Magnetic Technologies
- Electron Energy Corporation
- Hitachi Metals Ltd.
- Lynas Corporation Ltd.
- Molycorp Inc.
- Shin-ETSU Chemical Co., Ltd.
- TDK Corporation
- Tengam Engineering Inc.
AI INTEGRATIONS
We're transforming market and competitive intelligence with validated expert content and AI tools.
Instead of following the general norm of querying LLMs and Industry-specific SLMs, we built repositories of content curated from domain experts worldwide including video transcripts, blogs, search engines research, and massive amounts of enterprise, product/service, and market data.
TARIFF IMPACT FACTOR
Our new release incorporates impact of tariffs on geographical markets as we predict a shift in competitiveness of companies based on HQ country, manufacturing base, exports and imports (finished goods and OEM). This intricate and multifaceted market reality will impact competitors by increasing the Cost of Goods Sold (COGS), reducing profitability, reconfiguring supply chains, amongst other micro and macro market dynamics.
TABLE OF CONTENTS
I. METHODOLOGY
II. EXECUTIVE SUMMARY
- 1. MARKET OVERVIEW
- Influencer Market Insights
- Tariff Impact on Global Supply Chain Patterns
- Global Economic Update
- Magnetic Materials - Global Key Competitors Percentage Market Share in 2025 (E)
- Competitive Market Presence - Strong/Active/Niche/Trivial for Players Worldwide in 2025 (E)
- 2. FOCUS ON SELECT PLAYERS
- 3. MARKET TRENDS & DRIVERS
- Rising Demand for Energy-Efficient Motors and Generators Drives Growth in Magnetic Materials Market
- Technological Advancements in Permanent Magnet Materials Strengthen Business Case for Adoption
- Growing Use of Magnetic Materials in Electric Vehicles and Hybrid Vehicles Expands Addressable Market
- Expansion of Magnetic Materials in Wind Power Generation and Renewable Energy Applications Fuels Market Growth
- Increasing Use of Magnetic Materials in Consumer Electronics and Wireless Communication Expands Market Opportunities
- Technological Innovations in Soft Magnetic Materials and Magnet Alloys Propel Market Growth
- Rising Adoption of Magnetic Materials in Industrial Automation and Robotics Expands Market Potential
- Growing Focus on Enhancing Magnetic Strength and Reducing Energy Loss Drives Demand for Advanced Magnetic Materials
- Expansion of Magnetic Materials in Healthcare and Diagnostic Imaging, Including MRI, Fuels Market Growth
- Technological Advancements in High-Temperature and High-Performance Magnetic Materials Propel Market Expansion
- Rising Demand for Rare Earth Magnets in Aerospace and Defense Applications Expands Market Opportunities
- Increasing Use of Magnetic Materials in Smart Grids and Energy Storage Systems Expands Market Potential
- 4. GLOBAL MARKET PERSPECTIVE
- TABLE 1: World Recent Past, Current & Future Analysis for Magnetic Materials by Geographic Region - USA, Canada, Japan, China, Europe, Asia-Pacific, Latin America, Middle East and Africa Markets - Independent Analysis of Annual Sales in US$ Million for Years 2024 through 2030 and % CAGR
- TABLE 2: World Historic Review for Magnetic Materials by Geographic Region - USA, Canada, Japan, China, Europe, Asia-Pacific, Latin America, Middle East and Africa Markets - Independent Analysis of Annual Sales in US$ Million for Years 2015 through 2023 and % CAGR
- TABLE 3: World 15-Year Perspective for Magnetic Materials by Geographic Region - Percentage Breakdown of Value Sales for USA, Canada, Japan, China, Europe, Asia-Pacific, Latin America, Middle East and Africa Markets for Years 2015, 2025 & 2030
- TABLE 4: World Recent Past, Current & Future Analysis for Semi-Hard Magnet by Geographic Region - USA, Canada, Japan, China, Europe, Asia-Pacific, Latin America, Middle East and Africa Markets - Independent Analysis of Annual Sales in US$ Million for Years 2024 through 2030 and % CAGR
- TABLE 5: World Historic Review for Semi-Hard Magnet by Geographic Region - USA, Canada, Japan, China, Europe, Asia-Pacific, Latin America, Middle East and Africa Markets - Independent Analysis of Annual Sales in US$ Million for Years 2015 through 2023 and % CAGR
- TABLE 6: World 15-Year Perspective for Semi-Hard Magnet by Geographic Region - Percentage Breakdown of Value Sales for USA, Canada, Japan, China, Europe, Asia-Pacific, Latin America, Middle East and Africa for Years 2015, 2025 & 2030
- TABLE 7: World Recent Past, Current & Future Analysis for Soft Magnet by Geographic Region - USA, Canada, Japan, China, Europe, Asia-Pacific, Latin America, Middle East and Africa Markets - Independent Analysis of Annual Sales in US$ Million for Years 2024 through 2030 and % CAGR
- TABLE 8: World Historic Review for Soft Magnet by Geographic Region - USA, Canada, Japan, China, Europe, Asia-Pacific, Latin America, Middle East and Africa Markets - Independent Analysis of Annual Sales in US$ Million for Years 2015 through 2023 and % CAGR
- TABLE 9: World 15-Year Perspective for Soft Magnet by Geographic Region - Percentage Breakdown of Value Sales for USA, Canada, Japan, China, Europe, Asia-Pacific, Latin America, Middle East and Africa for Years 2015, 2025 & 2030
- TABLE 10: World Recent Past, Current & Future Analysis for Permanent / Hard Magnet by Geographic Region - USA, Canada, Japan, China, Europe, Asia-Pacific, Latin America, Middle East and Africa Markets - Independent Analysis of Annual Sales in US$ Million for Years 2024 through 2030 and % CAGR
- TABLE 11: World Historic Review for Permanent / Hard Magnet by Geographic Region - USA, Canada, Japan, China, Europe, Asia-Pacific, Latin America, Middle East and Africa Markets - Independent Analysis of Annual Sales in US$ Million for Years 2015 through 2023 and % CAGR
- TABLE 12: World 15-Year Perspective for Permanent / Hard Magnet by Geographic Region - Percentage Breakdown of Value Sales for USA, Canada, Japan, China, Europe, Asia-Pacific, Latin America, Middle East and Africa for Years 2015, 2025 & 2030
- TABLE 13: World Recent Past, Current & Future Analysis for Automotive by Geographic Region - USA, Canada, Japan, China, Europe, Asia-Pacific, Latin America, Middle East and Africa Markets - Independent Analysis of Annual Sales in US$ Million for Years 2024 through 2030 and % CAGR
- TABLE 14: World Historic Review for Automotive by Geographic Region - USA, Canada, Japan, China, Europe, Asia-Pacific, Latin America, Middle East and Africa Markets - Independent Analysis of Annual Sales in US$ Million for Years 2015 through 2023 and % CAGR
- TABLE 15: World 15-Year Perspective for Automotive by Geographic Region - Percentage Breakdown of Value Sales for USA, Canada, Japan, China, Europe, Asia-Pacific, Latin America, Middle East and Africa for Years 2015, 2025 & 2030
- TABLE 16: World Recent Past, Current & Future Analysis for Electronics by Geographic Region - USA, Canada, Japan, China, Europe, Asia-Pacific, Latin America, Middle East and Africa Markets - Independent Analysis of Annual Sales in US$ Million for Years 2024 through 2030 and % CAGR
- TABLE 17: World Historic Review for Electronics by Geographic Region - USA, Canada, Japan, China, Europe, Asia-Pacific, Latin America, Middle East and Africa Markets - Independent Analysis of Annual Sales in US$ Million for Years 2015 through 2023 and % CAGR
- TABLE 18: World 15-Year Perspective for Electronics by Geographic Region - Percentage Breakdown of Value Sales for USA, Canada, Japan, China, Europe, Asia-Pacific, Latin America, Middle East and Africa for Years 2015, 2025 & 2030
- TABLE 19: World Recent Past, Current & Future Analysis for Industrial by Geographic Region - USA, Canada, Japan, China, Europe, Asia-Pacific, Latin America, Middle East and Africa Markets - Independent Analysis of Annual Sales in US$ Million for Years 2024 through 2030 and % CAGR
- TABLE 20: World Historic Review for Industrial by Geographic Region - USA, Canada, Japan, China, Europe, Asia-Pacific, Latin America, Middle East and Africa Markets - Independent Analysis of Annual Sales in US$ Million for Years 2015 through 2023 and % CAGR
- TABLE 21: World 15-Year Perspective for Industrial by Geographic Region - Percentage Breakdown of Value Sales for USA, Canada, Japan, China, Europe, Asia-Pacific, Latin America, Middle East and Africa for Years 2015, 2025 & 2030
- TABLE 22: World Recent Past, Current & Future Analysis for Power Generation by Geographic Region - USA, Canada, Japan, China, Europe, Asia-Pacific, Latin America, Middle East and Africa Markets - Independent Analysis of Annual Sales in US$ Million for Years 2024 through 2030 and % CAGR
- TABLE 23: World Historic Review for Power Generation by Geographic Region - USA, Canada, Japan, China, Europe, Asia-Pacific, Latin America, Middle East and Africa Markets - Independent Analysis of Annual Sales in US$ Million for Years 2015 through 2023 and % CAGR
- TABLE 24: World 15-Year Perspective for Power Generation by Geographic Region - Percentage Breakdown of Value Sales for USA, Canada, Japan, China, Europe, Asia-Pacific, Latin America, Middle East and Africa for Years 2015, 2025 & 2030
- TABLE 25: World Recent Past, Current & Future Analysis for Other Applications by Geographic Region - USA, Canada, Japan, China, Europe, Asia-Pacific, Latin America, Middle East and Africa Markets - Independent Analysis of Annual Sales in US$ Million for Years 2024 through 2030 and % CAGR
- TABLE 26: World Historic Review for Other Applications by Geographic Region - USA, Canada, Japan, China, Europe, Asia-Pacific, Latin America, Middle East and Africa Markets - Independent Analysis of Annual Sales in US$ Million for Years 2015 through 2023 and % CAGR
- TABLE 27: World 15-Year Perspective for Other Applications by Geographic Region - Percentage Breakdown of Value Sales for USA, Canada, Japan, China, Europe, Asia-Pacific, Latin America, Middle East and Africa for Years 2015, 2025 & 2030
- TABLE 28: World Magnetic Materials Market Analysis of Annual Sales in US$ Million for Years 2015 through 2030
III. MARKET ANALYSIS
- UNITED STATES
- Magnetic Materials Market Presence - Strong/Active/Niche/Trivial - Key Competitors in the United States for 2025 (E)
- TABLE 29: USA Recent Past, Current & Future Analysis for Magnetic Materials by Type - Semi-Hard Magnet, Soft Magnet and Permanent / Hard Magnet - Independent Analysis of Annual Sales in US$ Million for the Years 2024 through 2030 and % CAGR
- TABLE 30: USA Historic Review for Magnetic Materials by Type - Semi-Hard Magnet, Soft Magnet and Permanent / Hard Magnet Markets - Independent Analysis of Annual Sales in US$ Million for Years 2015 through 2023 and % CAGR
- TABLE 31: USA 15-Year Perspective for Magnetic Materials by Type - Percentage Breakdown of Value Sales for Semi-Hard Magnet, Soft Magnet and Permanent / Hard Magnet for the Years 2015, 2025 & 2030
- TABLE 32: USA Recent Past, Current & Future Analysis for Magnetic Materials by Application - Automotive, Electronics, Industrial, Power Generation and Other Applications - Independent Analysis of Annual Sales in US$ Million for the Years 2024 through 2030 and % CAGR
- TABLE 33: USA Historic Review for Magnetic Materials by Application - Automotive, Electronics, Industrial, Power Generation and Other Applications Markets - Independent Analysis of Annual Sales in US$ Million for Years 2015 through 2023 and % CAGR
- TABLE 34: USA 15-Year Perspective for Magnetic Materials by Application - Percentage Breakdown of Value Sales for Automotive, Electronics, Industrial, Power Generation and Other Applications for the Years 2015, 2025 & 2030
- CANADA
- TABLE 35: Canada Recent Past, Current & Future Analysis for Magnetic Materials by Type - Semi-Hard Magnet, Soft Magnet and Permanent / Hard Magnet - Independent Analysis of Annual Sales in US$ Million for the Years 2024 through 2030 and % CAGR
- TABLE 36: Canada Historic Review for Magnetic Materials by Type - Semi-Hard Magnet, Soft Magnet and Permanent / Hard Magnet Markets - Independent Analysis of Annual Sales in US$ Million for Years 2015 through 2023 and % CAGR
- TABLE 37: Canada 15-Year Perspective for Magnetic Materials by Type - Percentage Breakdown of Value Sales for Semi-Hard Magnet, Soft Magnet and Permanent / Hard Magnet for the Years 2015, 2025 & 2030
- TABLE 38: Canada Recent Past, Current & Future Analysis for Magnetic Materials by Application - Automotive, Electronics, Industrial, Power Generation and Other Applications - Independent Analysis of Annual Sales in US$ Million for the Years 2024 through 2030 and % CAGR
- TABLE 39: Canada Historic Review for Magnetic Materials by Application - Automotive, Electronics, Industrial, Power Generation and Other Applications Markets - Independent Analysis of Annual Sales in US$ Million for Years 2015 through 2023 and % CAGR
- TABLE 40: Canada 15-Year Perspective for Magnetic Materials by Application - Percentage Breakdown of Value Sales for Automotive, Electronics, Industrial, Power Generation and Other Applications for the Years 2015, 2025 & 2030
- JAPAN
- Magnetic Materials Market Presence - Strong/Active/Niche/Trivial - Key Competitors in Japan for 2025 (E)
- TABLE 41: Japan Recent Past, Current & Future Analysis for Magnetic Materials by Type - Semi-Hard Magnet, Soft Magnet and Permanent / Hard Magnet - Independent Analysis of Annual Sales in US$ Million for the Years 2024 through 2030 and % CAGR
- TABLE 42: Japan Historic Review for Magnetic Materials by Type - Semi-Hard Magnet, Soft Magnet and Permanent / Hard Magnet Markets - Independent Analysis of Annual Sales in US$ Million for Years 2015 through 2023 and % CAGR
- TABLE 43: Japan 15-Year Perspective for Magnetic Materials by Type - Percentage Breakdown of Value Sales for Semi-Hard Magnet, Soft Magnet and Permanent / Hard Magnet for the Years 2015, 2025 & 2030
- TABLE 44: Japan Recent Past, Current & Future Analysis for Magnetic Materials by Application - Automotive, Electronics, Industrial, Power Generation and Other Applications - Independent Analysis of Annual Sales in US$ Million for the Years 2024 through 2030 and % CAGR
- TABLE 45: Japan Historic Review for Magnetic Materials by Application - Automotive, Electronics, Industrial, Power Generation and Other Applications Markets - Independent Analysis of Annual Sales in US$ Million for Years 2015 through 2023 and % CAGR
- TABLE 46: Japan 15-Year Perspective for Magnetic Materials by Application - Percentage Breakdown of Value Sales for Automotive, Electronics, Industrial, Power Generation and Other Applications for the Years 2015, 2025 & 2030
- CHINA
- Magnetic Materials Market Presence - Strong/Active/Niche/Trivial - Key Competitors in China for 2025 (E)
- TABLE 47: China Recent Past, Current & Future Analysis for Magnetic Materials by Type - Semi-Hard Magnet, Soft Magnet and Permanent / Hard Magnet - Independent Analysis of Annual Sales in US$ Million for the Years 2024 through 2030 and % CAGR
- TABLE 48: China Historic Review for Magnetic Materials by Type - Semi-Hard Magnet, Soft Magnet and Permanent / Hard Magnet Markets - Independent Analysis of Annual Sales in US$ Million for Years 2015 through 2023 and % CAGR
- TABLE 49: China 15-Year Perspective for Magnetic Materials by Type - Percentage Breakdown of Value Sales for Semi-Hard Magnet, Soft Magnet and Permanent / Hard Magnet for the Years 2015, 2025 & 2030
- TABLE 50: China Recent Past, Current & Future Analysis for Magnetic Materials by Application - Automotive, Electronics, Industrial, Power Generation and Other Applications - Independent Analysis of Annual Sales in US$ Million for the Years 2024 through 2030 and % CAGR
- TABLE 51: China Historic Review for Magnetic Materials by Application - Automotive, Electronics, Industrial, Power Generation and Other Applications Markets - Independent Analysis of Annual Sales in US$ Million for Years 2015 through 2023 and % CAGR
- TABLE 52: China 15-Year Perspective for Magnetic Materials by Application - Percentage Breakdown of Value Sales for Automotive, Electronics, Industrial, Power Generation and Other Applications for the Years 2015, 2025 & 2030
- EUROPE
- Magnetic Materials Market Presence - Strong/Active/Niche/Trivial - Key Competitors in Europe for 2025 (E)
- TABLE 53: Europe Recent Past, Current & Future Analysis for Magnetic Materials by Geographic Region - France, Germany, Italy, UK, Spain, Russia and Rest of Europe Markets - Independent Analysis of Annual Sales in US$ Million for Years 2024 through 2030 and % CAGR
- TABLE 54: Europe Historic Review for Magnetic Materials by Geographic Region - France, Germany, Italy, UK, Spain, Russia and Rest of Europe Markets - Independent Analysis of Annual Sales in US$ Million for Years 2015 through 2023 and % CAGR
- TABLE 55: Europe 15-Year Perspective for Magnetic Materials by Geographic Region - Percentage Breakdown of Value Sales for France, Germany, Italy, UK, Spain, Russia and Rest of Europe Markets for Years 2015, 2025 & 2030
- TABLE 56: Europe Recent Past, Current & Future Analysis for Magnetic Materials by Type - Semi-Hard Magnet, Soft Magnet and Permanent / Hard Magnet - Independent Analysis of Annual Sales in US$ Million for the Years 2024 through 2030 and % CAGR
- TABLE 57: Europe Historic Review for Magnetic Materials by Type - Semi-Hard Magnet, Soft Magnet and Permanent / Hard Magnet Markets - Independent Analysis of Annual Sales in US$ Million for Years 2015 through 2023 and % CAGR
- TABLE 58: Europe 15-Year Perspective for Magnetic Materials by Type - Percentage Breakdown of Value Sales for Semi-Hard Magnet, Soft Magnet and Permanent / Hard Magnet for the Years 2015, 2025 & 2030
- TABLE 59: Europe Recent Past, Current & Future Analysis for Magnetic Materials by Application - Automotive, Electronics, Industrial, Power Generation and Other Applications - Independent Analysis of Annual Sales in US$ Million for the Years 2024 through 2030 and % CAGR
- TABLE 60: Europe Historic Review for Magnetic Materials by Application - Automotive, Electronics, Industrial, Power Generation and Other Applications Markets - Independent Analysis of Annual Sales in US$ Million for Years 2015 through 2023 and % CAGR
- TABLE 61: Europe 15-Year Perspective for Magnetic Materials by Application - Percentage Breakdown of Value Sales for Automotive, Electronics, Industrial, Power Generation and Other Applications for the Years 2015, 2025 & 2030
- FRANCE
- Magnetic Materials Market Presence - Strong/Active/Niche/Trivial - Key Competitors in France for 2025 (E)
- TABLE 62: France Recent Past, Current & Future Analysis for Magnetic Materials by Type - Semi-Hard Magnet, Soft Magnet and Permanent / Hard Magnet - Independent Analysis of Annual Sales in US$ Million for the Years 2024 through 2030 and % CAGR
- TABLE 63: France Historic Review for Magnetic Materials by Type - Semi-Hard Magnet, Soft Magnet and Permanent / Hard Magnet Markets - Independent Analysis of Annual Sales in US$ Million for Years 2015 through 2023 and % CAGR
- TABLE 64: France 15-Year Perspective for Magnetic Materials by Type - Percentage Breakdown of Value Sales for Semi-Hard Magnet, Soft Magnet and Permanent / Hard Magnet for the Years 2015, 2025 & 2030
- TABLE 65: France Recent Past, Current & Future Analysis for Magnetic Materials by Application - Automotive, Electronics, Industrial, Power Generation and Other Applications - Independent Analysis of Annual Sales in US$ Million for the Years 2024 through 2030 and % CAGR
- TABLE 66: France Historic Review for Magnetic Materials by Application - Automotive, Electronics, Industrial, Power Generation and Other Applications Markets - Independent Analysis of Annual Sales in US$ Million for Years 2015 through 2023 and % CAGR
- TABLE 67: France 15-Year Perspective for Magnetic Materials by Application - Percentage Breakdown of Value Sales for Automotive, Electronics, Industrial, Power Generation and Other Applications for the Years 2015, 2025 & 2030
- GERMANY
- Magnetic Materials Market Presence - Strong/Active/Niche/Trivial - Key Competitors in Germany for 2025 (E)
- TABLE 68: Germany Recent Past, Current & Future Analysis for Magnetic Materials by Type - Semi-Hard Magnet, Soft Magnet and Permanent / Hard Magnet - Independent Analysis of Annual Sales in US$ Million for the Years 2024 through 2030 and % CAGR
- TABLE 69: Germany Historic Review for Magnetic Materials by Type - Semi-Hard Magnet, Soft Magnet and Permanent / Hard Magnet Markets - Independent Analysis of Annual Sales in US$ Million for Years 2015 through 2023 and % CAGR
- TABLE 70: Germany 15-Year Perspective for Magnetic Materials by Type - Percentage Breakdown of Value Sales for Semi-Hard Magnet, Soft Magnet and Permanent / Hard Magnet for the Years 2015, 2025 & 2030
- TABLE 71: Germany Recent Past, Current & Future Analysis for Magnetic Materials by Application - Automotive, Electronics, Industrial, Power Generation and Other Applications - Independent Analysis of Annual Sales in US$ Million for the Years 2024 through 2030 and % CAGR
- TABLE 72: Germany Historic Review for Magnetic Materials by Application - Automotive, Electronics, Industrial, Power Generation and Other Applications Markets - Independent Analysis of Annual Sales in US$ Million for Years 2015 through 2023 and % CAGR
- TABLE 73: Germany 15-Year Perspective for Magnetic Materials by Application - Percentage Breakdown of Value Sales for Automotive, Electronics, Industrial, Power Generation and Other Applications for the Years 2015, 2025 & 2030
- ITALY
- TABLE 74: Italy Recent Past, Current & Future Analysis for Magnetic Materials by Type - Semi-Hard Magnet, Soft Magnet and Permanent / Hard Magnet - Independent Analysis of Annual Sales in US$ Million for the Years 2024 through 2030 and % CAGR
- TABLE 75: Italy Historic Review for Magnetic Materials by Type - Semi-Hard Magnet, Soft Magnet and Permanent / Hard Magnet Markets - Independent Analysis of Annual Sales in US$ Million for Years 2015 through 2023 and % CAGR
- TABLE 76: Italy 15-Year Perspective for Magnetic Materials by Type - Percentage Breakdown of Value Sales for Semi-Hard Magnet, Soft Magnet and Permanent / Hard Magnet for the Years 2015, 2025 & 2030
- TABLE 77: Italy Recent Past, Current & Future Analysis for Magnetic Materials by Application - Automotive, Electronics, Industrial, Power Generation and Other Applications - Independent Analysis of Annual Sales in US$ Million for the Years 2024 through 2030 and % CAGR
- TABLE 78: Italy Historic Review for Magnetic Materials by Application - Automotive, Electronics, Industrial, Power Generation and Other Applications Markets - Independent Analysis of Annual Sales in US$ Million for Years 2015 through 2023 and % CAGR
- TABLE 79: Italy 15-Year Perspective for Magnetic Materials by Application - Percentage Breakdown of Value Sales for Automotive, Electronics, Industrial, Power Generation and Other Applications for the Years 2015, 2025 & 2030
- UNITED KINGDOM
- Magnetic Materials Market Presence - Strong/Active/Niche/Trivial - Key Competitors in the United Kingdom for 2025 (E)
- TABLE 80: UK Recent Past, Current & Future Analysis for Magnetic Materials by Type - Semi-Hard Magnet, Soft Magnet and Permanent / Hard Magnet - Independent Analysis of Annual Sales in US$ Million for the Years 2024 through 2030 and % CAGR
- TABLE 81: UK Historic Review for Magnetic Materials by Type - Semi-Hard Magnet, Soft Magnet and Permanent / Hard Magnet Markets - Independent Analysis of Annual Sales in US$ Million for Years 2015 through 2023 and % CAGR
- TABLE 82: UK 15-Year Perspective for Magnetic Materials by Type - Percentage Breakdown of Value Sales for Semi-Hard Magnet, Soft Magnet and Permanent / Hard Magnet for the Years 2015, 2025 & 2030
- TABLE 83: UK Recent Past, Current & Future Analysis for Magnetic Materials by Application - Automotive, Electronics, Industrial, Power Generation and Other Applications - Independent Analysis of Annual Sales in US$ Million for the Years 2024 through 2030 and % CAGR
- TABLE 84: UK Historic Review for Magnetic Materials by Application - Automotive, Electronics, Industrial, Power Generation and Other Applications Markets - Independent Analysis of Annual Sales in US$ Million for Years 2015 through 2023 and % CAGR
- TABLE 85: UK 15-Year Perspective for Magnetic Materials by Application - Percentage Breakdown of Value Sales for Automotive, Electronics, Industrial, Power Generation and Other Applications for the Years 2015, 2025 & 2030
- SPAIN
- TABLE 86: Spain Recent Past, Current & Future Analysis for Magnetic Materials by Type - Semi-Hard Magnet, Soft Magnet and Permanent / Hard Magnet - Independent Analysis of Annual Sales in US$ Million for the Years 2024 through 2030 and % CAGR
- TABLE 87: Spain Historic Review for Magnetic Materials by Type - Semi-Hard Magnet, Soft Magnet and Permanent / Hard Magnet Markets - Independent Analysis of Annual Sales in US$ Million for Years 2015 through 2023 and % CAGR
- TABLE 88: Spain 15-Year Perspective for Magnetic Materials by Type - Percentage Breakdown of Value Sales for Semi-Hard Magnet, Soft Magnet and Permanent / Hard Magnet for the Years 2015, 2025 & 2030
- TABLE 89: Spain Recent Past, Current & Future Analysis for Magnetic Materials by Application - Automotive, Electronics, Industrial, Power Generation and Other Applications - Independent Analysis of Annual Sales in US$ Million for the Years 2024 through 2030 and % CAGR
- TABLE 90: Spain Historic Review for Magnetic Materials by Application - Automotive, Electronics, Industrial, Power Generation and Other Applications Markets - Independent Analysis of Annual Sales in US$ Million for Years 2015 through 2023 and % CAGR
- TABLE 91: Spain 15-Year Perspective for Magnetic Materials by Application - Percentage Breakdown of Value Sales for Automotive, Electronics, Industrial, Power Generation and Other Applications for the Years 2015, 2025 & 2030
- RUSSIA
- TABLE 92: Russia Recent Past, Current & Future Analysis for Magnetic Materials by Type - Semi-Hard Magnet, Soft Magnet and Permanent / Hard Magnet - Independent Analysis of Annual Sales in US$ Million for the Years 2024 through 2030 and % CAGR
- TABLE 93: Russia Historic Review for Magnetic Materials by Type - Semi-Hard Magnet, Soft Magnet and Permanent / Hard Magnet Markets - Independent Analysis of Annual Sales in US$ Million for Years 2015 through 2023 and % CAGR
- TABLE 94: Russia 15-Year Perspective for Magnetic Materials by Type - Percentage Breakdown of Value Sales for Semi-Hard Magnet, Soft Magnet and Permanent / Hard Magnet for the Years 2015, 2025 & 2030
- TABLE 95: Russia Recent Past, Current & Future Analysis for Magnetic Materials by Application - Automotive, Electronics, Industrial, Power Generation and Other Applications - Independent Analysis of Annual Sales in US$ Million for the Years 2024 through 2030 and % CAGR
- TABLE 96: Russia Historic Review for Magnetic Materials by Application - Automotive, Electronics, Industrial, Power Generation and Other Applications Markets - Independent Analysis of Annual Sales in US$ Million for Years 2015 through 2023 and % CAGR
- TABLE 97: Russia 15-Year Perspective for Magnetic Materials by Application - Percentage Breakdown of Value Sales for Automotive, Electronics, Industrial, Power Generation and Other Applications for the Years 2015, 2025 & 2030
- REST OF EUROPE
- TABLE 98: Rest of Europe Recent Past, Current & Future Analysis for Magnetic Materials by Type - Semi-Hard Magnet, Soft Magnet and Permanent / Hard Magnet - Independent Analysis of Annual Sales in US$ Million for the Years 2024 through 2030 and % CAGR
- TABLE 99: Rest of Europe Historic Review for Magnetic Materials by Type - Semi-Hard Magnet, Soft Magnet and Permanent / Hard Magnet Markets - Independent Analysis of Annual Sales in US$ Million for Years 2015 through 2023 and % CAGR
- TABLE 100: Rest of Europe 15-Year Perspective for Magnetic Materials by Type - Percentage Breakdown of Value Sales for Semi-Hard Magnet, Soft Magnet and Permanent / Hard Magnet for the Years 2015, 2025 & 2030
- TABLE 101: Rest of Europe Recent Past, Current & Future Analysis for Magnetic Materials by Application - Automotive, Electronics, Industrial, Power Generation and Other Applications - Independent Analysis of Annual Sales in US$ Million for the Years 2024 through 2030 and % CAGR
- TABLE 102: Rest of Europe Historic Review for Magnetic Materials by Application - Automotive, Electronics, Industrial, Power Generation and Other Applications Markets - Independent Analysis of Annual Sales in US$ Million for Years 2015 through 2023 and % CAGR
- TABLE 103: Rest of Europe 15-Year Perspective for Magnetic Materials by Application - Percentage Breakdown of Value Sales for Automotive, Electronics, Industrial, Power Generation and Other Applications for the Years 2015, 2025 & 2030
- ASIA-PACIFIC
- Magnetic Materials Market Presence - Strong/Active/Niche/Trivial - Key Competitors in Asia-Pacific for 2025 (E)
- TABLE 104: Asia-Pacific Recent Past, Current & Future Analysis for Magnetic Materials by Geographic Region - Australia, India, South Korea and Rest of Asia-Pacific Markets - Independent Analysis of Annual Sales in US$ Million for Years 2024 through 2030 and % CAGR
- TABLE 105: Asia-Pacific Historic Review for Magnetic Materials by Geographic Region - Australia, India, South Korea and Rest of Asia-Pacific Markets - Independent Analysis of Annual Sales in US$ Million for Years 2015 through 2023 and % CAGR
- TABLE 106: Asia-Pacific 15-Year Perspective for Magnetic Materials by Geographic Region - Percentage Breakdown of Value Sales for Australia, India, South Korea and Rest of Asia-Pacific Markets for Years 2015, 2025 & 2030
- TABLE 107: Asia-Pacific Recent Past, Current & Future Analysis for Magnetic Materials by Type - Semi-Hard Magnet, Soft Magnet and Permanent / Hard Magnet - Independent Analysis of Annual Sales in US$ Million for the Years 2024 through 2030 and % CAGR
- TABLE 108: Asia-Pacific Historic Review for Magnetic Materials by Type - Semi-Hard Magnet, Soft Magnet and Permanent / Hard Magnet Markets - Independent Analysis of Annual Sales in US$ Million for Years 2015 through 2023 and % CAGR
- TABLE 109: Asia-Pacific 15-Year Perspective for Magnetic Materials by Type - Percentage Breakdown of Value Sales for Semi-Hard Magnet, Soft Magnet and Permanent / Hard Magnet for the Years 2015, 2025 & 2030
- TABLE 110: Asia-Pacific Recent Past, Current & Future Analysis for Magnetic Materials by Application - Automotive, Electronics, Industrial, Power Generation and Other Applications - Independent Analysis of Annual Sales in US$ Million for the Years 2024 through 2030 and % CAGR
- TABLE 111: Asia-Pacific Historic Review for Magnetic Materials by Application - Automotive, Electronics, Industrial, Power Generation and Other Applications Markets - Independent Analysis of Annual Sales in US$ Million for Years 2015 through 2023 and % CAGR
- TABLE 112: Asia-Pacific 15-Year Perspective for Magnetic Materials by Application - Percentage Breakdown of Value Sales for Automotive, Electronics, Industrial, Power Generation and Other Applications for the Years 2015, 2025 & 2030
- AUSTRALIA
- Magnetic Materials Market Presence - Strong/Active/Niche/Trivial - Key Competitors in Australia for 2025 (E)
- TABLE 113: Australia Recent Past, Current & Future Analysis for Magnetic Materials by Type - Semi-Hard Magnet, Soft Magnet and Permanent / Hard Magnet - Independent Analysis of Annual Sales in US$ Million for the Years 2024 through 2030 and % CAGR
- TABLE 114: Australia Historic Review for Magnetic Materials by Type - Semi-Hard Magnet, Soft Magnet and Permanent / Hard Magnet Markets - Independent Analysis of Annual Sales in US$ Million for Years 2015 through 2023 and % CAGR
- TABLE 115: Australia 15-Year Perspective for Magnetic Materials by Type - Percentage Breakdown of Value Sales for Semi-Hard Magnet, Soft Magnet and Permanent / Hard Magnet for the Years 2015, 2025 & 2030
- TABLE 116: Australia Recent Past, Current & Future Analysis for Magnetic Materials by Application - Automotive, Electronics, Industrial, Power Generation and Other Applications - Independent Analysis of Annual Sales in US$ Million for the Years 2024 through 2030 and % CAGR
- TABLE 117: Australia Historic Review for Magnetic Materials by Application - Automotive, Electronics, Industrial, Power Generation and Other Applications Markets - Independent Analysis of Annual Sales in US$ Million for Years 2015 through 2023 and % CAGR
- TABLE 118: Australia 15-Year Perspective for Magnetic Materials by Application - Percentage Breakdown of Value Sales for Automotive, Electronics, Industrial, Power Generation and Other Applications for the Years 2015, 2025 & 2030
- INDIA
- Magnetic Materials Market Presence - Strong/Active/Niche/Trivial - Key Competitors in India for 2025 (E)
- TABLE 119: India Recent Past, Current & Future Analysis for Magnetic Materials by Type - Semi-Hard Magnet, Soft Magnet and Permanent / Hard Magnet - Independent Analysis of Annual Sales in US$ Million for the Years 2024 through 2030 and % CAGR
- TABLE 120: India Historic Review for Magnetic Materials by Type - Semi-Hard Magnet, Soft Magnet and Permanent / Hard Magnet Markets - Independent Analysis of Annual Sales in US$ Million for Years 2015 through 2023 and % CAGR
- TABLE 121: India 15-Year Perspective for Magnetic Materials by Type - Percentage Breakdown of Value Sales for Semi-Hard Magnet, Soft Magnet and Permanent / Hard Magnet for the Years 2015, 2025 & 2030
- TABLE 122: India Recent Past, Current & Future Analysis for Magnetic Materials by Application - Automotive, Electronics, Industrial, Power Generation and Other Applications - Independent Analysis of Annual Sales in US$ Million for the Years 2024 through 2030 and % CAGR
- TABLE 123: India Historic Review for Magnetic Materials by Application - Automotive, Electronics, Industrial, Power Generation and Other Applications Markets - Independent Analysis of Annual Sales in US$ Million for Years 2015 through 2023 and % CAGR
- TABLE 124: India 15-Year Perspective for Magnetic Materials by Application - Percentage Breakdown of Value Sales for Automotive, Electronics, Industrial, Power Generation and Other Applications for the Years 2015, 2025 & 2030
- SOUTH KOREA
- TABLE 125: South Korea Recent Past, Current & Future Analysis for Magnetic Materials by Type - Semi-Hard Magnet, Soft Magnet and Permanent / Hard Magnet - Independent Analysis of Annual Sales in US$ Million for the Years 2024 through 2030 and % CAGR
- TABLE 126: South Korea Historic Review for Magnetic Materials by Type - Semi-Hard Magnet, Soft Magnet and Permanent / Hard Magnet Markets - Independent Analysis of Annual Sales in US$ Million for Years 2015 through 2023 and % CAGR
- TABLE 127: South Korea 15-Year Perspective for Magnetic Materials by Type - Percentage Breakdown of Value Sales for Semi-Hard Magnet, Soft Magnet and Permanent / Hard Magnet for the Years 2015, 2025 & 2030
- TABLE 128: South Korea Recent Past, Current & Future Analysis for Magnetic Materials by Application - Automotive, Electronics, Industrial, Power Generation and Other Applications - Independent Analysis of Annual Sales in US$ Million for the Years 2024 through 2030 and % CAGR
- TABLE 129: South Korea Historic Review for Magnetic Materials by Application - Automotive, Electronics, Industrial, Power Generation and Other Applications Markets - Independent Analysis of Annual Sales in US$ Million for Years 2015 through 2023 and % CAGR
- TABLE 130: South Korea 15-Year Perspective for Magnetic Materials by Application - Percentage Breakdown of Value Sales for Automotive, Electronics, Industrial, Power Generation and Other Applications for the Years 2015, 2025 & 2030
- REST OF ASIA-PACIFIC
- TABLE 131: Rest of Asia-Pacific Recent Past, Current & Future Analysis for Magnetic Materials by Type - Semi-Hard Magnet, Soft Magnet and Permanent / Hard Magnet - Independent Analysis of Annual Sales in US$ Million for the Years 2024 through 2030 and % CAGR
- TABLE 132: Rest of Asia-Pacific Historic Review for Magnetic Materials by Type - Semi-Hard Magnet, Soft Magnet and Permanent / Hard Magnet Markets - Independent Analysis of Annual Sales in US$ Million for Years 2015 through 2023 and % CAGR
- TABLE 133: Rest of Asia-Pacific 15-Year Perspective for Magnetic Materials by Type - Percentage Breakdown of Value Sales for Semi-Hard Magnet, Soft Magnet and Permanent / Hard Magnet for the Years 2015, 2025 & 2030
- TABLE 134: Rest of Asia-Pacific Recent Past, Current & Future Analysis for Magnetic Materials by Application - Automotive, Electronics, Industrial, Power Generation and Other Applications - Independent Analysis of Annual Sales in US$ Million for the Years 2024 through 2030 and % CAGR
- TABLE 135: Rest of Asia-Pacific Historic Review for Magnetic Materials by Application - Automotive, Electronics, Industrial, Power Generation and Other Applications Markets - Independent Analysis of Annual Sales in US$ Million for Years 2015 through 2023 and % CAGR
- TABLE 136: Rest of Asia-Pacific 15-Year Perspective for Magnetic Materials by Application - Percentage Breakdown of Value Sales for Automotive, Electronics, Industrial, Power Generation and Other Applications for the Years 2015, 2025 & 2030
- LATIN AMERICA
- Magnetic Materials Market Presence - Strong/Active/Niche/Trivial - Key Competitors in Latin America for 2025 (E)
- TABLE 137: Latin America Recent Past, Current & Future Analysis for Magnetic Materials by Geographic Region - Argentina, Brazil, Mexico and Rest of Latin America Markets - Independent Analysis of Annual Sales in US$ Million for Years 2024 through 2030 and % CAGR
- TABLE 138: Latin America Historic Review for Magnetic Materials by Geographic Region - Argentina, Brazil, Mexico and Rest of Latin America Markets - Independent Analysis of Annual Sales in US$ Million for Years 2015 through 2023 and % CAGR
- TABLE 139: Latin America 15-Year Perspective for Magnetic Materials by Geographic Region - Percentage Breakdown of Value Sales for Argentina, Brazil, Mexico and Rest of Latin America Markets for Years 2015, 2025 & 2030
- TABLE 140: Latin America Recent Past, Current & Future Analysis for Magnetic Materials by Type - Semi-Hard Magnet, Soft Magnet and Permanent / Hard Magnet - Independent Analysis of Annual Sales in US$ Million for the Years 2024 through 2030 and % CAGR
- TABLE 141: Latin America Historic Review for Magnetic Materials by Type - Semi-Hard Magnet, Soft Magnet and Permanent / Hard Magnet Markets - Independent Analysis of Annual Sales in US$ Million for Years 2015 through 2023 and % CAGR
- TABLE 142: Latin America 15-Year Perspective for Magnetic Materials by Type - Percentage Breakdown of Value Sales for Semi-Hard Magnet, Soft Magnet and Permanent / Hard Magnet for the Years 2015, 2025 & 2030
- TABLE 143: Latin America Recent Past, Current & Future Analysis for Magnetic Materials by Application - Automotive, Electronics, Industrial, Power Generation and Other Applications - Independent Analysis of Annual Sales in US$ Million for the Years 2024 through 2030 and % CAGR
- TABLE 144: Latin America Historic Review for Magnetic Materials by Application - Automotive, Electronics, Industrial, Power Generation and Other Applications Markets - Independent Analysis of Annual Sales in US$ Million for Years 2015 through 2023 and % CAGR
- TABLE 145: Latin America 15-Year Perspective for Magnetic Materials by Application - Percentage Breakdown of Value Sales for Automotive, Electronics, Industrial, Power Generation and Other Applications for the Years 2015, 2025 & 2030
- ARGENTINA
- TABLE 146: Argentina Recent Past, Current & Future Analysis for Magnetic Materials by Type - Semi-Hard Magnet, Soft Magnet and Permanent / Hard Magnet - Independent Analysis of Annual Sales in US$ Million for the Years 2024 through 2030 and % CAGR
- TABLE 147: Argentina Historic Review for Magnetic Materials by Type - Semi-Hard Magnet, Soft Magnet and Permanent / Hard Magnet Markets - Independent Analysis of Annual Sales in US$ Million for Years 2015 through 2023 and % CAGR
- TABLE 148: Argentina 15-Year Perspective for Magnetic Materials by Type - Percentage Breakdown of Value Sales for Semi-Hard Magnet, Soft Magnet and Permanent / Hard Magnet for the Years 2015, 2025 & 2030
- TABLE 149: Argentina Recent Past, Current & Future Analysis for Magnetic Materials by Application - Automotive, Electronics, Industrial, Power Generation and Other Applications - Independent Analysis of Annual Sales in US$ Million for the Years 2024 through 2030 and % CAGR
- TABLE 150: Argentina Historic Review for Magnetic Materials by Application - Automotive, Electronics, Industrial, Power Generation and Other Applications Markets - Independent Analysis of Annual Sales in US$ Million for Years 2015 through 2023 and % CAGR
- TABLE 151: Argentina 15-Year Perspective for Magnetic Materials by Application - Percentage Breakdown of Value Sales for Automotive, Electronics, Industrial, Power Generation and Other Applications for the Years 2015, 2025 & 2030
- BRAZIL
- TABLE 152: Brazil Recent Past, Current & Future Analysis for Magnetic Materials by Type - Semi-Hard Magnet, Soft Magnet and Permanent / Hard Magnet - Independent Analysis of Annual Sales in US$ Million for the Years 2024 through 2030 and % CAGR
- TABLE 153: Brazil Historic Review for Magnetic Materials by Type - Semi-Hard Magnet, Soft Magnet and Permanent / Hard Magnet Markets - Independent Analysis of Annual Sales in US$ Million for Years 2015 through 2023 and % CAGR
- TABLE 154: Brazil 15-Year Perspective for Magnetic Materials by Type - Percentage Breakdown of Value Sales for Semi-Hard Magnet, Soft Magnet and Permanent / Hard Magnet for the Years 2015, 2025 & 2030
- TABLE 155: Brazil Recent Past, Current & Future Analysis for Magnetic Materials by Application - Automotive, Electronics, Industrial, Power Generation and Other Applications - Independent Analysis of Annual Sales in US$ Million for the Years 2024 through 2030 and % CAGR
- TABLE 156: Brazil Historic Review for Magnetic Materials by Application - Automotive, Electronics, Industrial, Power Generation and Other Applications Markets - Independent Analysis of Annual Sales in US$ Million for Years 2015 through 2023 and % CAGR
- TABLE 157: Brazil 15-Year Perspective for Magnetic Materials by Application - Percentage Breakdown of Value Sales for Automotive, Electronics, Industrial, Power Generation and Other Applications for the Years 2015, 2025 & 2030
- MEXICO
- TABLE 158: Mexico Recent Past, Current & Future Analysis for Magnetic Materials by Type - Semi-Hard Magnet, Soft Magnet and Permanent / Hard Magnet - Independent Analysis of Annual Sales in US$ Million for the Years 2024 through 2030 and % CAGR
- TABLE 159: Mexico Historic Review for Magnetic Materials by Type - Semi-Hard Magnet, Soft Magnet and Permanent / Hard Magnet Markets - Independent Analysis of Annual Sales in US$ Million for Years 2015 through 2023 and % CAGR
- TABLE 160: Mexico 15-Year Perspective for Magnetic Materials by Type - Percentage Breakdown of Value Sales for Semi-Hard Magnet, Soft Magnet and Permanent / Hard Magnet for the Years 2015, 2025 & 2030
- TABLE 161: Mexico Recent Past, Current & Future Analysis for Magnetic Materials by Application - Automotive, Electronics, Industrial, Power Generation and Other Applications - Independent Analysis of Annual Sales in US$ Million for the Years 2024 through 2030 and % CAGR
- TABLE 162: Mexico Historic Review for Magnetic Materials by Application - Automotive, Electronics, Industrial, Power Generation and Other Applications Markets - Independent Analysis of Annual Sales in US$ Million for Years 2015 through 2023 and % CAGR
- TABLE 163: Mexico 15-Year Perspective for Magnetic Materials by Application - Percentage Breakdown of Value Sales for Automotive, Electronics, Industrial, Power Generation and Other Applications for the Years 2015, 2025 & 2030
- REST OF LATIN AMERICA
- TABLE 164: Rest of Latin America Recent Past, Current & Future Analysis for Magnetic Materials by Type - Semi-Hard Magnet, Soft Magnet and Permanent / Hard Magnet - Independent Analysis of Annual Sales in US$ Million for the Years 2024 through 2030 and % CAGR
- TABLE 165: Rest of Latin America Historic Review for Magnetic Materials by Type - Semi-Hard Magnet, Soft Magnet and Permanent / Hard Magnet Markets - Independent Analysis of Annual Sales in US$ Million for Years 2015 through 2023 and % CAGR
- TABLE 166: Rest of Latin America 15-Year Perspective for Magnetic Materials by Type - Percentage Breakdown of Value Sales for Semi-Hard Magnet, Soft Magnet and Permanent / Hard Magnet for the Years 2015, 2025 & 2030
- TABLE 167: Rest of Latin America Recent Past, Current & Future Analysis for Magnetic Materials by Application - Automotive, Electronics, Industrial, Power Generation and Other Applications - Independent Analysis of Annual Sales in US$ Million for the Years 2024 through 2030 and % CAGR
- TABLE 168: Rest of Latin America Historic Review for Magnetic Materials by Application - Automotive, Electronics, Industrial, Power Generation and Other Applications Markets - Independent Analysis of Annual Sales in US$ Million for Years 2015 through 2023 and % CAGR
- TABLE 169: Rest of Latin America 15-Year Perspective for Magnetic Materials by Application - Percentage Breakdown of Value Sales for Automotive, Electronics, Industrial, Power Generation and Other Applications for the Years 2015, 2025 & 2030
- MIDDLE EAST
- Magnetic Materials Market Presence - Strong/Active/Niche/Trivial - Key Competitors in Middle East for 2025 (E)
- TABLE 170: Middle East Recent Past, Current & Future Analysis for Magnetic Materials by Geographic Region - Iran, Israel, Saudi Arabia, UAE and Rest of Middle East Markets - Independent Analysis of Annual Sales in US$ Million for Years 2024 through 2030 and % CAGR
- TABLE 171: Middle East Historic Review for Magnetic Materials by Geographic Region - Iran, Israel, Saudi Arabia, UAE and Rest of Middle East Markets - Independent Analysis of Annual Sales in US$ Million for Years 2015 through 2023 and % CAGR
- TABLE 172: Middle East 15-Year Perspective for Magnetic Materials by Geographic Region - Percentage Breakdown of Value Sales for Iran, Israel, Saudi Arabia, UAE and Rest of Middle East Markets for Years 2015, 2025 & 2030
- TABLE 173: Middle East Recent Past, Current & Future Analysis for Magnetic Materials by Type - Semi-Hard Magnet, Soft Magnet and Permanent / Hard Magnet - Independent Analysis of Annual Sales in US$ Million for the Years 2024 through 2030 and % CAGR
- TABLE 174: Middle East Historic Review for Magnetic Materials by Type - Semi-Hard Magnet, Soft Magnet and Permanent / Hard Magnet Markets - Independent Analysis of Annual Sales in US$ Million for Years 2015 through 2023 and % CAGR
- TABLE 175: Middle East 15-Year Perspective for Magnetic Materials by Type - Percentage Breakdown of Value Sales for Semi-Hard Magnet, Soft Magnet and Permanent / Hard Magnet for the Years 2015, 2025 & 2030
- TABLE 176: Middle East Recent Past, Current & Future Analysis for Magnetic Materials by Application - Automotive, Electronics, Industrial, Power Generation and Other Applications - Independent Analysis of Annual Sales in US$ Million for the Years 2024 through 2030 and % CAGR
- TABLE 177: Middle East Historic Review for Magnetic Materials by Application - Automotive, Electronics, Industrial, Power Generation and Other Applications Markets - Independent Analysis of Annual Sales in US$ Million for Years 2015 through 2023 and % CAGR
- TABLE 178: Middle East 15-Year Perspective for Magnetic Materials by Application - Percentage Breakdown of Value Sales for Automotive, Electronics, Industrial, Power Generation and Other Applications for the Years 2015, 2025 & 2030
- IRAN
- TABLE 179: Iran Recent Past, Current & Future Analysis for Magnetic Materials by Type - Semi-Hard Magnet, Soft Magnet and Permanent / Hard Magnet - Independent Analysis of Annual Sales in US$ Million for the Years 2024 through 2030 and % CAGR
- TABLE 180: Iran Historic Review for Magnetic Materials by Type - Semi-Hard Magnet, Soft Magnet and Permanent / Hard Magnet Markets - Independent Analysis of Annual Sales in US$ Million for Years 2015 through 2023 and % CAGR
- TABLE 181: Iran 15-Year Perspective for Magnetic Materials by Type - Percentage Breakdown of Value Sales for Semi-Hard Magnet, Soft Magnet and Permanent / Hard Magnet for the Years 2015, 2025 & 2030
- TABLE 182: Iran Recent Past, Current & Future Analysis for Magnetic Materials by Application - Automotive, Electronics, Industrial, Power Generation and Other Applications - Independent Analysis of Annual Sales in US$ Million for the Years 2024 through 2030 and % CAGR
- TABLE 183: Iran Historic Review for Magnetic Materials by Application - Automotive, Electronics, Industrial, Power Generation and Other Applications Markets - Independent Analysis of Annual Sales in US$ Million for Years 2015 through 2023 and % CAGR
- TABLE 184: Iran 15-Year Perspective for Magnetic Materials by Application - Percentage Breakdown of Value Sales for Automotive, Electronics, Industrial, Power Generation and Other Applications for the Years 2015, 2025 & 2030
- ISRAEL
- TABLE 185: Israel Recent Past, Current & Future Analysis for Magnetic Materials by Type - Semi-Hard Magnet, Soft Magnet and Permanent / Hard Magnet - Independent Analysis of Annual Sales in US$ Million for the Years 2024 through 2030 and % CAGR
- TABLE 186: Israel Historic Review for Magnetic Materials by Type - Semi-Hard Magnet, Soft Magnet and Permanent / Hard Magnet Markets - Independent Analysis of Annual Sales in US$ Million for Years 2015 through 2023 and % CAGR
- TABLE 187: Israel 15-Year Perspective for Magnetic Materials by Type - Percentage Breakdown of Value Sales for Semi-Hard Magnet, Soft Magnet and Permanent / Hard Magnet for the Years 2015, 2025 & 2030
- TABLE 188: Israel Recent Past, Current & Future Analysis for Magnetic Materials by Application - Automotive, Electronics, Industrial, Power Generation and Other Applications - Independent Analysis of Annual Sales in US$ Million for the Years 2024 through 2030 and % CAGR
- TABLE 189: Israel Historic Review for Magnetic Materials by Application - Automotive, Electronics, Industrial, Power Generation and Other Applications Markets - Independent Analysis of Annual Sales in US$ Million for Years 2015 through 2023 and % CAGR
- TABLE 190: Israel 15-Year Perspective for Magnetic Materials by Application - Percentage Breakdown of Value Sales for Automotive, Electronics, Industrial, Power Generation and Other Applications for the Years 2015, 2025 & 2030
- SAUDI ARABIA
- TABLE 191: Saudi Arabia Recent Past, Current & Future Analysis for Magnetic Materials by Type - Semi-Hard Magnet, Soft Magnet and Permanent / Hard Magnet - Independent Analysis of Annual Sales in US$ Million for the Years 2024 through 2030 and % CAGR
- TABLE 192: Saudi Arabia Historic Review for Magnetic Materials by Type - Semi-Hard Magnet, Soft Magnet and Permanent / Hard Magnet Markets - Independent Analysis of Annual Sales in US$ Million for Years 2015 through 2023 and % CAGR
- TABLE 193: Saudi Arabia 15-Year Perspective for Magnetic Materials by Type - Percentage Breakdown of Value Sales for Semi-Hard Magnet, Soft Magnet and Permanent / Hard Magnet for the Years 2015, 2025 & 2030
- TABLE 194: Saudi Arabia Recent Past, Current & Future Analysis for Magnetic Materials by Application - Automotive, Electronics, Industrial, Power Generation and Other Applications - Independent Analysis of Annual Sales in US$ Million for the Years 2024 through 2030 and % CAGR
- TABLE 195: Saudi Arabia Historic Review for Magnetic Materials by Application - Automotive, Electronics, Industrial, Power Generation and Other Applications Markets - Independent Analysis of Annual Sales in US$ Million for Years 2015 through 2023 and % CAGR
- TABLE 196: Saudi Arabia 15-Year Perspective for Magnetic Materials by Application - Percentage Breakdown of Value Sales for Automotive, Electronics, Industrial, Power Generation and Other Applications for the Years 2015, 2025 & 2030
- UNITED ARAB EMIRATES
- TABLE 197: UAE Recent Past, Current & Future Analysis for Magnetic Materials by Type - Semi-Hard Magnet, Soft Magnet and Permanent / Hard Magnet - Independent Analysis of Annual Sales in US$ Million for the Years 2024 through 2030 and % CAGR
- TABLE 198: UAE Historic Review for Magnetic Materials by Type - Semi-Hard Magnet, Soft Magnet and Permanent / Hard Magnet Markets - Independent Analysis of Annual Sales in US$ Million for Years 2015 through 2023 and % CAGR
- TABLE 199: UAE 15-Year Perspective for Magnetic Materials by Type - Percentage Breakdown of Value Sales for Semi-Hard Magnet, Soft Magnet and Permanent / Hard Magnet for the Years 2015, 2025 & 2030
- TABLE 200: UAE Recent Past, Current & Future Analysis for Magnetic Materials by Application - Automotive, Electronics, Industrial, Power Generation and Other Applications - Independent Analysis of Annual Sales in US$ Million for the Years 2024 through 2030 and % CAGR
- TABLE 201: UAE Historic Review for Magnetic Materials by Application - Automotive, Electronics, Industrial, Power Generation and Other Applications Markets - Independent Analysis of Annual Sales in US$ Million for Years 2015 through 2023 and % CAGR
- TABLE 202: UAE 15-Year Perspective for Magnetic Materials by Application - Percentage Breakdown of Value Sales for Automotive, Electronics, Industrial, Power Generation and Other Applications for the Years 2015, 2025 & 2030
- REST OF MIDDLE EAST
- TABLE 203: Rest of Middle East Recent Past, Current & Future Analysis for Magnetic Materials by Type - Semi-Hard Magnet, Soft Magnet and Permanent / Hard Magnet - Independent Analysis of Annual Sales in US$ Million for the Years 2024 through 2030 and % CAGR
- TABLE 204: Rest of Middle East Historic Review for Magnetic Materials by Type - Semi-Hard Magnet, Soft Magnet and Permanent / Hard Magnet Markets - Independent Analysis of Annual Sales in US$ Million for Years 2015 through 2023 and % CAGR
- TABLE 205: Rest of Middle East 15-Year Perspective for Magnetic Materials by Type - Percentage Breakdown of Value Sales for Semi-Hard Magnet, Soft Magnet and Permanent / Hard Magnet for the Years 2015, 2025 & 2030
- TABLE 206: Rest of Middle East Recent Past, Current & Future Analysis for Magnetic Materials by Application - Automotive, Electronics, Industrial, Power Generation and Other Applications - Independent Analysis of Annual Sales in US$ Million for the Years 2024 through 2030 and % CAGR
- TABLE 207: Rest of Middle East Historic Review for Magnetic Materials by Application - Automotive, Electronics, Industrial, Power Generation and Other Applications Markets - Independent Analysis of Annual Sales in US$ Million for Years 2015 through 2023 and % CAGR
- TABLE 208: Rest of Middle East 15-Year Perspective for Magnetic Materials by Application - Percentage Breakdown of Value Sales for Automotive, Electronics, Industrial, Power Generation and Other Applications for the Years 2015, 2025 & 2030
- AFRICA
- Magnetic Materials Market Presence - Strong/Active/Niche/Trivial - Key Competitors in Africa for 2025 (E)
- TABLE 209: Africa Recent Past, Current & Future Analysis for Magnetic Materials by Type - Semi-Hard Magnet, Soft Magnet and Permanent / Hard Magnet - Independent Analysis of Annual Sales in US$ Million for the Years 2024 through 2030 and % CAGR
- TABLE 210: Africa Historic Review for Magnetic Materials by Type - Semi-Hard Magnet, Soft Magnet and Permanent / Hard Magnet Markets - Independent Analysis of Annual Sales in US$ Million for Years 2015 through 2023 and % CAGR
- TABLE 211: Africa 15-Year Perspective for Magnetic Materials by Type - Percentage Breakdown of Value Sales for Semi-Hard Magnet, Soft Magnet and Permanent / Hard Magnet for the Years 2015, 2025 & 2030
- TABLE 212: Africa Recent Past, Current & Future Analysis for Magnetic Materials by Application - Automotive, Electronics, Industrial, Power Generation and Other Applications - Independent Analysis of Annual Sales in US$ Million for the Years 2024 through 2030 and % CAGR
- TABLE 213: Africa Historic Review for Magnetic Materials by Application - Automotive, Electronics, Industrial, Power Generation and Other Applications Markets - Independent Analysis of Annual Sales in US$ Million for Years 2015 through 2023 and % CAGR
- TABLE 214: Africa 15-Year Perspective for Magnetic Materials by Application - Percentage Breakdown of Value Sales for Automotive, Electronics, Industrial, Power Generation and Other Applications for the Years 2015, 2025 & 2030
