|
|
市場調査レポート
商品コード
1262674
前臨床CRO市場- サービス別(バイオアナリシス&DMPK試験、トキシコロジー試験)、エンドユーザー別(バイオ医薬品企業、政府・学術機関、医療機器企業)、地域別&世界予測、2023年~2032年Preclinical CRO Market - By Service (Bioanalysis & DMPK Studies, Toxicology Testing), By End-use (Biopharmaceutical Companies, Government & Academic Institutes, Medical Device Companies), By Region & Global Forecast, 2023 - 2032 |
||||||
|
|
|||||||
|
● お客様のご希望に応じて、既存データの加工や未掲載情報(例:国別セグメント)の追加などの対応が可能です。 詳細はお問い合わせください。 |
|||||||


| 前臨床CRO市場- サービス別(バイオアナリシス&DMPK試験、トキシコロジー試験)、エンドユーザー別(バイオ医薬品企業、政府・学術機関、医療機器企業)、地域別&世界予測、2023年~2032年 |
|
出版日: 2023年03月31日
発行: Global Market Insights Inc.
ページ情報: 英文 104 Pages
納期: 2~3営業日
|
- 全表示
- 概要
- 図表
- 目次
前臨床CRO市場は、慢性疾患の増加や効果的な治療法に対する需要の高まりから、前臨床試験における医薬品の使用量が増加しており、2032年まで堅調に成長すると予想されています。
また、バイオテクノロジーや製薬会社は、前臨床試験における医療ニーズを満たすためにアウトソーシングを選択し、プロセス全体を迅速化することがよくあります。このため、前臨床段階に入る医薬品の数は大幅に増加しています。
全体として、前臨床CRO市場はエンドユース、サービス、地域の観点から二分化されています。
サービス分野では、「その他」のサブセグメントが推定期間中、CAGR7%以上の安定した成長率で推移すると予想されています。前臨床CRO市場のその他のサービスには、バイオアベイラビリティ試験、生物学的同等性試験、薬物相互作用試験サービスなどが含まれます。
前臨床CRO市場は、最終用途に基づき、政府・学術機関、バイオ製薬会社、医療機器会社、その他に分類されます。このうち、政府・学術機関セグメントは2022年に14.5%以上の市場シェアを占めています。この成長は、主に学術機関に委託される研究・調査活動が増加していることに起因すると考えられます。また、学術機関や政府は、前臨床試験による診断や治療へのアクセスを提供しており、これが今後、前臨床CRO業界の成長を促進するものと思われます。
地域別では、前臨床CRO市場は北米、欧州、アジア情勢、市場情勢、アジア太平洋に大きく分類されます。中でも、アジア太平洋地域の前臨床CRO市場は、推定期間中に安定した成長を遂げると予想されています。この地域の高齢者人口の増加、糖尿病、がん、心疾患などの慢性疾患の増加などが、市場の成長を補完すると予想されています。
また、アジア太平洋地域では、がん領域における治験薬や進行中の前臨床試験の数が増加しており、この地域の前臨床CRO事業規模を押し上げると考えられます。
一方、ラタム地域の前臨床CRO市場も、分析期間中、堅調な成長を遂げると予想されています。この地域のヘルスケアインフラは発達しており、規制環境も確立されています。これらの要因により、ラテンアメリカは前臨床研究を容易に行うことができる肥沃な土地となっています。
前臨床CRO市場で事業を展開している主要企業には、以下のようなものがあります:Laboratory Corporation of America Inc.、Charles River Laboratory Inc.、Pharmaceutical Product Development(PPD)LLC、ICON plc、Eurofins Scientific、Parexel International Corporation、Medpace、WuXi AppTec、SGS SA、Altasciences Company, Inc.
目次
第1章 調査手法
- 調査手法
- 市場の範囲と定義
- 基本推定値
- 予測計算
- COVID-19の世界レベルでの影響について
- データバリデーション
- データソース
- 2次データ
- 有償ソース
- 未払いソース
- 1次データ
- 2次データ
第2章 エグゼクティブサマリー
第3章 前臨床CROの業界洞察
- 業界別セグメンテーション
- 業界の情勢、2018年~2032年版
- 業界への影響要因
- 促進要因
- 世界の研究開発費の増加
- 研究開発活動のアウトソーシングの拡大
- 前臨床試験中の薬剤数の増加
- 業界の潜在的リスク&課題
- 厳しい規制政策
- 促進要因
- 成長性分析
- サービス別
- エンドユーズ別
- COVID-19影響分析
- 前臨床試験のボリューム分析
- 前臨床試験量分析、地域別、2018年~2021年
- 前臨床試験量分析、適応症別、2018年~2021年
- 前臨床試験量分析、開発段階別、2018年~2021年
- 規制状況について
- 米国
- 欧州
- アジア太平洋地域
- シンガポール
- マレーシア
- インドネシア
- タイ
- 韓国
- フィリピン
- 臨床試験-アジア太平洋地域の優位性
- 価格・情勢
- 産業エコシステム分析
- 創薬・開発プロセス
- ポーター分析
- PESTEL分析
第4章 競合情勢、2022年
- イントロダクション
- 企業マトリックス分析、2022年
- 企業シェア分析、2022年
- 戦略的ダッシュボード、2022年
- M&Aの状況
- CRO業界のM&A案件、2018年~2022年版
- 完成した受託研究機関のM&A案件(2018年~2021年
- CROのM&Aにおけるプライベートエクイティの影響力
- PRAヘルスサイエンス
- メドスペース社(Medpace, Inc.
- PPD社
- パレクセル・インターナショナル・コーポレーション
- 業界再編が市場全体に与える影響
- アナリストの見解
第5章 前臨床CRO市場:サービス別
- 主なセグメント動向
- バイオアナリシス&DMPKスタディ
- トキシコロジーテスト
- その他
第6章 前臨床CRO市場:エンドユーズ別
- 主なセグメント動向
- バイオ製薬会社
- 政府機関、学術機関
- 医療機器メーカー
- その他
第7章 前臨床CROデバイス市場:地域別
- 主な地域動向
- 北米
- 米国
- カナダ
- 欧州
- ドイツ
- 英国
- フランス
- スペイン
- イタリア
- アジア太平洋地域
- 日本
- 中国
- インド
- オーストラリア
- ラテンアメリカ
- ブラジル
- メキシコ
- MEA
- 南アフリカ
- サウジアラビア
第8章 企業プロファイル
- Charles River Laboratory, Inc.
- Laboratory Corporation of America, Inc.
- Pharmaceutical Product Development(PPD), LLC(a part of Thermo Fisher Scientific),
- ICON plc
- Eurofins Scientific
- Parexel International Corporation
- Medpace, Inc.
- WuXi AppTec
- SGS SA
- Altasciences Company, Inc.
Data Tables
- TABLE 1. Global preclinical CRO market, 2018 - 2022 (USD Million)
- TABLE 2. Global preclinical CRO market, 2023 - 2032 (USD Million)
- TABLE 3. Global preclinical CRO market, by service, 2018 - 2022 (USD Million)
- TABLE 4. Global preclinical CRO market, by service, 2023 - 2032 (USD Million)
- TABLE 5. Global preclinical CRO market, by end-use, 2018 - 2022 (USD Million)
- TABLE 6. Global preclinical CRO market, by end-use, 2023 - 2032 (USD Million)
- TABLE 7. Global preclinical CRO market, by region, 2018 - 2022 (USD Million)
- TABLE 8. Global preclinical CRO market, by region, 2023 - 2032 (USD Million)
- TABLE 9. Industry impact forces
- TABLE 10. Mergers and acquisitions landscape, 2018 - 2022
- TABLE 11. Bioanalysis & DMPK studies market size, by region, 2018 - 2022 (USD Million)
- TABLE 12. Bioanalysis & DMPK studies market size, by region, 2023 - 2032 (USD Million)
- TABLE 13. Toxicology testing market size, by region, 2018 - 2022 (USD Million)
- TABLE 14. Toxicology testing market size, by region, 2023 - 2032 (USD Million)
- TABLE 15. Others market size, by region, 2018 - 2022 (USD Million)
- TABLE 16. Others market size, by region, 2023 - 2032 (USD Million)
- TABLE 17. Biopharmaceutical companies market size, by region, 2018 - 2022 (USD Million)
- TABLE 18. Biopharmaceutical companies market size, by region, 2023 - 2032 (USD Million)
- TABLE 19. Government & academic institutes market size, by region, 2018 - 2022 (USD Million)
- TABLE 20. Government & academic institutes market size, by region, 2023 - 2032 (USD Million)
- TABLE 21. Medical device companies market size, by region, 2018 - 2022 (USD Million)
- TABLE 22. Medical device companies market size, by region, 2023 - 2032 (USD Million)
- TABLE 23. Others market size, by region, 2018 - 2022 (USD Million)
- TABLE 24. Others market size, by region, 2023 - 2032 (USD Million)
- TABLE 25. North America preclinical CRO market size, by country, 2018 - 2022 (USD Million)
- TABLE 26. North America preclinical CRO market size, by country, 2023 - 2032 (USD Million)
- TABLE 27. North America preclinical CRO market size, by service, 2018 - 2022 (USD Million)
- TABLE 28. North America preclinical CRO market size, by service, 2023 - 2032 (USD Million)
- TABLE 29. North America preclinical CRO market size, by end-use, 2018 - 2022 (USD Million)
- TABLE 30. North America preclinical CRO market size, by end-use, 2023 - 2032 (USD Million)
- TABLE 31. U.S. preclinical CRO market size, by service, 2018 - 2022 (USD Million)
- TABLE 32. U.S. preclinical CRO market size, by service, 2023 - 2032 (USD Million)
- TABLE 33. U.S. preclinical CRO market size, by end-use, 2018 - 2022 (USD Million)
- TABLE 34. U.S. preclinical CRO market size, by end-use, 2023 - 2032 (USD Million)
- TABLE 35. Canada preclinical CRO market size, by service, 2018 - 2022 (USD Million)
- TABLE 36. Canada preclinical CRO market size, by service, 2023 - 2032 (USD Million)
- TABLE 37. Canada preclinical CRO market size, by end-use, 2018 - 2022 (USD Million)
- TABLE 38. Canada preclinical CRO market size, by end-use, 2023 - 2032 (USD Million)
- TABLE 39. Europe preclinical CRO market size, by country, 2018 - 2022 (USD Million)
- TABLE 40. Europe preclinical CRO market size, by country, 2023 - 2032 (USD Million)
- TABLE 41. Europe preclinical CRO market size, by service, 2018 - 2022 (USD Million)
- TABLE 42. Europe preclinical CRO market size, by service, 2023 - 2032 (USD Million)
- TABLE 43. Europe preclinical CRO market size, by end-use, 2018 - 2022 (USD Million)
- TABLE 44. Europe preclinical CRO market size, by end-use, 2023 - 2032 (USD Million)
- TABLE 45. Germany preclinical CRO market size, by service, 2018 - 2022 (USD Million)
- TABLE 46. Germany preclinical CRO market size, by service, 2023 - 2032 (USD Million)
- TABLE 47. Germany preclinical CRO market size, by end-use, 2018 - 2022 (USD Million)
- TABLE 48. Germany preclinical CRO market size, by end-use, 2023 - 2032 (USD Million)
- TABLE 49. UK preclinical CRO market size, by service, 2018 - 2022 (USD Million)
- TABLE 50. UK preclinical CRO market size, by service, 2023 - 2032 (USD Million)
- TABLE 51. UK preclinical CRO market size, by end-use, 2018 - 2022 (USD Million)
- TABLE 52. UK preclinical CRO market size, by end-use, 2023 - 2032 (USD Million)
- TABLE 53. France preclinical CRO market size, by service, 2018 - 2022 (USD Million)
- TABLE 54. France preclinical CRO market size, by service, 2023 - 2032 (USD Million)
- TABLE 55. France preclinical CRO market size, by end-use, 2018 - 2022 (USD Million)
- TABLE 56. France preclinical CRO market size, by end-use, 2023 - 2032 (USD Million)
- TABLE 57. Italy preclinical CRO market size, by service, 2018 - 2022 (USD Million)
- TABLE 58. Italy preclinical CRO market size, by service, 2023 - 2032 (USD Million)
- TABLE 59. Italy preclinical CRO market size, by end-use, 2018 - 2022 (USD Million)
- TABLE 60. Italy preclinical CRO market size, by end-use, 2023 - 2032 (USD Million)
- TABLE 61. Spain preclinical CRO market size, by service, 2018 - 2022 (USD Million)
- TABLE 62. Spain preclinical CRO market size, by service, 2023 - 2032 (USD Million)
- TABLE 63. Spain preclinical CRO market size, by end-use, 2018 - 2022 (USD Million)
- TABLE 64. Spain preclinical CRO market size, by end-use, 2023 - 2032 (USD Million)
- TABLE 65. Asia Pacific preclinical CRO market size, by country, 2018 - 2022 (USD Million)
- TABLE 66. Asia Pacific preclinical CRO market size, by country, 2023 - 2032 (USD Million)
- TABLE 67. Asia Pacific preclinical CRO market size, by service, 2018 - 2022 (USD Million)
- TABLE 68. Asia Pacific preclinical CRO market size, by service, 2023 - 2032 (USD Million)
- TABLE 69. Asia Pacific preclinical CRO market size, by end-use, 2018 - 2022 (USD Million)
- TABLE 70. Asia Pacific preclinical CRO market size, by end-use, 2023 - 2032 (USD Million)
- TABLE 71. Japan preclinical CRO market size, by service, 2018 - 2022 (USD Million)
- TABLE 72. Japan preclinical CRO market size, by service, 2023 - 2032 (USD Million)
- TABLE 73. Japan preclinical CRO market size, by end-use, 2018 - 2022 (USD Million)
- TABLE 74. Japan preclinical CRO market size, by end-use, 2023 - 2032 (USD Million)
- TABLE 75. China preclinical CRO market size, by service, 2018 - 2022 (USD Million)
- TABLE 76. China preclinical CRO market size, by service, 2023 - 2032 (USD Million)
- TABLE 77. China preclinical CRO market size, by end-use, 2018 - 2022 (USD Million)
- TABLE 78. China preclinical CRO market size, by end-use, 2023 - 2032 (USD Million)
- TABLE 79. India preclinical CRO market size, by service, 2018 - 2022 (USD Million)
- TABLE 80. India preclinical CRO market size, by service, 2023 - 2032 (USD Million)
- TABLE 81. India preclinical CRO market size, by end-use, 2018 - 2022 (USD Million)
- TABLE 82. India preclinical CRO market size, by end-use, 2023 - 2032 (USD Million)
- TABLE 83. Australia preclinical CRO market size, by service, 2018 - 2022 (USD Million)
- TABLE 84. Australia preclinical CRO market size, by service, 2023 - 2032 (USD Million)
- TABLE 85. Australia preclinical CRO market size, by end-use, 2018 - 2022 (USD Million)
- TABLE 86. Australia preclinical CRO market size, by end-use, 2023 - 2032 (USD Million)
- TABLE 87. Latin America preclinical CRO market size, by country, 2018 - 2022 (USD Million)
- TABLE 88. Latin America preclinical CRO market size, by country, 2023 - 2032 (USD Million)
- TABLE 89. Latin America preclinical CRO market size, by service, 2018 - 2022 (USD Million)
- TABLE 90. Latin America preclinical CRO market size, by service, 2023 - 2032 (USD Million)
- TABLE 91. Latin America preclinical CRO market size, by end-use, 2018 - 2022 (USD Million)
- TABLE 92. Latin America preclinical CRO market size, by end-use, 2023 - 2032 (USD Million)
- TABLE 93. Brazil preclinical CRO market size, by service, 2018 - 2022 (USD Million)
- TABLE 94. Brazil preclinical CRO market size, by service, 2023 - 2032 (USD Million)
- TABLE 95. Brazil preclinical CRO market size, by end-use, 2018 - 2022 (USD Million)
- TABLE 96. Brazil preclinical CRO market size, by end-use, 2023 - 2032 (USD Million)
- TABLE 97. Mexico preclinical CRO market size, by service, 2018 - 2022 (USD Million)
- TABLE 98. Mexico preclinical CRO market size, by service, 2023 - 2032 (USD Million)
- TABLE 99. Mexico preclinical CRO market size, by end-use, 2018 - 2022 (USD Million)
- TABLE 100. Mexico preclinical CRO market size, by end-use, 2023 - 2032 (USD Million)
- TABLE 101. MEA preclinical CRO market size, by country, 2018 - 2022 (USD Million)
- TABLE 102. MEA preclinical CRO market size, by country, 2023 - 2032 (USD Million)
- TABLE 103. MEA preclinical CRO market size, by service, 2018 - 2022 (USD Million)
- TABLE 104. MEA preclinical CRO market size, by service, 2023 - 2032 (USD Million)
- TABLE 105. MEA preclinical CRO market size, by end-use, 2018 - 2022 (USD Million)
- TABLE 106. MEA preclinical CRO market size, by end-use, 2023 - 2032 (USD Million)
- TABLE 107. South Africa preclinical CRO market size, by service, 2018 - 2022 (USD Million)
- TABLE 108. South Africa preclinical CRO market size, by service, 2023 - 2032 (USD Million)
- TABLE 109. South Africa preclinical CRO market size, by end-use, 2018 - 2022 (USD Million)
- TABLE 110. South Africa preclinical CRO market size, by end-use, 2023 - 2032 (USD Million)
- TABLE 111. Saudi Arabia preclinical CRO market size, by service, 2018 - 2022 (USD Million)
- TABLE 112. Saudi Arabia preclinical CRO market size, by service, 2023 - 2032 (USD Million)
- TABLE 113. Saudi Arabia preclinical CRO market size, by end-use, 2018 - 2022 (USD Million)
- TABLE 114. Saudi Arabia preclinical CRO market size, by end-use, 2023 - 2032 (USD Million)
Charts & Figures
- FIG 1. Top-down approach
- FIG 2. Breakdown of primary participants
- FIG 3. Preclinical industry 360 degree synopsis, 2018 - 2032
- FIG 4. Industry segmentation
- FIG 5. Industry landscape, 2018-2032 (USD Million)
- FIG 6. Growth potential analysis, by service
- FIG 7. Growth potential analysis, by end-use
- FIG 8. Industry ecosystem analysis
- FIG 9. Drug discovery and development process
- FIG 10. Company matrix analysis, 2022
- FIG 11. Strategy dashboard, 2022
- FIG 12. Key segment trends, by service
- FIG 13. Key segment trends, by end-use
- FIG 14. Key regional trends
Preclinical CRO Market is slated to grow at a robust rate through 2032 owing to the increasing usage of drugs during preclinical trials given the rising cases of chronic diseases and an increasing demand for effective treatment for the same. Besides, various biotechnology and pharmaceutical companies, quite often, opt for outsourcing to attain the medical needs for preclinical validations to fasten up the whole process. This has significantly propelled the number of drugs entering the preclinical phase.
Overall, the preclinical CRO market has been bifurcated in terms of end-use, service, and region.
Within the service segment, the others subsegment is slated to grow at a steady rate of more than 7% CAGR through the estimated timeframe. The other services in the preclinical CRO market comprise bioavailability testing, bioequivalence testing, drug-interaction testing services, etc.
Based on end-use, the preclinical CRO market has been divided into government & academic institutes, biopharmaceutical companies, medical device companies, and others. Among them, the government & academic institutes segment held more than 14.5% market share in 2022. The growth can be primarily attributed to the increasing number of research and R&D activities that are outsourced to academic institutes. Besides, academic institutes and the governments are also providing diagnosis and access to treatments under preclinical trials, which is likely to propel the preclinical CRO industry growth in the upcoming time.
In the regional landscape, the preclinical CRO market has been broadly categorized into North America, Europe, LATAM, MEA, and Asia Pacific. Among them, the preclinical CRO market in the Asia Pacific region is anticipated to grow at a steady rate over the estimated timeframe. The increasing geriatric population in this region and rising cases of chronic diseases like diabetes, cancer, and cardiac diseases are anticipated to supplement the market growth.
Additionally, an increase in the number of investigational compounds and ongoing preclinical trials in oncology in Asia Pacific will boost the preclinical CRO business size in this region.
Meanwhile, the preclinical CRO market in the LATAM region is also slated to grow at a robust rate through the analysis timeframe. The healthcare infrastructure in this region is well-developed and it also boasts a well-established regulatory environment. These factors enable Latin America to be a fertile landscape to allow preclinical research to be conducted easily.
Some of the key companies operating in the preclinical CRO market are: Laboratory Corporation of America Inc., Charles River Laboratory Inc., Pharmaceutical Product Development (PPD) LLC, ICON plc, Eurofins Scientific, Parexel International Corporation, Medpace, Inc., WuXi AppTec, SGS SA, Altasciences Company, Inc.
Table of Contents
Chapter 1 Methodology
- 1.1 Methodology
- 1.2 Market scope and definition
- 1.3 Base estimates
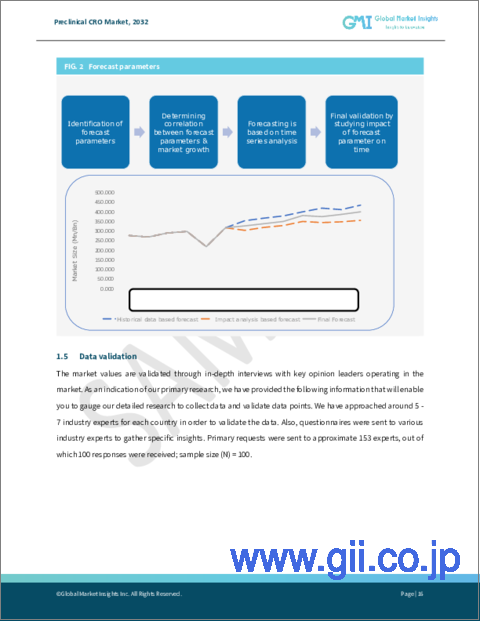
- 1.4 Forecast calculations
- 1.5 COVID-19 impact at global level
- 1.6 Data validation
- 1.7 Data Sources
- 1.7.1 Secondary
- 1.7.1.1 Paid sources
- 1.7.1.2 Unpaid sources
- 1.7.2 Primary
- 1.7.1 Secondary
Chapter 2 Executive Summary
- 2.1 Preclinical CRO industry 360 degree synopsis, 2018 - 2032
- 2.1.1 Business trends
- 2.1.2 Service trends
- 2.1.3 End-use trends
- 2.1.4 Regional trends
Chapter 3 Preclinical CRO Industry Insights
- 3.1 Industry segmentation
- 3.2 Industry landscape, 2018 - 2032
- 3.3 Industry impact forces
- 3.3.1 Growth drivers
- 3.3.1.1 Increasing R&D expenditure worldwide
- 3.3.1.2 Growing outsourcing of R&D activities
- 3.3.1.3 Rising number of drugs in preclinical trails
- 3.3.2 Industry pitfalls & challenges
- 3.3.2.1 Stringent regulatory policies
- 3.3.1 Growth drivers
- 3.4 Growth potential analysis
- 3.4.1 By service
- 3.4.2 By end-use
- 3.5 COVID-19 impact analysis
- 3.6 Preclinical trial volume analysis
- 3.6.1 preclinical trial volume analysis, by region, 2018 - 2021
- 3.6.2 preclinical trial volume analysis, by indication, 2018 - 2021
- 3.6.3 preclinical trial volume analysis, by phase of development, 2018 - 2021
- 3.7 Regulatory landscape
- 3.7.1 U.S.
- 3.7.2 Europe
- 3.7.3 Asia Pacific
- 3.7.3.1 Singapore
- 3.7.3.2 Malaysia
- 3.7.3.3 Indonesia
- 3.7.3.4 Thailand
- 3.7.3.5 South Korea
- 3.7.3.6 Philippines
- 3.8 Clinical trials- Asia Pacific advantage
- 3.9 Pricing Landscape
- 3.10 Industry ecosystem analysis
- 3.11 Drug discovery and development process
- 3.12 Porter's analysis
- 3.13 PESTEL analysis
Chapter 4 Competitive Landscape, 2022
- 4.1 Introduction
- 4.2 Company matrix analysis, 2022
- 4.3 Company market share analysis, 2022
- 4.4 Strategic dashboard, 2022
- 4.5 Merger & acquisition landscape
- 4.5.1 Merger & acquisition deals in the CRO industry, 2018 - 2022
- 4.5.2 Completed contract research organization merger & acquisition deals, 2018-2021
- 4.5.3 Influence of private equity in CRO mergers & acquisitions
- 4.5.3.1 PRA Health Sciences
- 4.5.3.2 Medpace, Inc.
- 4.5.3.3 PPD, Inc.
- 4.5.3.4 Parexel International Corporation
- 4.5.4 Impact of industry consolidation on the overall market
- 4.5.5 Analyst insights
Chapter 5 Preclinical CRO Market, By Service
- 5.1 Key segment trends
- 5.2 Bioanalysis & DMPK studies
- 5.2.1 Market estimates and forecast, 2018 - 2032 (USD Million)
- 5.3 Toxicology testing
- 5.3.1 Market estimates and forecast, 2018 - 2032 (USD Million)
- 5.4 Others
- 5.4.1 Market estimates and forecast, 2018 - 2032 (USD Million)
Chapter 6 Preclinical CRO Market, By End-use
- 6.1 Key segment trends
- 6.2 Biopharmaceutical companies
- 6.2.1 Market estimates and forecast, 2018 - 2032 (USD Million)
- 6.3 Government and academic institutes
- 6.3.1 Market estimates and forecast, 2018 - 2032 (USD Million)
- 6.4 Medical devices companies
- 6.4.1 Market estimates and forecast, 2018 - 2032 (USD Million)
- 6.5 Others
- 6.5.1 Market estimates and forecast, 2018 - 2032 (USD Million)
Chapter 7 Preclinical CRO Devices Market, By Region
- 7.1 Key regional trends
- 7.2 North America
- 7.2.1 U.S.
- 7.2.2 Canada
- 7.3 Europe
- 7.3.1 Germany
- 7.3.2 UK
- 7.3.3 France
- 7.3.4 Spain
- 7.3.5 Italy
- 7.4 Asia Pacific
- 7.4.1 Japan
- 7.4.2 China
- 7.4.3 India
- 7.4.4 Australia
- 7.5 Latin America
- 7.5.1 Brazil
- 7.5.2 Mexico
- 7.6 MEA
- 7.6.1 South Africa
- 7.6.2 Saudi Arabia
Chapter 8 Company Profiles
- 8.1 Charles River Laboratory, Inc.
- 8.2 Laboratory Corporation of America, Inc.
- 8.3 Pharmaceutical Product Development (PPD), LLC (a part of Thermo Fisher Scientific),
- 8.4 ICON plc
- 8.5 Eurofins Scientific
- 8.6 Parexel International Corporation
- 8.7 Medpace, Inc.
- 8.8 WuXi AppTec
- 8.9 SGS SA
- 8.10 Altasciences Company, Inc.