
|
市場調査レポート
商品コード
1876815
デジタルツイン市場の機会、成長要因、業界動向分析、および2025年から2034年までの予測Digital Twin Market Opportunity, Growth Drivers, Industry Trend Analysis, and Forecast 2025 - 2034 |
||||||
カスタマイズ可能
|
|||||||
| デジタルツイン市場の機会、成長要因、業界動向分析、および2025年から2034年までの予測 |
|
出版日: 2025年11月14日
発行: Global Market Insights Inc.
ページ情報: 英文 230 Pages
納期: 2~3営業日
|

概要
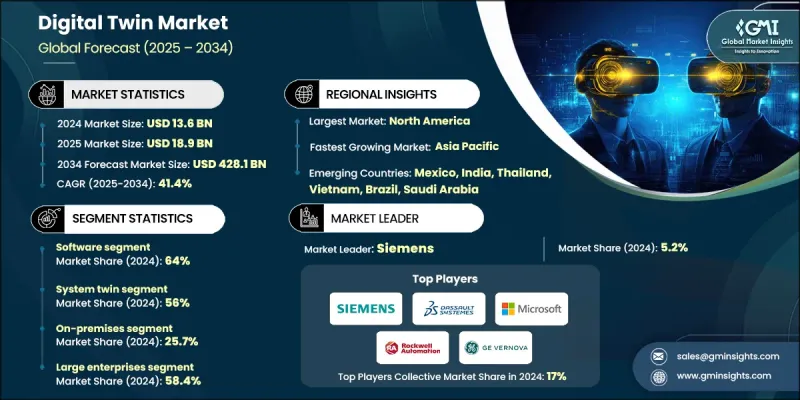
世界のデジタルツイン市場は、2024年に136億米ドルと評価され、2034年までにCAGR41.4%で成長し、4,281億米ドルに達すると予測されております。
インダストリー4.0の台頭により、生産性、業務効率、収益性の向上を目的とした先進技術の採用が各産業で推進されております。デジタルツイン技術は、センサーやネットワーク機器などのハードウェア・ソフトウェアを活用し、製品、システム、プロセスを仮想的に複製することを可能にします。これらのセンサーはリアルタイムデータを収集し、システム動作の可視化、エラー検出、コンポーネントの継続的な監視を実現します。製造業、航空宇宙、運輸、通信、エネルギーなどの分野では、保守スケジュールの最適化、エネルギー消費量の削減、監視コストの低減を目的としてデジタルツインが導入されています。多くの産業分野でまだこの技術が導入されていない状況の中、分析技術、人工知能、シミュレーションツールの継続的な進歩が市場プレイヤーにとって大きな機会を生み出しています。
| 市場範囲 | |
|---|---|
| 開始年 | 2024年 |
| 予測期間 | 2025-2034 |
| 開始時価値 | 136億米ドル |
| 予測金額 | 4,281億米ドル |
| CAGR | 41.4% |
ソフトウェア分野は、2034年までにCAGR 43.3%で成長すると予測されています。この分野の主導的立場は、デジタルツインソリューションの技術集約的な性質を反映しており、その価値はシミュレーションソフトウェア、AI機能、高度な分析によって推進されています。ソフトウェアプラットフォームは、リアルタイム同期、予測モデリング、最適化を可能にし、基本的な監視をはるかに超えた機能を提供します。
システムツインセグメントは、製造ライン、通信ネットワーク、配管システムなど複雑な産業設備の設計・管理における広範な応用により、2024年に56%のシェアを占めました。システムツインは、運用最適化と予知保全の実現に不可欠です。全体として、システムツインは複雑な環境における複数のコンポーネントやサブシステム間の相互作用をシミュレートすることが可能です。
米国デジタルツイン市場は2024年に44億米ドルに達し、北米地域における最大の貢献国となりました。製造業、エネルギー、医療、航空宇宙分野で大規模ソリューションを導入する企業や政府研究施設が成長を牽引しています。クラウドプラットフォームプロバイダー、産業統合事業者、マネージドサービスの存在が導入を加速させ、デジタルツインソリューションを導入する組織の価値実現までの時間を短縮しています。
グローバルデジタルツイン市場における主要プレイヤーには、ロックウェル・オートメーション、ダッソー・システムズ、シーメンス、マイクロソフト、GEバーノバ、アマゾンウェブサービス、ヘキサゴンなどが含まれます。グローバルデジタルツイン市場の企業は、市場での存在感を高め、基盤を強化するために複数の戦略を採用しています。より正確でスケーラブルなソリューションを実現するため、ソフトウェアプラットフォーム、シミュレーションツール、AI駆動型分析の改善に向けた研究開発に多額の投資を行っています。産業企業や技術プロバイダーとの戦略的提携は、サービス提供範囲の拡大と長期契約の確保に寄与します。合併や買収により、企業は能力を統合し、市場シェアを拡大し、新たな地域へ進出することが可能となります。また、各社は自社製品の差別化を図るため、マネージドサービス、クラウドベースのソリューション、業界特化型アプリケーションの提供にも注力しています。
よくあるご質問
目次
第1章 調査手法
- 市場範囲と定義
- 調査設計
- 調査アプローチ
- データ収集方法
- データマイニングの情報源
- グローバル
- 地域別/国別
- 基本推定値と計算
- 基準年計算
- 市場推定における主要な動向
- 1次調査および検証
- 一次情報
- 予測
- 調査前提条件と制限事項
第2章 エグゼクティブサマリー
第3章 業界考察
- エコシステム分析
- サプライヤーの情勢
- 利益率
- コスト構造
- 各段階における付加価値
- バリューチェーンに影響を与える要因
- ディスラプション
- 業界への影響要因
- 促進要因
- インダストリー4.0およびスマート製造の導入
- IoTおよびセンサー技術の進展
- AI/機械学習統合能力
- 予知保全のコストメリット
- 業界の潜在的リスク&課題
- 高い導入コストと複雑さ
- サイバーセキュリティとプライバシーに関する懸念事項
- 市場機会
- エッジコンピューティングの統合
- デジタルツイン・アズ・ア・サービスモデル
- 業界横断型プラットフォーム開発
- 新興市場への進出
- 促進要因
- 成長可能性分析
- 規制情勢
- 北米
- 欧州
- アジア太平洋地域
- ラテンアメリカ
- 中東・アフリカ
- ポーター分析
- PESTEL分析
- 技術とイノベーションの動向
- 現在の技術動向
- 新興技術
- 技術ロードマップと進化
- 技術導入ライフサイクル分析
- 価格動向
- 地域別
- 製品別
- コスト内訳分析
- 特許分析
- 持続可能性と環境面
- 持続可能な実践
- 廃棄物削減戦略
- 生産におけるエネルギー効率化
- 環境に配慮した取り組み
- カーボンフットプリントに関する考慮事項
- リスク及びレジリエンス分析
- テクノロジーリスク評価
- オペレーショナルリスク管理
- セキュリティリスクフレームワーク
- 規制・コンプライアンスリスク
- 金融リスク評価
- レジリエンス構築戦略
- サイバーセキュリティとデータガバナンスの現状
- サイバーセキュリティフレームワーク
- 脅威インテリジェンスと監視
- データガバナンスフレームワーク
- プライバシー及びコンプライアンス管理
- セキュリティアーキテクチャと設計
- 監査およびコンプライアンス監視
- 人材・スキル動向
- スキルギャップ分析
- 人材育成プログラム
- 人材獲得戦略
- 将来のスキル要件
- 研修・開発ロードマップ
- 産学連携
- 事例研究
第4章 競合情勢
- イントロダクション
- 企業の市場シェア分析
- 北米
- 欧州
- アジア太平洋地域
- ラテンアメリカ
- 中東・アフリカ地域
- 主要市場企業の競合分析
- 競合ポジショニングマトリックス
- 戦略的展望マトリックス
- 主な発展
- 合併・買収
- 提携・協力関係
- 新製品の発売
- 事業拡大計画と資金調達
- ベンダー選定基準
第5章 市場推計・予測:提供別、2021-2034
- 主要動向
- ハードウェア
- センサー
- ネットワーク機器
- データストレージおよびコンピューティングデバイス
- 電力・サポートインフラ
- コントローラー
- その他
- ソフトウェア
- サービス
- 専門サービス
- システム統合
- トレーニング及びコンサルティング
- サポートおよび保守
- マネージドサービス
- 専門サービス
第6章 市場推計・予測:ソリューション別、2021-2034
- 主要動向
- プロセスツイン
- システムツイン
- プロダクトツイン
第7章 市場推計・予測:導入形態別、2021-2034
- 主要動向
- クラウド
- オンプレミス
- ハイブリッド
第8章 市場推計・予測:企業規模別、2021-2034
- 主要動向
- 中小企業
- 大企業
第9章 市場推計・予測:技術別、2021-2034
- 主要動向
- 人工知能(AI)と機械学習
- IoTおよび産業用IoT(IIoT)
- 拡張現実(AR)および仮想現実(VR)
- ブロックチェーン
- その他
第10章 市場推計・予測:最終用途別、2021-2034
- 主要動向
- 製造業
- ヘルスケア
- 自動車および輸送機器
- 航空宇宙・防衛産業
- スマートシティ
- エネルギー・公益事業
- 通信
- その他
第11章 市場推計・予測:地域別、2021-2034
- 主要動向
- 北米
- 米国
- カナダ
- 欧州
- ドイツ
- 英国
- フランス
- イタリア
- スペイン
- ロシア
- 北欧諸国
- ベネルクス
- アジア太平洋地域
- 中国
- インド
- 日本
- 韓国
- ANZ
- シンガポール
- マレーシア
- インドネシア
- ベトナム
- タイ
- ラテンアメリカ
- ブラジル
- メキシコ
- アルゼンチン
- コロンビア
- 中東・アフリカ地域(MEA)
- 南アフリカ
- サウジアラビア
- アラブ首長国連邦
第12章 企業プロファイル
- Global companies
- Siemens
- GE Vernova
- Microsoft
- PTC
- Dassault Systemes
- Autodesk
- Rockwell Automation
- Ansys
- SAP
- Honeywell International
- Regional companies
- Accenture
- Infosys
- Tata Consultancy Services
- Wipro
- Atos
- NTT Data
- Fujitsu
- Ericsson
- Nokia
- DXC Technology
- Emerging companies
- Unity Technologies
- Bentley Systems
- Emerson Electric
- Hexagon
- C3.ai
