
|
市場調査レポート
商品コード
1666707
レクリエーショナルビークルの市場機会、成長促進要因、産業動向分析、2025年~2034年予測Recreational Vehicle Market Opportunity, Growth Drivers, Industry Trend Analysis, and Forecast 2025 - 2034 |
||||||
カスタマイズ可能
|
|||||||
| レクリエーショナルビークルの市場機会、成長促進要因、産業動向分析、2025年~2034年予測 |
|
出版日: 2024年12月23日
発行: Global Market Insights Inc.
ページ情報: 英文 180 Pages
納期: 2~3営業日
|

全表示
- 概要
- 目次
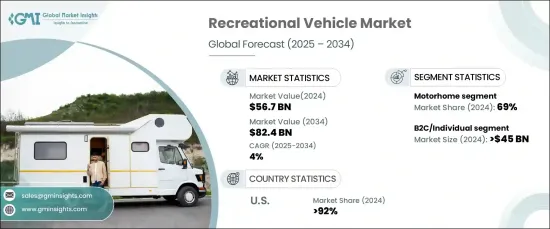
世界のレクリエーショナルビークル市場は、2024年に567億米ドルとなり、2025年から2034年にかけてCAGR4%で安定した成長が見込まれています。
この拡大にはいくつかの要因があり、特に北米ではRVパークの開発と道路インフラの整備が進んでいます。新しいRVパークが出現し、既存のRVパークが近代化されるにつれて、RV旅行の利便性と魅力は高まり続け、レジャーやキャンプを求める旅行者により良い施設と改善されたアクセスを提供しています。
RVの人気が高まっているのは、より持続可能で個性的な旅行体験へのシフトの反映です。消費者の環境意識はかつてないほど高まっており、環境に優しいRV車への需要が顕著に高まっています。特に、ハイブリッド車や電気自動車が人気を集めており、レクリエーション旅行における二酸化炭素排出量の削減に役立っています。メーカー各社は、ソーラーパネルやエネルギー効率に優れたシステム、その他の持続可能な機能を搭載したRV車を導入することでこの需要に応えており、環境に優しい旅行ソリューションへの選好の高まりに対応しています。
| 市場規模 | |
|---|---|
| 開始年 | 2024年 |
| 予測年 | 2025年~2034年 |
| 開始金額 | 567億米ドル |
| 予測金額 | 824億米ドル |
| CAGR | 4% |
RV市場には2つの主要セグメントがあります:B2C/個人とB2B/フリートオーナーです。B2Cセグメントは2024年に450億米ドルと評価され、アウトドア活動や冒険への関心の高まりから市場を独占しています。可処分所得の増加と、個人的な旅行体験への欲求が、RV所有の需要増加の主な要因です。柔軟な資金調達オプションと、個人の好みに合わせて設計されたカスタマイズ可能なRV機能の組み合わせにより、RV所有がこれまで以上に身近なものとなっています。ソーシャルメディアがRV旅行を望ましいライフスタイルとして広める役割を果たしたことも、B2Cセグメントの成長に大きく寄与し、コミュニティ意識と放浪欲を煽っています。
市場はさらにモーターホームとキャラバンに分けられ、2024年のシェアはモーターホームが69%と圧倒的です。これらのオールインワンユニットは、キッチン、バスルーム、エンターテインメントシステムといった近代的な設備を備え、機動性と快適性の両方を提供できることから人気があります。モーターホームは家族連れにも一人旅にも対応し、長期旅行にも高い快適性と柔軟性を提供するため、旅先での利便性を求める人々に好まれます。
米国のレクリエーショナルビークル市場だけでも、2024年には92%という圧倒的なシェアを占めました。これは、アウトドア探索の強い文化と、RV車での旅行を身近で楽しいものにする高速道路の広範なネットワークが原動力となっています。国内旅行への継続的な選好と、ソーラー発電システムやスマートコネクティビティなどの技術革新が相まって、市場の成長に寄与しています。さらに、電動RVを導入するための政府の優遇措置や、RVパークの利用可能性の拡大が、市場の魅力を高めています。また、確立されたレンタル市場も重要な役割を果たしており、初めてRVを利用するユーザーや季節的な旅行者に、長期的なコミットメントなしにRV旅行を体験する機会を提供し、結果的に市場の持続的成長を支えています。
目次
第1章 調査手法と調査範囲
- 調査デザイン
- 調査アプローチ
- データ収集方法
- 基本推定と計算
- 基準年の算出
- 市場推計の主要動向
- 予測モデル
- 一次調査と検証
- 一次ソース
- データマイニングソース
- 市場定義
第2章 エグゼクティブサマリー
第3章 業界洞察
- 業界エコシステム分析
- サプライヤーの状況
- 原材料サプライヤー
- 部品サプライヤー
- メーカー
- サービス・プロバイダー
- 販売業者
- エンドユーザー
- 利益率分析
- 価格分析
- コスト内訳分析
- テクノロジーとイノベーションの展望
- 主要ニュースと取り組み
- 規制状況
- 影響要因
- 成長促進要因
- 革新的機能がRV車の機能性と魅力を高める
- アウトドアレジャーの人気上昇
- 新興国における可処分所得の増加
- レンタルRVサービスの普及
- 業界の潜在的リスク・課題
- 電動RVの充電インフラは限定的
- 成長促進要因
- 成長可能性分析
- ポーター分析
- PESTEL分析
第4章 競合情勢
- イントロダクション
- 企業市場シェア分析
- 競合のポジショニングマトリックス
- 戦略展望マトリックス
第5章 市場推計・予測:車両別、2021年~2034年
- 主要動向
- モーターホーム
- クラス
- クラスA
- クラスB
- クラスC
- 燃料
- ガソリン
- ディーゼル
- クラス
- キャラバン
- 従来型キャラバン
- テントトレーラー
- ポップトップ
- ポップアウト
- キャンピングトレーラー
- フィフスホイーラー
第6章 市場推計・予測:価格別、2021年~2034年
- 主要動向
- スタンダード
- ラグジュアリー
第7章 市場推計・予測:最終用途別、2021年~2034年
- 主要動向
- B2C/個人
- モーターホーム
- キャラバン
- B2B/フリートオーナー
- モーターホーム
- キャラバン
第8章 市場推計・予測:地域別、2021年~2034年
- 主要動向
- 北米
- 米国
- カナダ
- 欧州
- ドイツ
- 英国
- イタリア
- フランス
- スペイン
- スウェーデン
- オランダ
- ノルウェー
- トルコ
- ギリシャ
- ハンガリー
- グルジア
- アジア太平洋
- 中国
- インド
- 日本
- 韓国
- オーストラリア
- ラテンアメリカ・中東・アフリカ
- ブラジル
- メキシコ
- UAE
- サウジアラビア
- 南アフリカ
第9章 企業プロファイル
- Thor Industries
- Winnebago Industries
- Forest River
- Knaus Tabbert
- Trigano
- Hymer
- Jayco
- Coachmen RV
- Airstream
- REV Group
- Carado
- Burstner
- Swift Group
- Adria Mobil
- Lunar Caravans
- Chausson
- Newmar
- Etrusco
- Kabe AB
- Fleetwood RV
The Global Recreational Vehicle Market, valued at USD 56.7 billion in 2024, is expected to experience steady growth at a CAGR of 4% from 2025 to 2034. This expansion is fueled by several factors, particularly the increasing development of RV parks and the improvement of road infrastructure, especially in North America. As new RV parks emerge and existing ones are modernized, the convenience and appeal of RV travel continue to rise, offering better facilities and improved accessibility for travelers seeking leisure and camping activities.
The growing popularity of RVs is a reflection of the shift toward more sustainable and personalized travel experiences. Consumers are more environmentally conscious than ever, and there is a noticeable uptick in demand for eco-friendly RVs. In particular, hybrid and electric models are gaining traction, helping to reduce the carbon footprint of recreational travel. Manufacturers are responding to this demand by introducing RVs that come equipped with solar panels, energy-efficient systems, and other sustainable features, aligning with the growing preference for greener travel solutions.
| Market Scope | |
|---|---|
| Start Year | 2024 |
| Forecast Year | 2025-2034 |
| Start Value | $56.7 Billion |
| Forecast Value | $82.4 Billion |
| CAGR | 4% |
In the RV market, we see two main segments: B2C/Individual and B2B/Fleet Owners. The B2C segment, valued at USD 45 billion in 2024, dominates the market due to increasing interest in outdoor activities and adventure. Growing disposable income and a desire for personalized travel experiences are key drivers behind the rising demand for RV ownership. Flexible financing options, combined with customizable RV features designed to fit personal preferences, have made RV ownership more accessible than ever. Social media's role in promoting RV travel as a desirable lifestyle has also been a significant factor in the B2C segment's growth, fueling a sense of community and wanderlust.
The market is further divided into motorhomes and caravans, with motorhomes holding a dominant 69% share in 2024. These all-in-one units are popular due to their ability to offer both mobility and comfort, featuring modern amenities like kitchens, bathrooms, and entertainment systems. Motorhomes cater to both families and solo travelers, providing a high level of comfort and flexibility for extended trips, making them the preferred choice for those looking for convenience on the road.
The U.S. recreational vehicle market alone holds a commanding 92% share in 2024, driven by a strong culture of outdoor exploration and the extensive network of highways that make RV travel accessible and enjoyable. The continued preference for domestic travel, combined with technological innovations such as solar-powered systems and smart connectivity, has contributed to market growth. Additionally, government incentives to adopt electric RVs and the expanding availability of RV parks are bolstering the market's appeal. The well-established rental market also plays a crucial role, providing first-time users and seasonal travelers with the opportunity to experience RV travel without long-term commitment, ultimately supporting sustained market growth.
Table of Contents
Chapter 1 Methodology & Scope
- 1.1 Research design
- 1.1.1 Research approach
- 1.1.2 Data collection methods
- 1.2 Base estimates and calculations
- 1.2.1 Base year calculation
- 1.2.2 Key trends for market estimates
- 1.3 Forecast model
- 1.4 Primary research & validation
- 1.4.1 Primary sources
- 1.4.2 Data mining sources
- 1.5 Market definitions
Chapter 2 Executive Summary
- 2.1 Industry 3600 synopsis, 2021 - 2034
Chapter 3 Industry Insights
- 3.1 Industry ecosystem analysis
- 3.2 Supplier landscape
- 3.2.1 Raw material supplier
- 3.2.2 Component supplier
- 3.2.3 Manufacturer
- 3.2.4 Service provider
- 3.2.5 Distributor
- 3.2.6 End-user
- 3.3 Profit margin analysis
- 3.4 Pricing analysis
- 3.5 Cost breakdown analysis
- 3.6 Technology & innovation landscape
- 3.7 Key news & initiatives
- 3.8 Regulatory landscape
- 3.9 Impact forces
- 3.9.1 Growth drivers
- 3.9.1.1 Innovative features boost RV functionality and appeal
- 3.9.1.2 Outdoor leisure activities are increasingly popular
- 3.9.1.3 Disposable incomes rise in emerging economies
- 3.9.1.4 Rental RV services gain widespread popularity
- 3.9.2 Industry pitfalls & challenges
- 3.9.2.1 Electric RVs face limited charging infrastructure
- 3.9.1 Growth drivers
- 3.10 Growth potential analysis
- 3.11 Porter’s analysis
- 3.12 PESTEL analysis
Chapter 4 Competitive Landscape, 2024
- 4.1 Introduction
- 4.2 Company market share analysis
- 4.3 Competitive positioning matrix
- 4.4 Strategic outlook matrix
Chapter 5 Market Estimates & Forecast, By Vehicle, 2021 - 2034 ($Mn, Units)
- 5.1 Key trends
- 5.2 Motorhomes
- 5.2.1 Class
- 5.2.1.1 Class A
- 5.2.1.2 Class B
- 5.2.1.3 Class C
- 5.2.2 Fuel
- 5.2.2.1 Gasoline
- 5.2.2.2 Diesel
- 5.2.1 Class
- 5.3 Caravans
- 5.3.1 Conventional caravans
- 5.3.2 Tent trailer
- 5.3.3 Pop-top
- 5.3.4 Pop-out
- 5.3.5 Camper trailer
- 5.3.6 Fifth wheeler
Chapter 6 Market Estimates & Forecast, By Price, 2021 - 2034 ($Mn, Units)
- 6.1 Key trends
- 6.2 Standard
- 6.3 Luxury
Chapter 7 Market Estimates & Forecast, By End Use, 2021 - 2034 ($Mn, Units)
- 7.1 Key trends
- 7.2 B2C/Individual
- 7.2.1 Motorhome
- 7.2.2 Caravan
- 7.3 B2B/Fleet owner
- 7.3.1 Motorhome
- 7.3.2 Caravan
Chapter 8 Market Estimates & Forecast, By Region, 2021 - 2034 ($Mn, Units)
- 8.1 Key trends
- 8.2 North America
- 8.2.1 U.S.
- 8.2.2 Canada
- 8.3 Europe
- 8.3.1 Germany
- 8.3.2 UK
- 8.3.3 Italy
- 8.3.4 France
- 8.3.5 Spain
- 8.3.6 Sweden
- 8.3.7 Netherlands
- 8.3.8 Norway
- 8.3.9 Turkey
- 8.3.10 Greece
- 8.3.11 Hungary
- 8.3.12 Georgia
- 8.4 Asia Pacific
- 8.4.1 China
- 8.4.2 India
- 8.4.3 Japan
- 8.4.4 South Korea
- 8.4.5 Australia
- 8.5 LAMEA
- 8.5.1 Brazil
- 8.5.2 Mexico
- 8.5.3 UAE
- 8.5.4 Saudi Arabia
- 8.5.5 South Africa
Chapter 9 Company Profiles
- 9.1 Thor Industries
- 9.2 Winnebago Industries
- 9.3 Forest River
- 9.4 Knaus Tabbert
- 9.5 Trigano
- 9.6 Hymer
- 9.7 Jayco
- 9.8 Coachmen RV
- 9.9 Airstream
- 9.10 REV Group
- 9.11 Carado
- 9.12 Burstner
- 9.13 Swift Group
- 9.14 Adria Mobil
- 9.15 Lunar Caravans
- 9.16 Chausson
- 9.17 Newmar
- 9.18 Etrusco
- 9.19 Kabe AB
- 9.20 Fleetwood RV
