
|
市場調査レポート
商品コード
1858964
エレベーターの市場機会と促進要因、業界動向分析、2025~2034年予測Elevators Market Opportunity, Growth Drivers, Industry Trend Analysis, and Forecast 2025 - 2034 |
||||||
カスタマイズ可能
|
|||||||
| エレベーターの市場機会と促進要因、業界動向分析、2025~2034年予測 |
|
出版日: 2025年10月14日
発行: Global Market Insights Inc.
ページ情報: 英文 240 Pages
納期: 2~3営業日
|

概要
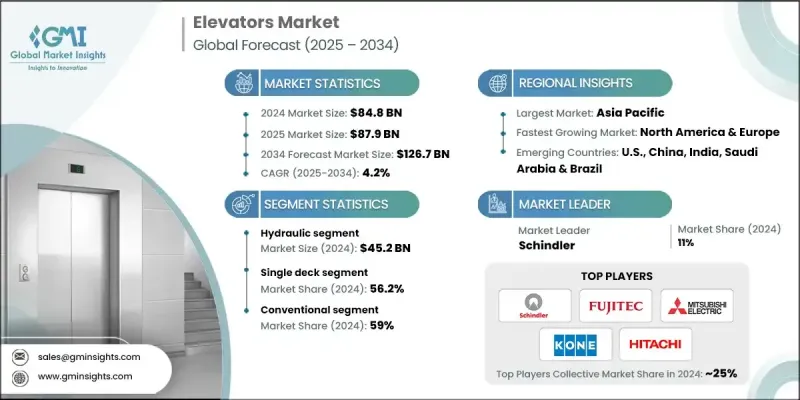
エレベーターの世界市場規模は、2024年に848億米ドルとなり、CAGR 4.2%で成長し、2034年には1,267億米ドルに達すると予測されています。
この成長の原動力となっているのは、世界的なインフラ整備の拡大と都市の近代化です。商業ビルと住宅用高層ビルの両方で効率的な垂直移動ソリューションに対する需要が高まっていることが、市場の成長を加速させています。都市開発当局は、スマートシティ構想や大規模なインフラ・プロジェクトに投資しており、これらのプロジェクトでは高度なエレベーター・システムが必要とされることが多いです。ビルの改修も大きく貢献しており、不動産所有者は老朽化したシステムをより新しくスマートな技術にアップグレードして、最新の建築基準法に適合させ、運用性能を向上させています。IoT、AIを活用した予知保全、目的地配車システムと統合されたスマートエレベーターの出現は、垂直輸送の未来を形成しています。これらのシステムは、適応アルゴリズム、リアルタイムモニタリング、近代化されたインターフェースを通じて、安全性、エネルギー効率、利用者の快適性を向上させる。同市場はまた、既存の建物に高度なエレベーター技術を導入して機能性を高め、耐用年数を延長する改修プロジェクトからの需要も持続しています。
| 市場範囲 | |
|---|---|
| 開始年 | 2024 |
| 予測年 | 2025-2034 |
| 市場規模 | 848億米ドル |
| 予測金額 | 1,267億米ドル |
| CAGR | 4.2% |
油圧エレベーター分野は、2024年に452億米ドルを生み出し、2025年から2034年にかけてCAGR 3.4%で成長すると予測されています。油圧システムは、低層から中層の建物で実用的であることから、人気が続いています。これらのシステムは、トラクションエレベーターと比較して、初期費用が低く、コンパクトなスペースへの統合が容易で、メンテナンスの必要性が少ないことが評価されています。環境に優しい流体やより効率的な機構など、持続可能な油圧技術における最近の技術革新は、環境コンプライアンスと運転性能を向上させており、スペースが重視され、予算が限られているプロジェクトで好まれる選択肢となっています。
シングルデッキ・セグメントは2024年に56.2%のシェアを占め、2034年までのCAGRは3.9%と予想されています。この優位性は、住宅、中層商業ビル、近代化プロジェクトで広く使用されていることに起因しています。シングルデッキのエレベーターはデザインがシンプルで、価格も手頃、メンテナンスも容易であるため、幅広い建築レイアウトに適合します。シンプルな設置工程と低い構造要件により、新規開発および改修の両方に適したソリューションとなっています。
米国エレベーター市場は2024年に130億米ドルを生み出し、2025年から2034年にかけてCAGR 2.9%で成長すると予測されています。同国の優位性は、老朽化したインフラの近代化を目的とした改修プロジェクトとともに、商業および住宅建設の強力なパイプラインによって後押しされています。グリーンビルディング、スマート都市計画、高層ビル拡張への継続的な取り組みが、次世代エレベーターシステムへの需要を高めています。三菱電機、日立製作所、TKエレベーター、KONE、シンドラーといった業界リーダーの存在と、安全性とエネルギー効率に焦点を当てた有利な規制が、米国市場の主導的地位を強化しています。
エレベーターの世界市場における主要企業は、東芝、現代エレベーター、TKエレベーター、三菱電機、フジテック、日立製作所、エレクトラエレベーター、シンドラー、キャニーエレベーター、シグマエレベーター、アリトコ、エスコンエレベーター、シューマッハエレベーター、KONE、EMAKなどです。世界のエレベーター市場で事業を展開する企業は、研究開発への継続的な投資や、AI、IoT、エネルギー効率の高いコンポーネントなどの先進技術の統合を通じて、その地位を強化しています。多くのメーカーは、性能の向上とダウンタイムの削減を目的に、予知保全システムやデジタル制御インターフェースを備えたスマートエレベーターの開発に重点を移しています。建設会社、不動産開発業者、インフラプロジェクトに携わる政府機関との戦略的パートナーシップも、市場シェア拡大の鍵となります。大手ブランドは、既存の建物に合わせたアップグレード・ソリューションを提供するレトロフィットの機会にますます注目しています。
よくあるご質問
目次
第1章 調査手法と範囲
第2章 エグゼクティブサマリー
第3章 業界考察
- エコシステム分析
- サプライヤーの情勢
- 利益率
- 各段階における付加価値
- バリューチェーンに影響を与える要因
- 業界への影響要因
- 促進要因
- スマートシティとインフラ開発
- 老朽インフラの近代化
- 革新的技術の開発とスマート化需要の高まりエレベーター
- 業界の潜在的リスク&課題
- 高い初期投資コスト
- 厳しい安全規制
- 促進要因
- 成長可能性分析
- 今後の市場動向
- 技術革新の状況
- 現在の技術動向
- 新興技術
- 価格動向
- 地域別
- 製品別
- 規制情勢
- 規格とコンプライアンス要件
- 地域規制の枠組み
- 認証基準
- 貿易統計
- 主要輸入国
- 主要輸出国
- ポーター分析
- PESTEL分析
第4章 競合情勢
- イントロダクション
- 企業の市場シェア分析
- 地域別
- 北米
- 欧州
- アジア太平洋地域
- ラテンアメリカ
- 中東・アフリカ
- 地域別
- 企業マトリックス分析
- 主要市場企業の競合分析
- 競合ポジショニングマトリックス
- 主な発展
- 合併・買収
- パートナーシップ
- 新製品発表
- 拡張計画
第5章 市場推計・予測:製品別、2021-2034
- 主要動向
- 油圧
- トラクション
- マシンルームレス牽引
第6章 市場推計・予測デッキタイプ別、2021-2034
- 主要動向
- シングルデッキ
- ダブルデッキ
第7章 市場推計・予測建物高さ別、2021-2034
- 主要動向
- 低層
- 中層
- 高層
第8章 市場推計・予測速度別、2021-2034
- 主要動向
- 1m/s未満
- 1m/s以上3m/s未満
- 4m/s以上6m/s未満
- 7m/s以上10m/s未満
- 10m/s以上
第9章 市場推計・予測デスティネーションコントロール別、2021-2034
- 主要動向
- スマート
- 従来型
第10章 市場推計・予測事業別、2021-2034
- 主要動向
- 新規設備
- メンテナンス
- 近代化
第11章 市場推計・予測:用途別、2021-2034
- 主要動向
- 旅客
- 貨物
第12章 市場推計・予測:最終用途別、2021-2034
- 主要動向
- 住宅用
- ホームリフト
- その他
- 産業用
- 商業用
- オフィス
- ホテル
- ヘルスケア
- その他(ショッピングモール)
第13章 市場推計・予測:地域別、2021-2034
- 主要動向
- 北米
- 米国
- カナダ
- 欧州
- ドイツ
- 英国
- フランス
- イタリア
- スペイン
- アジア太平洋地域
- 中国
- インド
- 日本
- 韓国
- オーストラリア
- インドネシア
- マレーシア
- ラテンアメリカ
- ブラジル
- メキシコ
- アルゼンチン
- 中東・アフリカ
- サウジアラビア
- アラブ首長国連邦
- 南アフリカ
第14章 企業プロファイル
- Aritco
- Canny Elevator
- Electra Elevators
- EMAK
- ESCON Elevators
- Fujitec
- Hitachi
- Hyundai Elevator
- KONE
- Mitsubishi Electric
- Schindler
- Schumacher Elevator
- Sigma Elevator
- TK Elevator
- Toshiba
