
食品不耐症製品の市場機会、成長促進要因、産業動向分析、2025年~2034年予測
Food Intolerance Products Market Opportunity, Growth Drivers, Industry Trend Analysis, and Forecast 2025 - 2034- 発行日
- ページ情報
- 英文 235 Pages
- 納期
- 2~3営業日
- 商品コード
- 1773463
- カスタマイズ可能 お客様のご希望に応じて、既存データの加工や未掲載情報(例:国別セグメント)の追加などの対応が可能です。詳細はお問い合わせください。
- 翻訳ツール提供対象 PDF対応AI翻訳ツールの無料貸し出しサービスのご利用が可能です
概要
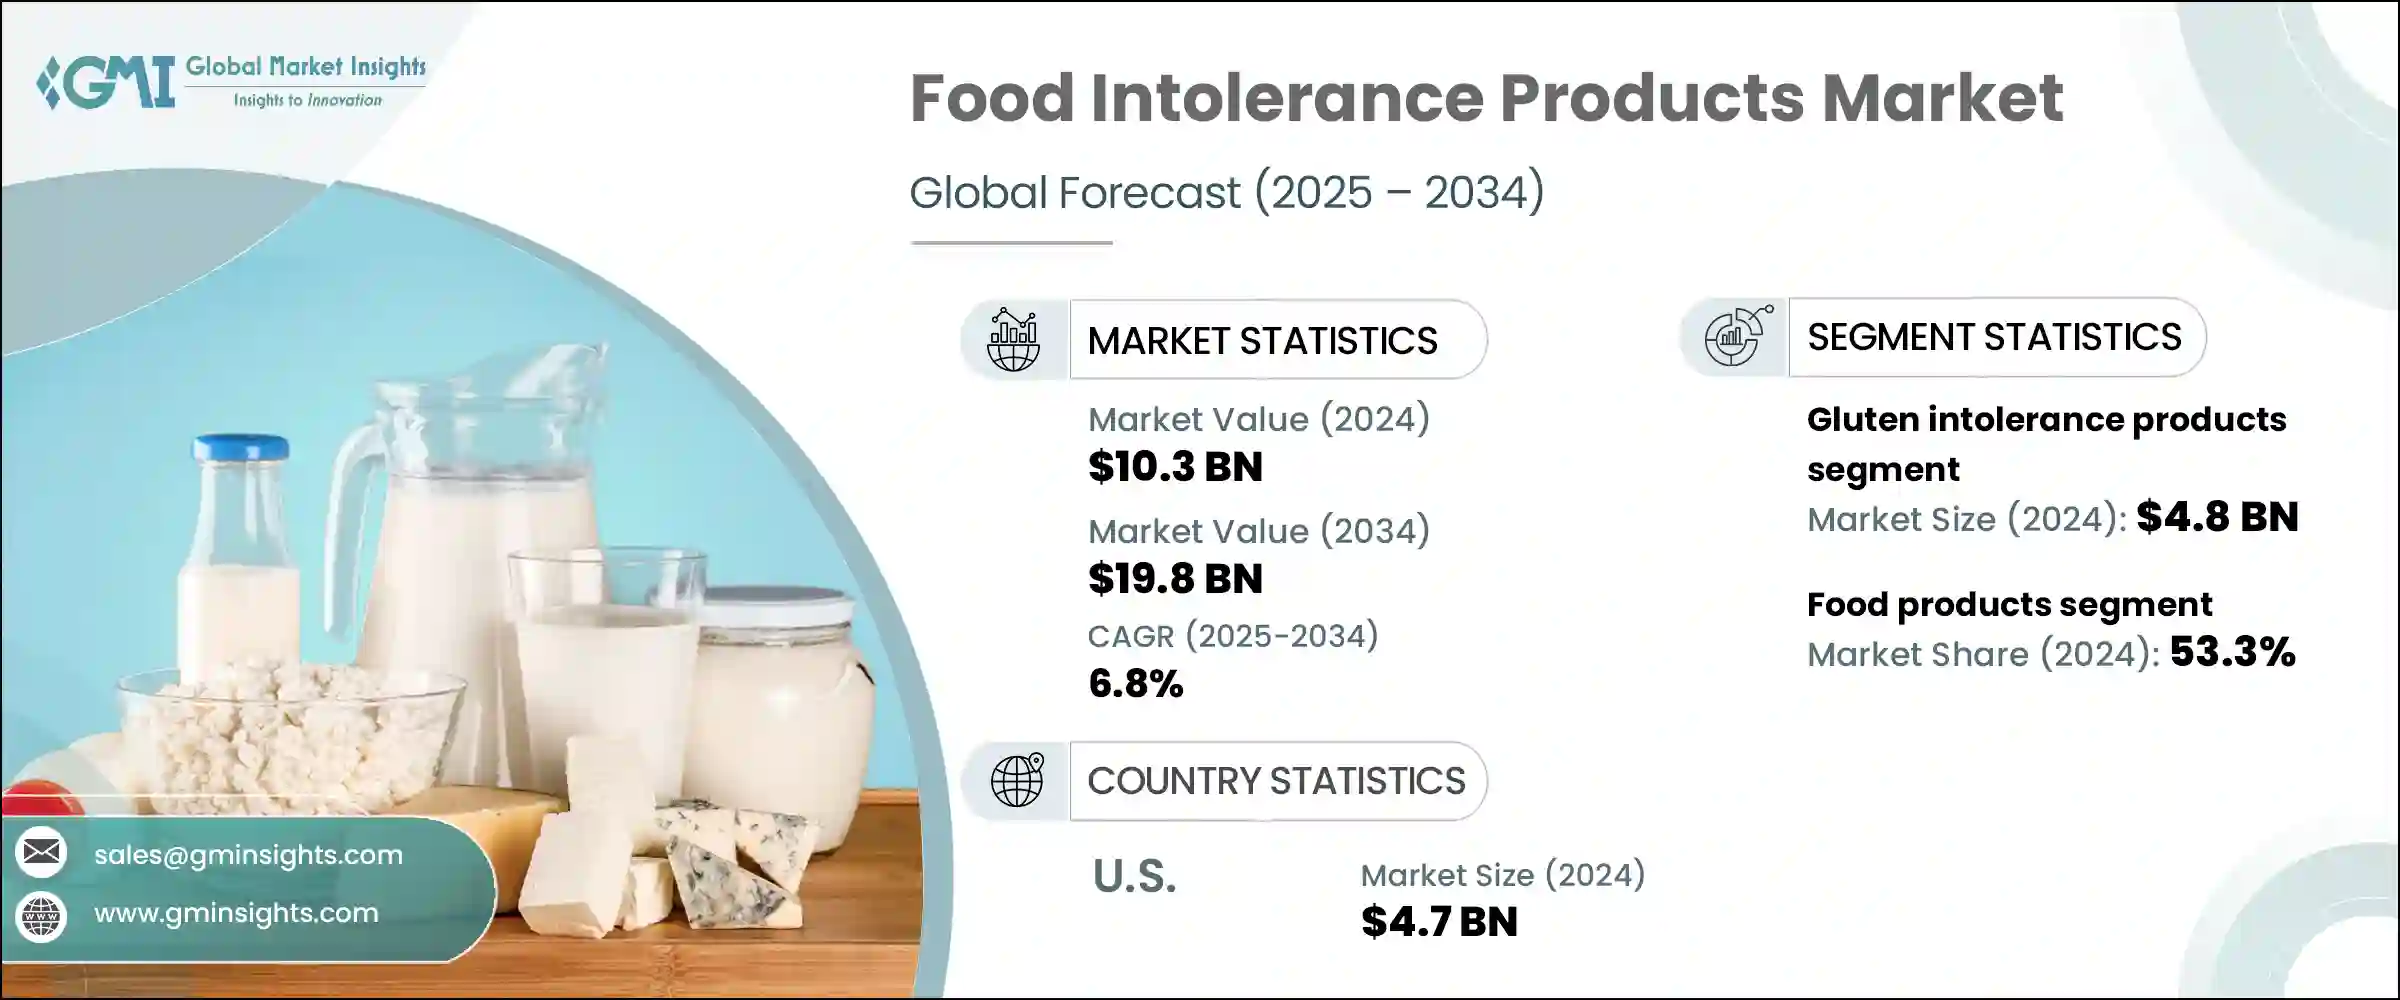
世界の食品不耐症製品市場は、2024年には103億米ドルと評価され、CAGR 6.8%で成長し、2034年には198億米ドルに達すると推定されています。
この市場は、食品過敏症に対する消費者の意識の高まりと、個別化された栄養に対する幅広い需要に後押しされ、一貫した成長を遂げています。診断ツールが改善され、食事の嗜好が進化するにつれて、グルテン、乳糖、FODMAP関連問題など特定の不耐性に合わせた製品を求める消費者が増えています。クリーンラベル、アレルゲンフリー、機能性食品へのシフトは、特に健康志向の買物客が、誘因となる原材料を避けるだけでなく、ウェルネスの動向にも沿った商品を求めるようになり、決定的な要因になりつつあります。こうした製品は今や、より大きな健康食カテゴリーの重要な一部となっています。
市場価値の大部分は、シリアル、代用乳製品、スナック製品、焼き菓子など、小売・外食両部門からの強い需要を享受している目に見える食品アイテムからもたらされています。同時に、まだ小さい分野ではありますが、サプリメントや消化器サポート補助食品は、より複雑な食品過敏症を管理する消費者から引き続き注目されています。これらの分野では、消化を改善し、あまり知られていない不耐症や多面的な不耐症を持つ個人を救済することに焦点を当てた製品の発売が増加しています。
| 市場範囲 | |
|---|---|
| 開始年 | 2024年 |
| 予測年 | 2025~2034年 |
| 開始金額 | 103億米ドル |
| 予測金額 | 198億米ドル |
| CAGR | 6.8% |
2024年のグルテン不耐性製品分野の市場規模は48億米ドルで、2025年から2034年にかけてCAGR 6.6%で成長すると予測されます。グルテン関連疾患に対する認識と診断が高まり、グルテンフリー食をライフスタイルに取り入れるようになったため、この分野が優位を占めています。この分野では、特にグルテンフリーのスナック、ベーカリー製品、調理済み食品の味、食感、栄養成分の改善を中心に技術革新の波が押し寄せており、消費者の長期的な関心とブランド・ロイヤルティを牽引しています。
食品不耐症製品市場の食品セグメントは、2024年に54億米ドルを生み出し、2034年までCAGR 7%を維持し、53.3%のシェアを占めると予想されます。この分野は、食品過敏症に対する意識の高まりと、セリアック病や乳糖不耐症のような食餌性疾患の有病率の増加により、成長を続けています。各ブランドは、植物由来の代替乳製品、グルテンフリーのスナック、一般的な刺激物を含まない焼き菓子など、アレルゲンに配慮した製品ラインを積極的に拡大しています。各社が健康ニーズと味覚嗜好の両方を満たす食品の開発に乗り出しているため、需要と入手可能な選択肢のギャップは徐々に縮まっています。
米国の食品不耐症製品市場は、2024年に47億米ドルと評価され、2025年から2034年にかけてCAGR 6.9%で成長すると予測されています。この著しい成長は、消費者教育の高まり、健康志向の食習慣、食品過敏症を特定する個人の増加によって推進されています。米国の消費者は食生活をより選択するようになっており、企業は製品の多様化とイノベーションに投資するようになっています。その結果、生産者は特定の栄養需要に対応しなければならなくなり、その結果、対象とする食品不耐症製品が全米でより幅広く提供されるようになりました。
食品不耐症製品業界で事業を展開している主要企業には、Lifeway Foods, Inc.、McNeil Consumer Healthcare Lactaid、General Mills, Inc.、Danone S.A.、Nestle S.A.などがあり、これらのブランドはこのダイナミックな市場での足跡拡大に積極的に取り組んでいます。食物不耐症分野の主要企業は、その存在感を確固たるものにするため、さまざまな戦略を駆使しています。新たな不耐症に対応するために製品ポートフォリオを拡大し、アレルゲンフリー食品の味と食感を改善するために研究開発に投資し、信頼性を高めるために栄養士やヘルスケア専門家と協力関係を結んでいます。企業はまた、クリーン・ラベルの慣行を採用し、デジタル・プラットフォームを活用して健康意識の高い消費者にアピールしています。多くの企業は、進化する消費者の需要に応えるため、ニッチ・ブランドを買収し、特化した製品ラインを立ち上げると同時に、eコマースや小売店の棚での存在感を高め、リーチと認知度を最大化しています。
目次
第1章 調査手法と範囲
第2章 エグゼクティブサマリー
第3章 業界考察
- エコシステム分析
- サプライヤーの情勢
- 利益率
- 各段階での付加価値
- バリューチェーンに影響を与える要因
- ディスラプション
- 業界への影響要因
- 促進要因
- 食物不耐症とアレルギーの増加
- 認知度と診断率の向上
- フリーフロム製品の需要増加
- 製品の入手可能性と多様性の拡大
- 業界の潜在的リスク&課題
- 特産品のプレミアム価格設定
- 配合と味の課題
- 市場機会
- 促進要因
- 成長可能性分析
- 規制情勢
- 北米
- 欧州
- アジア太平洋地域
- ラテンアメリカ
- 中東・アフリカ
- ポーター分析
- PESTEL分析
- 価格動向
- 将来の市場動向
- テクノロジーとイノベーションの情勢
- 現在の技術動向
- 新興技術
- 特許情勢
- 貿易統計(HSコード)(注:貿易統計は主要国のみ提供されます)
- 主要輸入国
- 主要輸出国
- 持続可能性と環境側面
- 持続可能な慣行
- 廃棄物削減戦略
- 生産におけるエネルギー効率
- 環境に優しい取り組み
第4章 競合情勢
- イントロダクション
- 企業の市場シェア分析
- 地域別
- 北米
- 欧州
- アジア太平洋地域
- ラテンアメリカ
- 中東・アフリカ
- 地域別
- 企業マトリックス分析
- 主要市場企業の競合分析
- 競合ポジショニングマトリックス
- 主な発展
- 合併と買収
- パートナーシップとコラボレーション
- 新製品の発売
- 拡張計画
第5章 市場推計・予測:不耐性タイプ別、2021~2034年
- 主要動向
- 乳糖不耐症製品
- グルテン不耐性製品
- FODMAP不耐性製品
- ヒスタミン不耐症製品
- 亜硫酸塩不耐性製品
- その他の不耐性製品
第6章 市場推計・予測:商品カテゴリー別、2021~2034年
- 主要動向
- 食品
- ベーカリー製品およびシリアル製品
- パンと焼き菓子
- 朝食用シリアルとグラノーラ
- クッキーとクラッカー
- その他のベーカリー製品
- 乳製品の代替品
- 牛乳代替品
- チーズの代替品
- ヨーグルトの代替品
- アイスクリームとデザートの代替品
- その他の乳製品代替品
- スナックとコンビニ食品
- チップスと軽食
- 栄養バーとプロテインバー
- 調理済み食品
- その他のスナック製品
- 調味料、ドレッシング、ソース
- 菓子類・デザート
- ベビーフードと乳児用調合粉ミルク
- その他の食品
- ベーカリー製品およびシリアル製品
- 飲料品
- 植物性ミルク
- フルーツ&野菜ジュース
- 機能性飲料
- その他の飲料
- サプリメントと消化促進剤
- 消化酵素
- プロバイオティクスとプレバイオティクス
- その他のサプリメント
第7章 市場推計・予測:流通チャネル別、2021~2034年
- 主要動向
- スーパーマーケットとハイパーマーケット
- 専門店・健康食品店
- コンビニエンスストア
- オンライン小売
- eコマースプラットフォーム
- 消費者直販ウェブサイト
- サブスクリプションサービス
- 薬局・ドラッグストア
- フードサービス&HoReCa
- その他
第8章 市場推計・予測:地域別、2021~2034年
- 主要動向
- 北米
- 米国
- カナダ
- 欧州
- 英国
- ドイツ
- フランス
- イタリア
- スペイン
- オランダ
- その他欧州地域
- アジア太平洋地域
- 中国
- インド
- 日本
- 韓国
- オーストラリア
- その他アジア太平洋地域
- ラテンアメリカ
- ブラジル
- メキシコ
- アルゼンチン
- その他ラテンアメリカ地域
- 中東・アフリカ
- 南アフリカ
- サウジアラビア
- アラブ首長国連邦
- その他中東・アフリカ地域
第9章 企業プロファイル
- Alpro
- Amy's Kitchen, Inc.
- Conagra Brands, Inc.
- Daiya Foods Inc.
- Danone S.A.
- Dr. Schar AG/SPA
- Enjoy Life Foods(Mondelez International)
- Follow Your Heart
- Fody Food Co.
- General Mills, Inc.
- Glutino(The Glutino Food Group)
- Kellogg Company
- Lactaid(McNeil Nutritionals, LLC)
- Mondelez International, Inc.
- Nestle S.A.
- Oatly Group AB
- The Hain Celestial Group, Inc.
- The Kraft Heinz Company
- The Lactalis Group
- Udis Gluten Free(Boulder Brands, Inc.)
目次
The Global Food Intolerance Products Market was valued at USD 10.3 billion in 2024 and is estimated to grow at a CAGR of 6.8% to reach USD 19.8 billion by 2034. This market has been experiencing consistent growth, fueled by increased consumer awareness of food sensitivities and a broader demand for personalized nutrition. As diagnostic tools improve and dietary preferences evolve, more consumers are turning to products tailored to specific intolerances, such as gluten, lactose, and FODMAP-related issues. The shift toward clean-label, allergen-free, and functional food is becoming a defining factor, especially as health-conscious shoppers look for items that not only avoid triggering ingredients but also align with wellness trends. These products have now become a vital part of the larger healthy eating category.
Most of the market's value still comes from tangible food items such as cereals, dairy substitutes, snack products, and baked goods, which enjoy strong demand from both retail and food service sectors. At the same time, although still a smaller segment, supplements and digestive support aids continue to gain attention from consumers managing more complex food sensitivities. These segments are witnessing increased product launches focused on improving digestion and offering relief for individuals with lesser-known or multi-faceted intolerances.
| Market Scope | |
|---|---|
| Start Year | 2024 |
| Forecast Year | 2025-2034 |
| Start Value | $10.3 Billion |
| Forecast Value | $19.8 Billion |
| CAGR | 6.8% |
In 2024, the gluten intolerance products segment was valued at USD 4.8 billion and is forecasted to grow at a CAGR of 6.6% between 2025 and 2034. This segment dominates because of the growing awareness and diagnosis of gluten-related disorders and the lifestyle adoption of gluten-free diets. There's been a wave of innovation in this space, particularly around improving taste, texture, and nutritional content in gluten-free snacks, bakery items, and ready-to-eat meals, driving long-term consumer interest and brand loyalty.
The food products segment in the food intolerance products market generated USD 5.4 billion in 2024 and is expected to maintain a 7% CAGR through 2034, accounting for a 53.3% share. This segment continues to thrive due to rising food sensitivity awareness and the increasing prevalence of dietary conditions like celiac disease and lactose intolerance. Brands are aggressively expanding their lines with allergen-conscious offerings, such as plant-based dairy alternatives, gluten-free snacks, and baked goods formulated without common irritants. The gap between demand and available options is gradually narrowing as companies step up to develop foods that meet both health needs and taste preferences.
United States Food Intolerance Products Market was valued at USD 4.7 billion in 2024 and is set to grow at a CAGR of 6.9% from 2025 to 2034. This significant growth is propelled by heightened consumer education, health-focused eating habits, and an increasing number of individuals identifying food sensitivities. American consumers are becoming more selective in their dietary choices, encouraging companies to invest in product diversification and innovation. As a result, producers must cater to specific nutritional demands, which has led to a broader offering of targeted food intolerance products throughout the country.
The leading companies operating in the Food Intolerance Products Industry include Lifeway Foods, Inc., McNeil Consumer Healthcare Lactaid, General Mills, Inc., Danone S.A., and Nestle S.A. These brands are actively engaged in expanding their footprint in this dynamic market. To solidify their presence, key players in the food intolerance space are using a mix of targeted strategies. They are expanding their product portfolios to cater to emerging intolerances, investing in R&D to improve the taste and texture of allergen-free foods, and forming collaborations with dieticians and healthcare professionals to enhance credibility. Companies are also adopting clean-label practices and leveraging digital platforms to engage with health-conscious audiences. Many are acquiring niche brands and launching specialized product lines to cater to evolving consumer demands, while also increasing their presence in e-commerce and retail shelves to maximize reach and visibility.
Table of Contents
Chapter 1 Methodology & Scope
- 1.1 Market scope and definition
- 1.2 Research design
- 1.2.1 Research approach
- 1.2.2 Data collection methods
- 1.3 Data mining sources
- 1.3.1 Global
- 1.3.2 Regional/Country
- 1.4 Base estimates and calculations
- 1.4.1 Base year calculation
- 1.4.2 Key trends for market estimation
- 1.5 Primary research and validation
- 1.5.1 Primary sources
- 1.6 Forecast model
- 1.7 Research assumptions and limitations
Chapter 2 Executive Summary
- 2.1 Industry 3600 synopsis
- 2.2 Key market trends
- 2.3 TAM analysis, 2025-2034
- 2.4 CXO perspectives: strategic imperatives
- 2.5 Executive decision points
- 2.6 Critical success factors
- 2.7 Future outlook and strategic recommendations
Chapter 3 Industry Insights
- 3.1 Industry ecosystem analysis
- 3.1.1 Supplier landscape
- 3.1.2 Profit margin
- 3.1.3 Value addition at each stage
- 3.1.4 Factor affecting the value chain
- 3.1.5 Disruptions
- 3.2 Industry impact forces
- 3.2.1 Growth drivers
- 3.2.1.1 Rising prevalence of food intolerances & allergies
- 3.2.1.2 Growing awareness & diagnosis rates
- 3.2.1.3 Increasing demand for free-from products
- 3.2.1.4 Expanding product availability & variety
- 3.2.2 Industry pitfalls and challenges
- 3.2.2.1 Premium pricing of specialty products
- 3.2.2.2 Formulation & taste challenges
- 3.2.3 Market opportunities
- 3.2.1 Growth drivers
- 3.3 Growth potential analysis
- 3.4 Regulatory landscape
- 3.4.1 North America
- 3.4.2 Europe
- 3.4.3 Asia pacific
- 3.4.4 Latin America
- 3.4.5 Middle east & Africa
- 3.5 Porter's analysis
- 3.6 Pestel analysis
- 3.7 Price trends
- 3.8 Future market trends
- 3.9 Technology and innovation landscape
- 3.9.1 Current technological trends
- 3.9.2 Emerging technologies
- 3.10 Patent landscape
- 3.11 Trade statistics (HS code) (Note: the trade statistics will be provided for key countries only)
- 3.11.1 Major importing countries
- 3.11.2 Major exporting countries
- 3.12 Sustainability and environmental aspects
- 3.12.1 Sustainable practices
- 3.12.2 Waste reduction strategies
- 3.12.3 Energy efficiency in production
- 3.12.4 Eco-friendly initiatives
Chapter 4 Competitive Landscape, 2024
- 4.1 Introduction
- 4.2 Company market share analysis
- 4.2.1 By region
- 4.2.1.1 North America
- 4.2.1.2 Europe
- 4.2.1.3 Asia Pacific
- 4.2.1.4 LATAM
- 4.2.1.5 MEA
- 4.2.1 By region
- 4.3 Company matrix analysis
- 4.4 Competitive analysis of major market players
- 4.5 Competitive positioning matrix
- 4.6 Key developments
- 4.6.1 Mergers & acquisitions
- 4.6.2 Partnerships & collaborations
- 4.6.3 New Product Launches
- 4.6.4 Expansion plans
Chapter 5 Market Estimates & Forecast, By Intolerance Type, 2021-2034 (USD Billion) (Kilo Tons)
- 5.1 Key trends
- 5.2 Lactose intolerance products
- 5.3 Gluten intolerance products
- 5.4 Fodmap intolerance products
- 5.5 Histamine intolerance products
- 5.6 Sulfite intolerance products
- 5.7 Other intolerance products
Chapter 6 Market Estimates & Forecast, By Product Category, 2021-2034 (USD Billion) (Kilo Tons)
- 6.1 Key trends
- 6.2 Food products
- 6.2.1 Bakery & cereal products
- 6.2.1.1 Bread & baked goods
- 6.2.1.2 Breakfast cereals & granola
- 6.2.1.3 Cookies & crackers
- 6.2.1.4 Other bakery products
- 6.2.2 Dairy alternatives
- 6.2.2.1 Milk alternatives
- 6.2.2.2 Cheese alternatives
- 6.2.2.3 Yogurt alternatives
- 6.2.2.4 Ice cream & dessert alternatives
- 6.2.2.5 Other dairy alternatives
- 6.2.3 Snacks & convenience foods
- 6.2.3.1 Chips & savory snacks
- 6.2.3.2 Nutrition & protein bars
- 6.2.3.3 Ready meals & prepared foods
- 6.2.3.4 Other snack products
- 6.2.4 Condiments, dressings & sauces
- 6.2.4.1 Confectionery & desserts
- 6.2.4.2 Baby food & infant formulas
- 6.2.4.3 Other food products
- 6.2.1 Bakery & cereal products
- 6.3 Beverages
- 6.3.1 Plant-based milk
- 6.3.2 Fruit & vegetable juices
- 6.3.3 Functional beverages
- 6.3.4 Other beverages
- 6.4 Supplements & digestive aids
- 6.4.1 Digestive enzymes
- 6.4.2 Probiotics & prebiotics
- 6.4.3 Other supplements
Chapter 7 Market Estimates & Forecast, By Distribution Channel, 2021-2034 (USD Billion) (Kilo Tons)
- 7.1 Key trends
- 7.2 Supermarkets & hypermarkets
- 7.3 Specialty stores & health food stores
- 7.4 Convenience stores
- 7.5 Online retail
- 7.5.1 E-commerce platforms
- 7.5.2 Direct-to-consumer websites
- 7.5.3 Subscription services
- 7.6 Pharmacies & drugstores
- 7.7 Foodservice & HoReCa
- 7.8 Others
Chapter 8 Market Estimates & Forecast, By Region, 2021-2034 (USD Billion) (Kilo Tons)
- 8.1 Key trends
- 8.2 North America
- 8.2.1 U.S.
- 8.2.2 Canada
- 8.3 Europe
- 8.3.1 UK
- 8.3.2 Germany
- 8.3.3 France
- 8.3.4 Italy
- 8.3.5 Spain
- 8.3.6 Netherlands
- 8.3.7 Rest of Europe
- 8.4 Asia Pacific
- 8.4.1 China
- 8.4.2 India
- 8.4.3 Japan
- 8.4.4 South Korea
- 8.4.5 Australia
- 8.4.6 Rest of Asia Pacific
- 8.5 Latin America
- 8.5.1 Brazil
- 8.5.2 Mexico
- 8.5.3 Argentina
- 8.5.4 Rest of Latin America
- 8.6 Middle East and Africa
- 8.6.1 South Africa
- 8.6.2 Saudi Arabia
- 8.6.3 UAE
- 8.6.4 Rest of Middle East and Africa
Chapter 9 Company Profiles
- 9.1 Alpro
- 9.2 Amy's Kitchen, Inc.
- 9.3 Conagra Brands, Inc.
- 9.4 Daiya Foods Inc.
- 9.5 Danone S.A.
- 9.6 Dr. Schar AG/SPA
- 9.7 Enjoy Life Foods (Mondelez International)
- 9.8 Follow Your Heart
- 9.9 Fody Food Co.
- 9.10 General Mills, Inc.
- 9.11 Glutino (The Glutino Food Group)
- 9.12 Kellogg Company
- 9.13 Lactaid (McNeil Nutritionals, LLC)
- 9.14 Mondelez International, Inc.
- 9.15 Nestle S.A.
- 9.16 Oatly Group AB
- 9.17 The Hain Celestial Group, Inc.
- 9.18 The Kraft Heinz Company
- 9.19 The Lactalis Group
- 9.20 Udis Gluten Free (Boulder Brands, Inc.)
- 発行日
- 発行
- Global Market Insights Inc.
- ページ情報
- 英文 235 Pages
- 納期
- 2~3営業日