
|
市場調査レポート
商品コード
1750306
先端光学材料の市場機会、成長促進要因、産業動向分析、2025~2034年予測Advanced Optics Material Market Opportunity, Growth Drivers, Industry Trend Analysis, and Forecast 2025 - 2034 |
||||||
カスタマイズ可能
|
|||||||
| 先端光学材料の市場機会、成長促進要因、産業動向分析、2025~2034年予測 |
|
出版日: 2025年05月13日
発行: Global Market Insights Inc.
ページ情報: 英文 235 Pages
納期: 2~3営業日
|

全表示
- 概要
- 目次
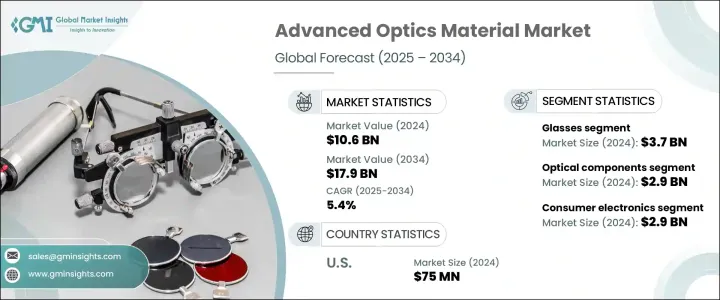
世界の先端光学材料市場は、2024年に106億米ドルと評価され、CAGR 5.4%で成長し、2034年には179億米ドルに達すると予測されています。
AR、VR、LiDAR、デジタル技術の急速な採用が、自動車システム、スマート家電、防衛用途における先端光学部品の重要性を高めています。同様に、低侵襲診断やリアルタイムヘルスモニタリングへの需要の高まりが、ヘルスケア分野での高精度オプティクスの採用を後押ししています。
製造の進歩、特にAI駆動型積層造形およびレーザー支援プロセスによって、カスタム光学部品の実現性と拡張性が高まっています。これらの技術は、生産時間を短縮し、無駄を最小限に抑え、複雑な光学形状に必要な精度を可能にしており、これは航空宇宙、防衛、生物医学画像診断などの分野で特に価値があります。これと並行して、ナノ構造およびメタ光学材料における現在進行中の研究が、多様な用途にわたって、よりコンパクトで軽量かつ効率的な光学ソリューションの進化を後押ししています。これらの次世代材料は、ナノスケールレベルでの曲げ、フィルタリング、集光など、光の挙動に対する前例のない制御を提供し、拡張現実、量子コンピューティング、フォトニックチップにおける革命的な発展への道を開きます。これらの技術革新により、新たな性能ベンチマークが設定され、先端光学のフロンティアが広がっています。
| 市場範囲 | |
|---|---|
| 開始年 | 2024年 |
| 予測年 | 2025~2034年 |
| 開始金額 | 106億米ドル |
| 予測金額 | 179億米ドル |
| CAGR | 5.4% |
材料別では、ガラスが2024年の市場シェア35.3%を占め、評価額は37億米ドルでした。ガラスはその優れた透明性と熱安定性から、高性能レンズや精密光学部品に使用されています。しかし、ポリマーをベースとした代替材料は、費用対効果と軽量性により、家電製品や医療機器に使用されています。耐紫外線性と屈折性能を強化した新しいポリマー組成は、その有用性を拡大しています。さらに、サファイアやニオブ酸リチウムのような特殊材料は、熱耐久性と複屈折特性により、高周波やレーザーベースのシステムで脚光を浴びています。
家電機器セグメントは2024年に29億米ドルを占め、2034年までのCAGRは5.9%と予測されています。スマートグラス、折りたたみディスプレイ、小型高解像度カメラなどの進歩が、多機能でスペース効率の高い光学材料への需要を高めています。ヘルスケア分野では、診断ツール、手術装置、生体適合器具に光学系を統合し、精度と患者の安全性を高めています。防衛や産業セキュリティ分野では、極端な温度にも耐え、高解像度の監視や照準が可能な堅牢な光学部品の需要が高まっています。
米国の先端光学材料市場は7,500万米ドルに達し、CAGR 6.9%で成長すると予想されています。フォトニクス、集積光学、量子技術に対する政府および民間の大規模な投資は、次世代通信およびセンシングアプリケーションにおける窒化シリコンやニオブ酸リチウムのような新素材の使用をさらに促進しています。
この業界の主要企業には、Hoya Corporation、Edmund Optics、CoorsTek、Heraeus Holding、Corning Incorporatedなどがあります。これらの企業は、研究開発投資の拡大、異業種コラボレーションの形成、製造能力の強化に注力しています。材料科学を革新し、新たな技術動向に対応することで、これらの企業は世界のリーダーシップを維持し、伝統的な応用分野や破壊的な応用分野における進化する顧客ニーズに応えることを目指しています。
目次
第1章 調査手法と範囲
第2章 エグゼクティブサマリー
第3章 業界考察
- エコシステム分析
- バリューチェーンに影響を与える要因
- 利益率分析
- ディスラプション
- 将来の展望
- 製造業者
- 販売代理店
- トランプ政権による関税への影響
- 貿易への影響
- 貿易量の混乱
- 報復措置
- 業界への影響
- 供給側の影響(原材料)
- 主要原材料の価格変動
- サプライチェーン構造
- 生産コストへの影響
- 供給側の影響(原材料)
- 需要側の影響(販売価格)
- 最終市場への価格伝達
- 市場シェアの動向
- 消費者の反応パターン
- 影響を受ける主要企業
- 戦略的な業界対応
- サプライチェーンの再構成
- 価格設定と製品戦略
- 政策関与
- 展望と今後の検討事項
- 貿易への影響
- 貿易統計(HSコード)注:上記の貿易統計は主要国についてのみ提供されます
- 主要輸出国、2021~2024年
- 主要輸入国、2021~2024年
- サプライヤーの情勢
- 利益率分析
- 主なニュースと取り組み
- 規制情勢
- 影響要因
- 促進要因
- 高性能光学部品の需要増加
- フォトニクスと量子光学の進歩
- 通信における用途の増加
- ヘルスケアおよび医療機器の採用増加
- 業界の潜在的リスク・課題
- 高い生産コスト
- 原材料供給
- 規制上の課題
- 促進要因
- 市場機会
- 拡張現実と仮想現実における新たな応用
- 高度センシング技術に対する需要の高まり
- 自動運転システムの拡大
- 生体模倣光学材料の開発
- 成長可能性分析
- 規制枠組み分析
- REACHおよびROHS規制
- 輸出管理規制
- 環境コンプライアンス要件
- 取り扱いと処理に関する安全基準
- 技術の情勢
- 現在の技術動向
- 新興技術
- 研究開発イニシアチブとイノベーションパイプライン
- 特許分析
- ポーター分析
- PESTEL分析
第4章 競合情勢
- イントロダクション
- 市場シェア分析
- メーカー別世界市場シェア
- メーカー別地域市場シェア
- 競合ベンチマーキング
- 製品ポートフォリオの比較
- 技術力の比較
- 研究開発投資の比較
- 製造能力の比較
- 戦略的取り組みと開発
- 合併と買収
- パートナーシップとコラボレーション
- 製品の発売とイノベーション
- 拡張計画
- 競合ポジショニングマトリックス
- 戦略的ダッシュボード
第5章 市場推計・予測:材料別、2021~2034年
- 主要動向
- ガラス材料
- 光学ガラス
- 溶融シリカ
- ホウケイ酸ガラス
- 特殊ガラス
- その他
- 高分子材料
- ポリメチルメタクリレート(PMMA)
- ポリカーボネート(PC)
- 環状オレフィンポリマー(COP)
- 環状オレフィンコポリマー(COC)
- その他
- 結晶材料
- サファイア
- シリコン
- ゲルマニウム
- セレン化亜鉛
- フッ化カルシウム
- その他
- セラミック材料
- 透明セラミック
- アルミニウムオキシナイトライド(ALON)
- マグネシウムアルミネートスピネル
- イットリウムアルミニウムガーネット(YAG)
- その他
- 金属材料
- アルミニウム
- 銀
- 金
- その他
- 先進複合材料
- フォトニック結晶
- メタマテリアル
- ナノマテリアル
- その他
第6章 市場推計・予測:用途別、2021~2034年
- 主要動向
- 光学部品
- レンズ
- ミラー
- プリズム
- ウィンドウ
- フィルター
- 回折格子
- その他
- 光電子デバイス
- 発光ダイオード(LED)
- レーザーダイオード
- 光検出器
- 太陽電池
- 光変調器
- その他
- 画像システム
- カメラ
- 顕微鏡
- 望遠鏡
- 熱画像
- その他
- 光通信
- 光ファイバー
- 導波管
- 光増幅器
- 光スイッチ
- その他
- センシングと計測
- 光学センサー
- 分光法
- 干渉法
- その他
- ディスプレイ技術
- LCDディスプレイ
- OLEDディスプレイ
- AR/VRディスプレイ
- その他
- その他
第7章 市場推計・予測:最終用途産業別、2021~2034年
- 主要動向
- 家電
- スマートフォン
- カメラ
- ウェアラブルデバイス
- その他
- ヘルスケア・医療
- 診断機器
- 外科用機器
- 治療システム
- 医療画像
- その他
- 防衛・安全保障
- 暗視装置
- 照準システム
- 監視
- その他
- 通信
- 光ネットワーク
- データセンター
- 5Gインフラ
- その他
- 自動車
- 照明システム
- ヘッドアップディスプレイ
- Lidarシステム
- 運転支援システム
- その他
- 航空宇宙
- 航空電子機器
- ナビゲーションシステム
- 衛星コンポーネント
- その他
- 産業
- マシンビジョン
- レーザー加工
- 品質管理
- その他
- エネルギー
- 太陽エネルギー
- 太陽光発電
- その他
- 研究開発
- その他
第8章 市場推計・予測:地域別、2021~2034年
- 主要動向
- 北米
- 米国
- カナダ
- 欧州
- 英国
- ドイツ
- フランス
- イタリア
- スペイン
- その他欧州地域
- アジア太平洋地域
- 中国
- インド
- 日本
- 韓国
- オーストラリア
- その他アジア太平洋地域
- ラテンアメリカ
- ブラジル
- メキシコ
- アルゼンチン
- その他ラテンアメリカ地域
- 中東・アフリカ
- 南アフリカ
- サウジアラビア
- アラブ首長国連邦
- その他中東・アフリカ地域
第9章 企業プロファイル
- CoorsTek
- Corning Incorporated
- Edmund Optics
- Heraeus Holding
- Hoya Corporation
- II-VI Incorporated
- Materion Corporation
- Newport Corporation
- Nikon Corporation
- Ohara Corporation
- SCHOTT
- Sumitomo Electric Industries
- Surmet Corporation
- Thorlabs
- ZEISS Group
The Global Advanced Optics Material Market was valued at USD 10.6 billion in 2024 and is estimated to grow at a CAGR of 5.4% to reach USD 17.9 billion by 2034, driven by the increasing demand for precise, high-performance optical components across multiple industries. Rapid adoption of AR, VR, LiDAR, and digital technologies elevates the importance of advanced optics in automotive systems, smart consumer electronics, and defense applications. Similarly, the growing reliance on minimally invasive diagnostics and real-time health monitoring is boosting the adoption of precision optics in the healthcare sector.
Advancements in manufacturing, particularly through AI-driven additive and laser-assisted processes, are making custom optical parts more feasible and scalable. These technologies are reducing production time, minimizing waste, and enabling the precision required for intricate optical geometries, which is especially valuable in fields like aerospace, defense, and biomedical imaging. In parallel, ongoing research in nanostructured and meta-optical materials drives the evolution of more compact, lightweight, and efficient optical solutions across diverse applications. These next-generation materials offer unprecedented control over light behavior, such as bending, filtering, or focusing at nanoscale levels, paving the way for revolutionary developments in augmented reality, quantum computing, and photonic chips. Together, these innovations are setting new performance benchmarks and expanding the frontier of advanced optics.
| Market Scope | |
|---|---|
| Start Year | 2024 |
| Forecast Year | 2025-2034 |
| Start Value | $10.6 Billion |
| Forecast Value | $17.9 Billion |
| CAGR | 5.4% |
In terms of material, glass held 35.3% market share in 2024 with a valuation of USD 3.7 billion. Glass is favored for its superior clarity and heat stability in high-performance lenses and precision optics. However, polymer-based alternatives gain ground in consumer electronics and medical instruments due to their cost-effectiveness and lightweight properties. Newer polymer compositions with enhanced UV resistance and refractive performance expand their utility. Additionally, specialty materials such as sapphire and lithium niobate are gaining prominence in high-frequency and laser-based systems due to their thermal durability and birefringence characteristics.
The consumer electronics segment accounted for USD 2.9 billion in 2024, with a projected CAGR of 5.9% through 2034. Advancements in smart glasses, foldable displays, and compact, high-resolution cameras fuel demand for multifunctional and space-efficient optical materials. The healthcare sector integrates optics into diagnostic tools, surgical devices, and biocompatible instruments, enhancing precision and patient safety. In defense and industrial security, rugged optics that can withstand extreme temperatures and deliver high-resolution surveillance and targeting are seeing rising demand.
United States Advanced Optics Material Market reached USD 75 million and is expected to grow at a 6.9% CAGR, underpinned by a concentration of aerospace, defense, and tech development activities across the region. Substantial government and private investment in photonics, integrated optics, and quantum technologies is further propelling the use of novel materials like silicon nitride and lithium niobate in next-gen communication and sensing applications.
Leading companies in this industry include Hoya Corporation, Edmund Optics, CoorsTek, Heraeus Holding, and Corning Incorporated. These players focus on expanding R&D investments, forming cross-industry collaborations, and strengthening their manufacturing capabilities. By innovating in material science and aligning with emerging tech trends, these companies aim to maintain their global leadership and meet evolving customer needs in traditional and disruptive application areas.
Table of Contents
Chapter 1 Methodology & Scope
- 1.1 Market scope & definitions
- 1.2 Base estimates & calculations
- 1.3 Forecast calculations
- 1.4 Data sources
- 1.4.1 Primary
- 1.4.2 Secondary
- 1.4.2.1 Paid sources
- 1.4.2.2 Public sources
Chapter 2 Executive Summary
- 2.1 Industry synopsis, 2021-2034
Chapter 3 Industry Insights
- 3.1 Industry ecosystem analysis
- 3.1.1 Factor affecting the value chain
- 3.1.2 Profit margin analysis
- 3.1.3 Disruptions
- 3.1.4 Future outlook
- 3.1.5 Manufacturers
- 3.1.6 Distributors
- 3.2 Trump administration tariffs
- 3.2.1 Impact on trade
- 3.2.1.1 Trade volume disruptions
- 3.2.1.2 Retaliatory measures
- 3.2.2 Impact on the industry
- 3.2.2.1 Supply-side impact (raw materials)
- 3.2.2.1.1 Price volatility in key materials
- 3.2.2.1.2 Supply chain structure
- 3.2.2.1.3 Production cost implications
- 3.2.2.1 Supply-side impact (raw materials)
- 3.2.3 Demand-side impact (selling price)
- 3.2.3.1 Price transmission to end markets
- 3.2.3.2 Market share dynamics
- 3.2.3.3 Consumer response patterns
- 3.2.4 Key companies impacted
- 3.2.5 Strategic industry responses
- 3.2.5.1 Supply chain reconfiguration
- 3.2.5.2 Pricing and product strategies
- 3.2.5.3 Policy engagement
- 3.2.6 Outlook and future considerations
- 3.2.1 Impact on trade
- 3.3 Trade statistics (HS code) Note: the above trade statistics will be provided for key countries only.
- 3.3.1 Major exporting countries, 2021-2024 (kilo tons)
- 3.3.2 Major importing countries, 2021-2024 (kilo tons)
- 3.4 Supplier landscape
- 3.5 Profit margin analysis
- 3.6 Key news & initiatives
- 3.7 Regulatory landscape
- 3.8 Impact forces
- 3.8.1 Growth drivers
- 3.8.1.1 Growing demand for high-performance optical components
- 3.8.1.2 Advancements in photonics and quantum optics
- 3.8.1.3 Increasing applications in telecommunication
- 3.8.1.4 Rising adoption in healthcare and medical devices
- 3.8.2 Industry pitfalls & challenges
- 3.8.2.1 High production costs
- 3.8.2.2 Raw material supply
- 3.8.2.3 Regulatory challenges
- 3.8.1 Growth drivers
- 3.9 Market opportunities
- 3.9.1 Emerging applications in augmented and virtual reality
- 3.9.2 Growing demand for advanced sensing technologies
- 3.9.3 Expansion in autonomous vehicle systems
- 3.9.4 Development of biomimetic optical materials
- 3.10 Growth potential analysis
- 3.11 Regulatory framework analysis
- 3.11.1 Reach and ROHS regulations
- 3.11.2 Export control regulations
- 3.11.3 Environmental compliance requirements
- 3.11.4 Safety standards for handling and processing
- 3.12 Technology landscape
- 3.12.1 Current technological trends
- 3.12.2 Emerging technologies
- 3.12.3 R&D initiatives and innovation pipeline
- 3.12.4 Patent analysis
- 3.13 Porter's analysis
- 3.14 PESTEL analysis
Chapter 4 Competitive Landscape, 2024
- 4.1 Introduction
- 4.2 Market share analysis
- 4.2.1 Global market share by manufacturer
- 4.2.2 Regional market share by manufacturer
- 4.3 Competitive benchmarking
- 4.3.1 Product portfolio comparison
- 4.3.2 Technological capabilities comparison
- 4.3.3 R&D investment comparison
- 4.3.4 Manufacturing capacity comparison
- 4.4 Strategic initiatives & developments
- 4.4.1 Mergers & acquisitions
- 4.4.2 Partnerships & collaborations
- 4.4.3 Product launches & innovations
- 4.4.4 Expansion plans
- 4.5 Competitive positioning matrix
- 4.6 Strategic dashboard
Chapter 5 Market Estimates & Forecast, By Material Type, 2021-2034 (USD Billion) (Kilo Tons)
- 5.1 Key trends
- 5.2 Glass materials
- 5.2.1 Optical glass
- 5.2.2 Fused silica
- 5.2.3 Borosilicate glass
- 5.2.4 Specialty glass
- 5.2.5 Others
- 5.3 Polymeric materials
- 5.3.1 Polymethyl methacrylate (PMMA)
- 5.3.2 Polycarbonate (PC)
- 5.3.3 Cyclic olefin polymer (COP)
- 5.3.4 Cyclic olefin copolymer (COC)
- 5.3.5 Others
- 5.4 Crystalline materials
- 5.4.1 Sapphire
- 5.4.2 Silicon
- 5.4.3 Germanium
- 5.4.4 Zinc selenide
- 5.4.5 Calcium fluoride
- 5.4.6 Others
- 5.5 Ceramic materials
- 5.5.1 Transparent ceramics
- 5.5.2 Aluminum oxynitride (ALON)
- 5.5.3 Magnesium aluminate spinel
- 5.5.4 Yttrium aluminum garnet (YAG)
- 5.5.5 Others
- 5.6 Metallic materials
- 5.6.1 Aluminum
- 5.6.2 Silver
- 5.6.3 Gold
- 5.6.4 Others
- 5.7 Advanced composite materials
- 5.8 Photonic crystals
- 5.9 Metamaterials
- 5.10 Nanomaterials
- 5.11 Others
Chapter 6 Market Estimates & Forecast, By Application, 2021-2034 (USD Billion) (Kilo Tons)
- 6.1 Key trends
- 6.2 Optical components
- 6.2.1 Lenses
- 6.2.2 Mirrors
- 6.2.3 Prisms
- 6.2.4 Windows
- 6.2.5 Filters
- 6.2.6 Diffraction gratings
- 6.2.7 Others
- 6.3 Optoelectronic devices
- 6.3.1 Light emitting diodes (LEDs)
- 6.3.2 Laser diodes
- 6.3.3 Photodetectors
- 6.3.4 Solar cells
- 6.3.5 Optical modulators
- 6.3.6 Others
- 6.4 Imaging systems
- 6.4.1 Cameras
- 6.4.2 Microscopes
- 6.4.3 Telescopes
- 6.4.4 Thermal imaging
- 6.4.5 Others
- 6.5 Optical communication
- 6.5.1 Optical fibers
- 6.5.2 Waveguides
- 6.5.3 Optical amplifiers
- 6.5.4 Optical switches
- 6.5.5 Others
- 6.6 Sensing and measurement
- 6.6.1 Optical sensors
- 6.6.2 Spectroscopy
- 6.6.3 Interferometry
- 6.6.4 Others
- 6.7 Display technologies
- 6.7.1 LCD displays
- 6.7.2 OLED displays
- 6.7.3 AR/VR displays
- 6.7.4 Others
- 6.8 Others
Chapter 7 Market Estimates & Forecast, By End Use Industry, 2021-2034 (USD Billion) (Kilo Tons)
- 7.1 Key trends
- 7.2 Consumer electronics
- 7.2.1 Smartphones
- 7.2.2 Cameras
- 7.2.3 Wearable devices
- 7.2.4 Others
- 7.3 Healthcare and medical
- 7.3.1 Diagnostic equipment
- 7.3.2 Surgical devices
- 7.3.3 Therapeutic systems
- 7.3.4 Medical imaging
- 7.3.5 Others
- 7.4 Defense and security
- 7.4.1 Night vision
- 7.4.2 Targeting systems
- 7.4.3 Surveillance
- 7.4.4 Others
- 7.5 Telecommunications
- 7.5.1 Optical networks
- 7.5.2 Data centers
- 7.5.3 5g infrastructure
- 7.5.4 Others
- 7.6 Automotive
- 7.6.1 Lighting systems
- 7.6.2 Heads-up displays
- 7.6.3 Lidar systems
- 7.6.4 Driver assistance systems
- 7.6.5 Others
- 7.7 Aerospace
- 7.7.1 Avionics
- 7.7.2 Navigation systems
- 7.7.3 Satellite components
- 7.7.4 Others
- 7.8 Industrial
- 7.8.1 Machine vision
- 7.8.2 Laser processing
- 7.8.3 Quality control
- 7.8.4 Others
- 7.9 Energy
- 7.9.1 Solar energy
- 7.9.2 Photovoltaics
- 7.9.3 Others
- 7.10 Research and development
- 7.11 Others
Chapter 8 Market Estimates & Forecast, By Region, 2021-2034 (USD Billion) (Kilo Tons)
- 8.1 Key trends
- 8.2 North America
- 8.2.1 U.S.
- 8.2.2 Canada
- 8.3 Europe
- 8.3.1 UK
- 8.3.2 Germany
- 8.3.3 France
- 8.3.4 Italy
- 8.3.5 Spain
- 8.3.6 Rest of Europe
- 8.4 Asia Pacific
- 8.4.1 China
- 8.4.2 India
- 8.4.3 Japan
- 8.4.4 South Korea
- 8.4.5 Australia
- 8.4.6 Rest of Asia Pacific
- 8.5 Latin America
- 8.5.1 Brazil
- 8.5.2 Mexico
- 8.5.3 Argentina
- 8.5.4 Rest of Latin America
- 8.6 MEA
- 8.6.1 South Africa
- 8.6.2 Saudi Arabia
- 8.6.3 UAE
- 8.6.4 Rest of Middle East and Africa
Chapter 9 Company Profiles
- 9.1 CoorsTek
- 9.2 Corning Incorporated
- 9.3 Edmund Optics
- 9.4 Heraeus Holding
- 9.5 Hoya Corporation
- 9.6 II-VI Incorporated
- 9.7 Materion Corporation
- 9.8 Newport Corporation
- 9.9 Nikon Corporation
- 9.10 Ohara Corporation
- 9.11 SCHOTT
- 9.12 Sumitomo Electric Industries
- 9.13 Surmet Corporation
- 9.14 Thorlabs
- 9.15 ZEISS Group
