
|
市場調査レポート
商品コード
1699372
風力エネルギー市場の機会、成長促進要因、産業動向分析、2025年~2034年の予測Wind Energy Market Opportunity, Growth Drivers, Industry Trend Analysis, and Forecast 2025-2034 |
||||||
カスタマイズ可能
|
|||||||
| 風力エネルギー市場の機会、成長促進要因、産業動向分析、2025年~2034年の予測 |
|
出版日: 2025年02月25日
発行: Global Market Insights Inc.
ページ情報: 英文 160 Pages
納期: 2~3営業日
|

全表示
- 概要
- 目次
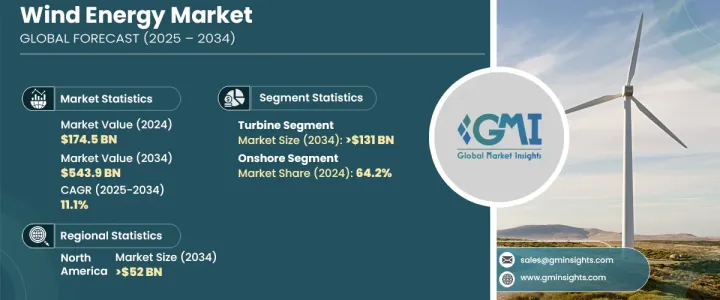
世界の風力エネルギー市場は、2024年に1,745億米ドルと評価され、2025年から2034年にかけてCAGR 11.1%で拡大すると予測されています。
成長の主な要因は、アジア、欧州、北米における大規模な開発と、洋上風力発電プロジェクトへの投資の増加です。再生可能エネルギーへの需要が急増するなか、風力発電は現在、世界の電力供給の10%以上に寄与しています。費用効率が高く、大容量のタービンと先進的なエネルギー生産設計への信頼が高まっており、市場浸透が加速しています。材料、空気力学、デジタル化における絶え間ない技術革新は、タービン効率を向上させ、性能の向上と採用の拡大につながっています。
いくつかの国がよりクリーンなエネルギーへの移行を進めており、風力エネルギーの導入は中国、ブラジル、オーストラリアで拡大しています。世界各国の政府は風力発電所の開発について野心的な目標を設定しており、市場成長を強化する規制上のインセンティブに支えられています。センサー、データ分析、機械学習などの先端技術の統合により、メンテナンスとタービン効率の最適化が進んでいます。風力発電やその他の自然エネルギーに注力する独立系発電事業者は、特に新興市場において、こうした技術革新を活用してポートフォリオを拡大しています。
| 市場範囲 | |
|---|---|
| 開始年 | 2024 |
| 予測年 | 2025-2034 |
| 開始金額 | 1,745億米ドル |
| 予測金額 | 5,439億米ドル |
| CAGR | 11.1% |
風力エネルギー市場は、コンポーネントによってタービン、支持構造、電気インフラ、その他に区分されます。タービンの分野は、業界がより大型で大容量のタービンにシフトするにつれて、2034年までに1,310億米ドルを超えると予測されています。先進的な浮体式プラットフォームは、洋上タービンの固定に関する課題を解決し、海底構造物に頼ることなく深海での展開を可能にしています。耐久性の向上と性能重視の設計は、主要地域でのタービン採用をさらに強化しています。
設置タイプ別に見ると、市場は陸上と洋上に分かれ、2024年のシェアは陸上風力発電が64.2%を占めています。経済拡大、エネルギー安全保障への懸念、二酸化炭素排出削減目標が陸上風力発電の採用を促進しています。最新のローター構成はブレードの位置決めを改善し、エネルギー出力を大幅に向上させています。新素材と最先端のブレード設計は、メンテナンスの必要性を減らしながら効率を高めており、陸上風力エネルギーを広く好まれるソリューションにしています。
米国では、風力エネルギー市場は2022年に117億米ドル、2023年に86億米ドル、2024年に172億米ドルを生み出しました。北米の風力エネルギー部門は、2034年までに520億米ドルを超える複合年間成長率で成長すると予想されています。市場の拡大は、政策支援、技術革新、進化する業界力学によって推進されます。グリッド統合とエネルギー貯蔵ソリューションの進歩は、風力発電の安定性と信頼性を高め、地域全体の採用をさらに促進しています。
目次
第1章 調査手法と調査範囲
- 調査デザイン
- 基本推定と計算
- 予測モデル
- 1次調査と検証
- 市場定義
第2章 エグゼクティブサマリー
第3章 業界洞察
- 業界エコシステム
- 規制状況
- 業界への影響要因
- 促進要因
- 業界の潜在的リスク&課題
- 成長可能性分析
- ポーター分析
- PESTEL分析
第4章 競合情勢
- イントロダクション
- 戦略ダッシュボード
- イノベーションとテクノロジーの展望
第5章 市場規模・予測:コンポーネント別、2021年~2034年
- 主要動向
- タービン
- タワー
- ブレード
- その他
- 支持構造
- 下部構造
- 基礎
- その他
- 電気インフラ
- 電線・ケーブル
- 変電所
- その他
- その他
第6章 市場規模・予測:タービン定格別、2021年~2034年
- 主要動向
- 2 MW以下
- 2~5 MW
- 5~8 MW
- 8~10 MW
- 10~12MW
- 12MW超
第7章 市場規模・予測:設置別、2021年~2034年
- 主要動向
- オンショア
- オフショア
第8章 市場規模・予測:地域別、2021年~2034年
- 主要動向
- 北米
- 米国
- カナダ
- 欧州
- ドイツ
- スペイン
- 英国
- フランス
- イタリア
- スウェーデン
- ポーランド
- オランダ
- アジア太平洋
- 中国
- インド
- 日本
- オーストラリア
- 世界のその他の地域
第9章 企業プロファイル
- Bergey Windpower
- CSSC Offshore Wind Power
- Doosan Corporation
- EOLINK
- Envision Group
- GE Vernova
- Goldwind
- Hitachi, Ltd.
- Mingyang Smart Energy Group
- Nordex SE
- Siemens Gamesa Renewable Energy
- Sinovel Wind Group
- Shanghai Electric
- Vestas
The Global Wind Energy Market was valued at USD 174.5 billion in 2024 and is projected to expand at a CAGR of 11.1% between 2025 and 2034. Growth is primarily fueled by significant developments in Asia, Europe, and North America, alongside rising investments in offshore wind projects. As the demand for renewable energy surges, wind power now contributes over 10% of the global electricity supply. Increasing reliance on cost-efficient, high-capacity turbines and advanced energy-producing designs is accelerating market penetration. Continuous innovations in materials, aerodynamics, and digitalization are improving turbine efficiency, leading to enhanced performance and greater adoption.
With several countries transitioning toward cleaner energy, wind energy deployment is expanding across China, Brazil, and Australia. Governments worldwide are setting ambitious targets for wind farm development, supported by regulatory incentives that strengthen market growth. The integration of advanced technologies, including sensors, data analytics, and machine learning, is optimizing maintenance and turbine efficiency. Independent Power Producers focusing on wind and other renewables are leveraging these innovations to expand their portfolios, particularly in emerging markets.
| Market Scope | |
|---|---|
| Start Year | 2024 |
| Forecast Year | 2025-2034 |
| Start Value | $174.5 Billion |
| Forecast Value | $543.9 Billion |
| CAGR | 11.1% |
The wind energy market is segmented based on components into turbines, support structures, electrical infrastructure, and others. The turbine segment is set to surpass USD 131 billion by 2034 as the industry shifts toward larger, high-capacity turbines. Advanced floating platforms are resolving offshore turbine anchoring challenges, enabling deployment in deeper waters without relying on seabed structures. Enhanced durability and performance-driven designs are further reinforcing turbine adoption across key regions.
By installation type, the market is divided into onshore and offshore segments, with onshore wind energy holding a 64.2% share in 2024. Economic expansion, energy security concerns, and carbon emission reduction goals are driving onshore wind adoption. Modern rotor configurations are improving blade positioning, significantly increasing energy output. New materials and cutting-edge blade designs are enhancing efficiency while reducing maintenance requirements, making onshore wind energy a widely preferred solution.
In the United States, the wind energy market generated USD 11.7 billion in 2022, USD 8.6 billion in 2023, and USD 17.2 billion in 2024. The North American wind energy sector is expected to grow at a compound annual growth rate exceeding USD 52 billion by 2034. Market expansion is propelled by policy support, technological innovations, and evolving industry dynamics. Advancements in grid integration and energy storage solutions are enhancing wind power stability and reliability, further driving adoption across the region.
Table of Contents
Chapter 1 Methodology & Scope
- 1.1 Research design
- 1.2 Base estimates & calculations
- 1.3 Forecast model
- 1.4 Primary research & validation
- 1.4.1 Primary sources
- 1.4.2 Data mining sources
- 1.5 Market definitions
Chapter 2 Executive Summary
- 2.1 Industry synopsis, 2021 – 2034
Chapter 3 Industry Insights
- 3.1 Industry ecosystem
- 3.2 Regulatory landscape
- 3.3 Industry impact forces
- 3.3.1 Growth drivers
- 3.3.2 Industry pitfalls & challenges
- 3.4 Growth potential analysis
- 3.5 Porter's analysis
- 3.5.1 Bargaining power of suppliers
- 3.5.2 Bargaining power of buyers
- 3.5.3 Threat of new entrants
- 3.5.4 Threat of substitutes
- 3.6 PESTEL analysis
Chapter 4 Competitive landscape, 2024
- 4.1 Introduction
- 4.2 Strategic dashboard
- 4.3 Innovation & technology landscape
Chapter 5 Market Size and Forecast, By Component, 2021 – 2034 (USD Million)
- 5.1 Key trends
- 5.2 Turbine
- 5.2.1 Tower
- 5.2.2 Blades
- 5.2.3 Others
- 5.3 Support structure
- 5.3.1 Substructure steel
- 5.3.2 Foundation
- 5.3.3 Others
- 5.4 Electrical infrastructure
- 5.4.1 Wires & cables
- 5.4.2 Substation
- 5.4.3 Others
- 5.5 Others
Chapter 6 Market Size and Forecast, By Turbine Rating, 2021 – 2034 (USD Million & MW)
- 6.1 Key trends
- 6.2 ≤ 2 MW
- 6.3 >2≤ 5 MW
- 6.4 >5≤ 8 MW
- 6.5 >8≤10 MW
- 6.6 >10≤ 12 MW
- 6.7 > 12 MW
Chapter 7 Market Size and Forecast, By Installation, 2021 – 2034 (USD Million & MW)
- 7.1 Key trends
- 7.2 Onshore
- 7.3 Offshore
Chapter 8 Market Size and Forecast, By Region, 2021 – 2034 (USD Million & MW)
- 8.1 Key trends
- 8.2 North America
- 8.2.1 U.S.
- 8.2.2 Canada
- 8.3 Europe
- 8.3.1 Germany
- 8.3.2 Spain
- 8.3.3 UK
- 8.3.4 France
- 8.3.5 Italy
- 8.3.6 Sweden
- 8.3.7 Poland
- 8.3.8 Netherlands
- 8.4 Asia Pacific
- 8.4.1 China
- 8.4.2 India
- 8.4.3 Japan
- 8.4.4 Australia
- 8.5 Rest of World
Chapter 9 Company Profiles
- 9.1 Bergey Windpower
- 9.2 CSSC Offshore Wind Power
- 9.3 Doosan Corporation
- 9.4 EOLINK
- 9.5 Envision Group
- 9.6 GE Vernova
- 9.7 Goldwind
- 9.8 Hitachi, Ltd.
- 9.9 Mingyang Smart Energy Group
- 9.10 Nordex SE
- 9.11 Siemens Gamesa Renewable Energy
- 9.12 Sinovel Wind Group
- 9.13 Shanghai Electric
- 9.14 Vestas

